Slovenia Laboratory Electronic Balance Market (2026-2032) | Revenue, Value, Consumer Insights, Segmentation, Competition, Strategy, Outlook, Challenges, Analysis, Investment Trends, Supply, Industry, Pricing Analysis, Restraints, Forecast, Competitive, Demand, Drivers, Share, Growth, Opportunities, Companies, Strategic Insights, Trends, Segments, Size
Market Forecast By Product Type (Analytical Balance, Precision Balance, Microbalance, Top-Loading Balance, Portable Balance), By Capacity Range (Below 100g, 100g-500g, 500g-1000g, 1kg-5kg, Above 5kg), By Accuracy Level (0.0001g, 0.001g, 0.01g, 0.1g, 1g), By Application (Pharmaceutical Testing, Chemical Analysis, Clinical Diagnostics, Food & Beverage Testing, Industrial Weighing), By End User (Research Labs, Academic Institutes, Hospitals, Diagnostic Centers, Industrial Labs) And Competitive Landscape
| Product Code: ETC12616548 | Publication Date: Apr 2025 | Updated Date: Apr 2026 | Product Type: Market Research Report | |
| Publisher: 6Wresearch | No. of Pages: 65 | No. of Figures: 34 | No. of Tables: 19 | |
Slovenia Laboratory Electronic Balance Market Size (2020-2030)
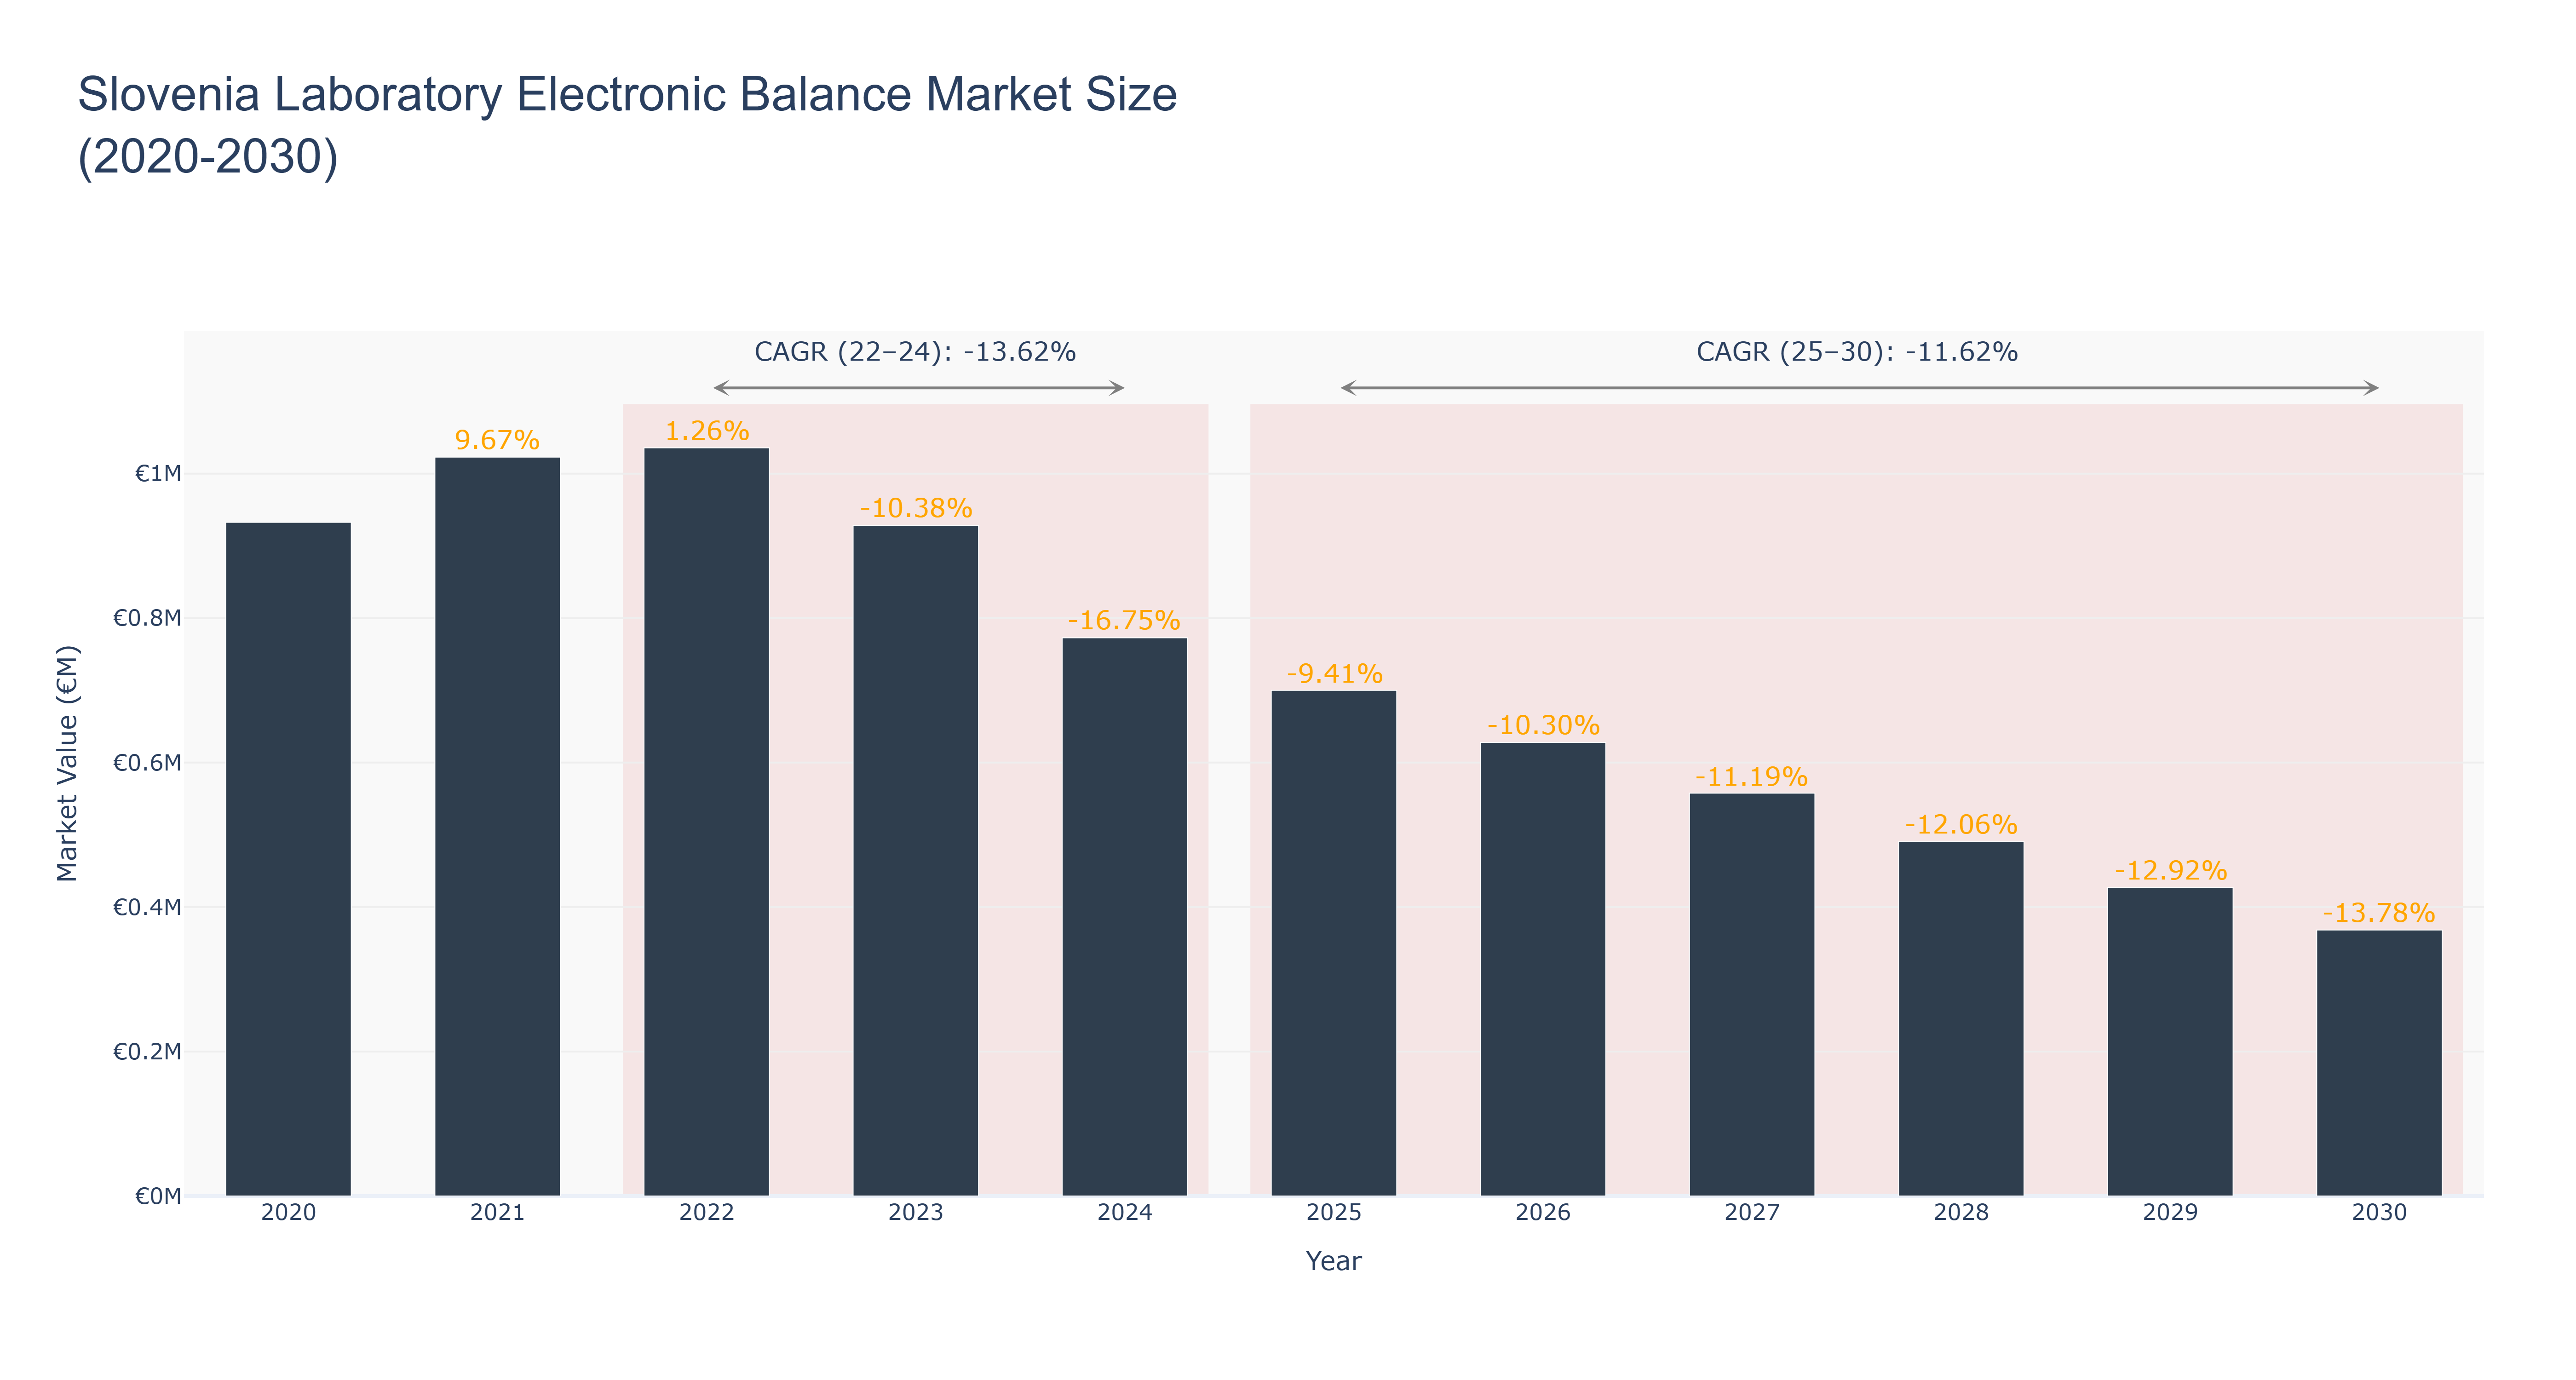
The Slovenia Laboratory Electronic Balance Market experienced a peak size of €1.04 million in 2022, followed by a decline to €0.37 million in 2030. The actual market size decreased steadily from 2020 to 2024, with a notable drop in 2023 due to a significant -10.38% growth rate. The forecasted market size is expected to continue declining until 2030. The CAGR for the period 2022-24 was -13.62%, while for 2025-30, it is projected at -11.62%. The market downturn can be attributed to factors such as technological advancements leading to decreased demand for traditional electronic balances and economic fluctuations affecting investment in laboratory equipment. Looking ahead, Slovenia is set to invest in research and development initiatives to enhance the country's technological capabilities and foster innovation in laboratory equipment manufacturing, aiming to revitalize the market in the near future.
Slovenia Laboratory Electronic Balance Market: Production & Trade Performance (2019-2025)
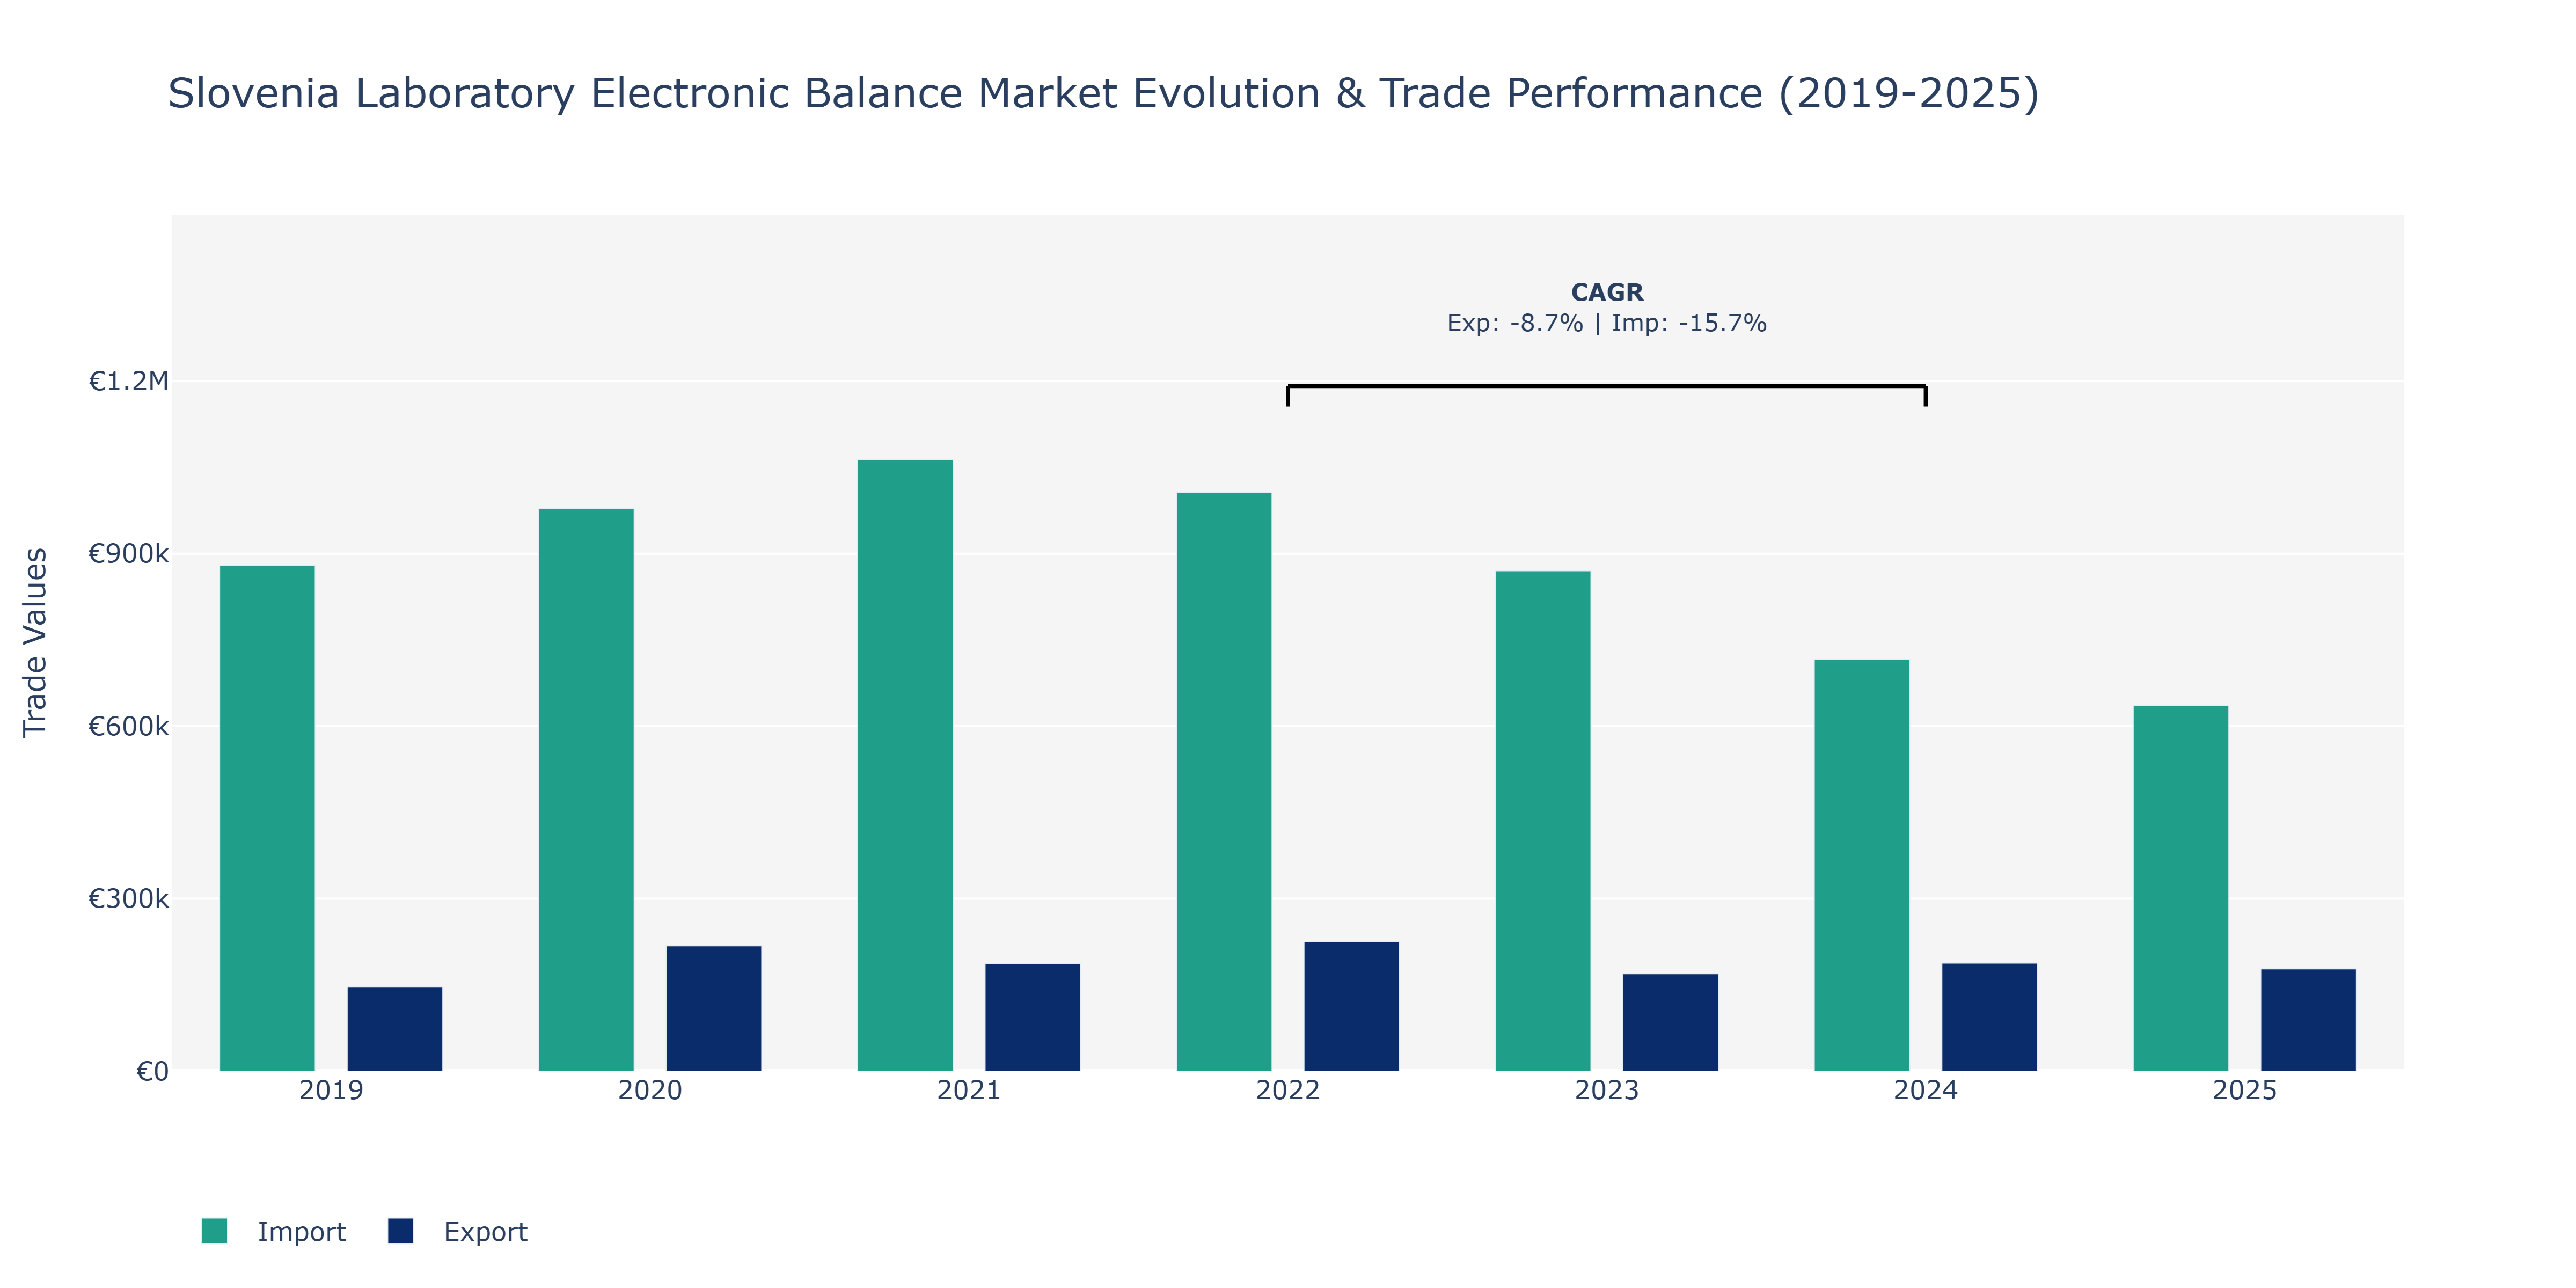
Between 2019 and 2025, Slovenia's Laboratory Electronic Balance Market saw fluctuations in both Exports and Imports. Exports increased from €146.36 thousand in 2019 to €225.65 thousand in 2022, marking a peak, before decreasing to €178.01 thousand in 2025. Conversely, Imports followed a different trend, rising steadily from €879.78 thousand in 2019 to €1.06 million in 2021, before declining to €636.49 thousand in 2025. The decline in Exports from 2022 to 2025 might be attributed to factors such as fluctuating global demand for laboratory equipment or increased competition from other markets. Conversely, the decrease in Imports post-2021 could be influenced by shifts in domestic manufacturing capabilities or changes in trade policies impacting the importation of electronic balances. These trends highlight the market's sensitivity to both global and local economic factors, necessitating adaptability for stakeholders in Slovenia's Laboratory Electronic Balance Market.
Key Highlights of the Report:
- Slovenia Laboratory Electronic Balance Market Outlook
- Market Size of Slovenia Laboratory Electronic Balance Market, 2025
- Forecast of Slovenia Laboratory Electronic Balance Market, 2032
- Historical Data and Forecast of Slovenia Laboratory Electronic Balance Revenues & Volume for the Period 2022-2032F
- Slovenia Laboratory Electronic Balance Market Trend Evolution
- Slovenia Laboratory Electronic Balance Market Drivers and Challenges
- Slovenia Laboratory Electronic Balance Price Trends
- Slovenia Laboratory Electronic Balance Porter's Five Forces
- Slovenia Laboratory Electronic Balance Industry Life Cycle
- Historical Data and Forecast of Slovenia Laboratory Electronic Balance Market Revenues & Volume By Product Type for the Period 2022-2032F
- Historical Data and Forecast of Slovenia Laboratory Electronic Balance Market Revenues & Volume By Analytical Balance for the Period 2022-2032F
- Historical Data and Forecast of Slovenia Laboratory Electronic Balance Market Revenues & Volume By Precision Balance for the Period 2022-2032F
- Historical Data and Forecast of Slovenia Laboratory Electronic Balance Market Revenues & Volume By Microbalance for the Period 2022-2032F
- Historical Data and Forecast of Slovenia Laboratory Electronic Balance Market Revenues & Volume By Top-Loading Balance for the Period 2022-2032F
- Historical Data and Forecast of Slovenia Laboratory Electronic Balance Market Revenues & Volume By Portable Balance for the Period 2022 - 2032F
- Historical Data and Forecast of Slovenia Laboratory Electronic Balance Market Revenues & Volume By Capacity Range for the Period 2022-2032F
- Historical Data and Forecast of Slovenia Laboratory Electronic Balance Market Revenues & Volume By Below 100g for the Period 2022-2032F
- Historical Data and Forecast of Slovenia Laboratory Electronic Balance Market Revenues & Volume By 100g-500g for the Period 2022-2032F
- Historical Data and Forecast of Slovenia Laboratory Electronic Balance Market Revenues & Volume By 500g-1000g for the Period 2022-2032F
- Historical Data and Forecast of Slovenia Laboratory Electronic Balance Market Revenues & Volume By 1kg-5kg for the Period 2022-2032F
- Historical Data and Forecast of Slovenia Laboratory Electronic Balance Market Revenues & Volume By Above 5kg for the Period 2022 - 2032F
- Historical Data and Forecast of Slovenia Laboratory Electronic Balance Market Revenues & Volume By Accuracy Level for the Period 2022-2032F
- Historical Data and Forecast of Slovenia Laboratory Electronic Balance Market Revenues & Volume By 0.0001g for the Period 2022-2032F
- Historical Data and Forecast of Slovenia Laboratory Electronic Balance Market Revenues & Volume By 0.001g for the Period 2022-2032F
- Historical Data and Forecast of Slovenia Laboratory Electronic Balance Market Revenues & Volume By 0.01g for the Period 2022-2032F
- Historical Data and Forecast of Slovenia Laboratory Electronic Balance Market Revenues & Volume By 0.1g for the Period 2022-2032F
- Historical Data and Forecast of Slovenia Laboratory Electronic Balance Market Revenues & Volume By 1g for the Period 2022 - 2032F
- Historical Data and Forecast of Slovenia Laboratory Electronic Balance Market Revenues & Volume By Application for the Period 2022-2032F
- Historical Data and Forecast of Slovenia Laboratory Electronic Balance Market Revenues & Volume By Pharmaceutical Testing for the Period 2022-2032F
- Historical Data and Forecast of Slovenia Laboratory Electronic Balance Market Revenues & Volume By Chemical Analysis for the Period 2022-2032F
- Historical Data and Forecast of Slovenia Laboratory Electronic Balance Market Revenues & Volume By Clinical Diagnostics for the Period 2022-2032F
- Historical Data and Forecast of Slovenia Laboratory Electronic Balance Market Revenues & Volume By Food & Beverage Testing for the Period 2022-2032F
- Historical Data and Forecast of Slovenia Laboratory Electronic Balance Market Revenues & Volume By Industrial Weighing for the Period 2022 - 2032F
- Historical Data and Forecast of Slovenia Laboratory Electronic Balance Market Revenues & Volume By End User for the Period 2022-2032F
- Historical Data and Forecast of Slovenia Laboratory Electronic Balance Market Revenues & Volume By Research Labs for the Period 2022-2032F
- Historical Data and Forecast of Slovenia Laboratory Electronic Balance Market Revenues & Volume By Academic Institutes for the Period 2022-2032F
- Historical Data and Forecast of Slovenia Laboratory Electronic Balance Market Revenues & Volume By Hospitals for the Period 2022-2032F
- Historical Data and Forecast of Slovenia Laboratory Electronic Balance Market Revenues & Volume By Diagnostic Centers for the Period 2022 - 2032F
- Historical Data and Forecast of Slovenia Laboratory Electronic Balance Market Revenues & Volume By Industrial Labs for the Period 2022 - 2032F
- Slovenia Laboratory Electronic Balance Import Export Trade Statistics
- Market Opportunity Assessment By Product Type
- Market Opportunity Assessment By Capacity Range
- Market Opportunity Assessment By Accuracy Level
- Market Opportunity Assessment By Application
- Market Opportunity Assessment By End User
- Slovenia Laboratory Electronic Balance Top Companies Market Share
- Slovenia Laboratory Electronic Balance Competitive Benchmarking By Technical and Operational Parameters
- Slovenia Laboratory Electronic Balance Company Profiles
- Slovenia Laboratory Electronic Balance Key Strategic Recommendations
Frequently Asked Questions About the Market Study (FAQs):
6Wresearch actively monitors the Slovenia Laboratory Electronic Balance Market and publishes its comprehensive annual report, highlighting emerging trends, growth drivers, revenue analysis, and forecast outlook. Our insights help businesses to make data-backed strategic decisions with ongoing market dynamics. Our analysts track relevent industries related to the Slovenia Laboratory Electronic Balance Market, allowing our clients with actionable intelligence and reliable forecasts tailored to emerging regional needs.
Yes, we provide customisation as per your requirements. To learn more, feel free to contact us on sales@6wresearch.com
1 Executive Summary |
2 Introduction |
2.1 Key Highlights of the Report |
2.2 Report Description |
2.3 Market Scope & Segmentation |
2.4 Research Methodology |
2.5 Assumptions |
3 Slovenia Laboratory Electronic Balance Market Overview |
3.1 Slovenia Country Macro Economic Indicators |
3.2 Slovenia Laboratory Electronic Balance Market Revenues & Volume, 2022 & 2032F |
3.3 Slovenia Laboratory Electronic Balance Market - Industry Life Cycle |
3.4 Slovenia Laboratory Electronic Balance Market - Porter's Five Forces |
3.5 Slovenia Laboratory Electronic Balance Market Revenues & Volume Share, By Product Type, 2022 & 2032F |
3.6 Slovenia Laboratory Electronic Balance Market Revenues & Volume Share, By Capacity Range, 2022 & 2032F |
3.7 Slovenia Laboratory Electronic Balance Market Revenues & Volume Share, By Accuracy Level, 2022 & 2032F |
3.8 Slovenia Laboratory Electronic Balance Market Revenues & Volume Share, By Application, 2022 & 2032F |
3.9 Slovenia Laboratory Electronic Balance Market Revenues & Volume Share, By End User, 2022 & 2032F |
4 Slovenia Laboratory Electronic Balance Market Dynamics |
4.1 Impact Analysis |
4.2 Market Drivers |
4.2.1 Increasing demand for high-precision weighing instruments in research and development activities. |
4.2.2 Technological advancements leading to the development of more accurate and efficient electronic balances. |
4.2.3 Growing emphasis on quality control and assurance in industries requiring precise measurements. |
4.3 Market Restraints |
4.3.1 High initial investment costs associated with purchasing laboratory electronic balances. |
4.3.2 Limited awareness and adoption of advanced electronic balance technologies in certain industries. |
4.3.3 Regulatory challenges and compliance requirements impacting market entry barriers. |
5 Slovenia Laboratory Electronic Balance Market Trends |
6 Slovenia Laboratory Electronic Balance Market, By Types |
6.1 Slovenia Laboratory Electronic Balance Market, By Product Type |
6.1.1 Overview and Analysis |
6.1.2 Slovenia Laboratory Electronic Balance Market Revenues & Volume, By Product Type, 2022 - 2032F |
6.1.3 Slovenia Laboratory Electronic Balance Market Revenues & Volume, By Analytical Balance, 2022 - 2032F |
6.1.4 Slovenia Laboratory Electronic Balance Market Revenues & Volume, By Precision Balance, 2022 - 2032F |
6.1.5 Slovenia Laboratory Electronic Balance Market Revenues & Volume, By Microbalance, 2022 - 2032F |
6.1.6 Slovenia Laboratory Electronic Balance Market Revenues & Volume, By Top-Loading Balance, 2022 - 2032F |
6.1.7 Slovenia Laboratory Electronic Balance Market Revenues & Volume, By Portable Balance, 2022 - 2032F |
6.2 Slovenia Laboratory Electronic Balance Market, By Capacity Range |
6.2.1 Overview and Analysis |
6.2.2 Slovenia Laboratory Electronic Balance Market Revenues & Volume, By Below 100g, 2022 - 2032F |
6.2.3 Slovenia Laboratory Electronic Balance Market Revenues & Volume, By 100g-500g, 2022 - 2032F |
6.2.4 Slovenia Laboratory Electronic Balance Market Revenues & Volume, By 500g-1000g, 2022 - 2032F |
6.2.5 Slovenia Laboratory Electronic Balance Market Revenues & Volume, By 1kg-5kg, 2022 - 2032F |
6.2.6 Slovenia Laboratory Electronic Balance Market Revenues & Volume, By Above 5kg, 2022 - 2032F |
6.3 Slovenia Laboratory Electronic Balance Market, By Accuracy Level |
6.3.1 Overview and Analysis |
6.3.2 Slovenia Laboratory Electronic Balance Market Revenues & Volume, By 0.0001g, 2022 - 2032F |
6.3.3 Slovenia Laboratory Electronic Balance Market Revenues & Volume, By 0.001g, 2022 - 2032F |
6.3.4 Slovenia Laboratory Electronic Balance Market Revenues & Volume, By 0.01g, 2022 - 2032F |
6.3.5 Slovenia Laboratory Electronic Balance Market Revenues & Volume, By 0.1g, 2022 - 2032F |
6.3.6 Slovenia Laboratory Electronic Balance Market Revenues & Volume, By 1g, 2022 - 2032F |
6.4 Slovenia Laboratory Electronic Balance Market, By Application |
6.4.1 Overview and Analysis |
6.4.2 Slovenia Laboratory Electronic Balance Market Revenues & Volume, By Pharmaceutical Testing, 2022 - 2032F |
6.4.3 Slovenia Laboratory Electronic Balance Market Revenues & Volume, By Chemical Analysis, 2022 - 2032F |
6.4.4 Slovenia Laboratory Electronic Balance Market Revenues & Volume, By Clinical Diagnostics, 2022 - 2032F |
6.4.5 Slovenia Laboratory Electronic Balance Market Revenues & Volume, By Food & Beverage Testing, 2022 - 2032F |
6.4.6 Slovenia Laboratory Electronic Balance Market Revenues & Volume, By Industrial Weighing, 2022 - 2032F |
6.5 Slovenia Laboratory Electronic Balance Market, By End User |
6.5.1 Overview and Analysis |
6.5.2 Slovenia Laboratory Electronic Balance Market Revenues & Volume, By Research Labs, 2022 - 2032F |
6.5.3 Slovenia Laboratory Electronic Balance Market Revenues & Volume, By Academic Institutes, 2022 - 2032F |
6.5.4 Slovenia Laboratory Electronic Balance Market Revenues & Volume, By Hospitals, 2022 - 2032F |
6.5.5 Slovenia Laboratory Electronic Balance Market Revenues & Volume, By Diagnostic Centers, 2022 - 2032F |
6.5.6 Slovenia Laboratory Electronic Balance Market Revenues & Volume, By Industrial Labs, 2022 - 2032F |
7 Slovenia Laboratory Electronic Balance Market Import-Export Trade Statistics |
7.1 Slovenia Laboratory Electronic Balance Market Export to Major Countries |
7.2 Slovenia Laboratory Electronic Balance Market Imports from Major Countries |
8 Slovenia Laboratory Electronic Balance Market Key Performance Indicators |
8.1 Rate of adoption of new electronic balance technologies in laboratories. |
8.2 Number of research and development projects utilizing laboratory electronic balances. |
8.3 Percentage of industries implementing quality control programs that include the use of electronic balances. |
9 Slovenia Laboratory Electronic Balance Market - Opportunity Assessment |
9.1 Slovenia Laboratory Electronic Balance Market Opportunity Assessment, By Product Type, 2022 & 2032F |
9.2 Slovenia Laboratory Electronic Balance Market Opportunity Assessment, By Capacity Range, 2022 & 2032F |
9.3 Slovenia Laboratory Electronic Balance Market Opportunity Assessment, By Accuracy Level, 2022 & 2032F |
9.4 Slovenia Laboratory Electronic Balance Market Opportunity Assessment, By Application, 2022 & 2032F |
9.5 Slovenia Laboratory Electronic Balance Market Opportunity Assessment, By End User, 2022 & 2032F |
10 Slovenia Laboratory Electronic Balance Market - Competitive Landscape |
10.1 Slovenia Laboratory Electronic Balance Market Revenue Share, By Companies, 2025 |
10.2 Slovenia Laboratory Electronic Balance Market Competitive Benchmarking, By Operating and Technical Parameters |
11 Company Profiles |
12 Recommendations |
13 Disclaimer |
Export potential assessment - trade Analytics for 2030
Export potential enables firms to identify high-growth global markets with greater confidence by combining advanced trade intelligence with a structured quantitative methodology. The framework analyzes emerging demand trends and country-level import patterns while integrating macroeconomic and trade datasets such as GDP and population forecasts, bilateral import–export flows, tariff structures, elasticity differentials between developed and developing economies, geographic distance, and import demand projections. Using weighted trade values from 2020–2024 as the base period to project country-to-country export potential for 2030, these inputs are operationalized through calculated drivers such as gravity model parameters, tariff impact factors, and projected GDP per-capita growth. Through an analysis of hidden potentials, demand hotspots, and market conditions that are most favorable to success, this method enables firms to focus on target countries, maximize returns, and global expansion with data, backed by accuracy.
By factoring in the projected importer demand gap that is currently unmet and could be potential opportunity, it identifies the potential for the Exporter (Country) among 190 countries, against the general trade analysis, which identifies the biggest importer or exporter.
To discover high-growth global markets and optimize your business strategy:
Click Here
Pricing
- Single User License$ 1,995
- Department License$ 2,400
- Site License$ 3,120
- Global License$ 3,795

Search
Thought Leadership and Analyst Meet


Our Clients
Latest Reports
- Canada Cloud CFD Market (2026-2032) | Size & Revenue, Industry, Growth, Competitive Landscape, Forecast, Segmentation, Value, Outlook, Trends, Share, Analysis, Companies
- Taiwan Food Delivery Platform Market (2026-2032) | Companies, Outlook, Analysis, Trends, Value, Revenue, Segmentation, Share, Forecast, Competitive Landscape, Growth, Size & Forecast
- United Kingdom (UK) Long-term Care Insurance Market (2026-2032) | Growth, Share, Consumer Insights, Drivers, Opportunities, Competition, Pricing Analysis, Segments, Restraints, Companies, Competitive, Value, Outlook, Size, Demand, Analysis, Challenges, Strategic Insights, Investment Trends, Revenue, Trends, Supply, Forecast
- United Kingdom (UK) Long Term Care Market (2026-2032) | Companies, Outlook, Analysis, Trends, Value, Revenue, Segmentation, Share, Forecast, Competitive Landscape, Growth, Size & Forecast
- Iraq Insulation and Waterproofing Market (2026-2032) | Outlook, Drivers, Growth, Size, Share, Industry, Revenue, Trends, Demand, Competitive, Strategic Insights, Opportunities, Segments, Companies, Challenges, Strategy, Consumer Insights, Analysis, Investment Trends, Value, Segmentation, Forecast, Restraints
- India Switchgear Market Outlook (2026-2032) | Size, Share, Trends, Growth, Revenue, Forecast, Analysis, Value, Outlook
- Pakistan Contraceptive Implants Market (2025-2031) | Demand, Growth, Size, Share, Industry, Pricing Analysis, Competitive, Strategic Insights, Strategy, Consumer Insights, Analysis, Investment Trends, Opportunities, Revenue, Segments, Value, Segmentation, Supply, Forecast, Restraints, Outlook, Competition, Drivers, Trends, Companies, Challenges
- Sri Lanka Packaging Market (2026-2032) | Outlook, Competition, Drivers, Trends, Demand, Pricing Analysis, Competitive, Strategic Insights, Companies, Challenges, Strategy, Consumer Insights, Analysis, Investment Trends, Opportunities, Growth, Size, Share, Industry, Revenue, Segments, Value, Segmentation, Supply, Forecast, Restraints
- India Kids Watches Market (2026-2032) | Strategy, Consumer Insights, Analysis, Investment Trends, Opportunities, Growth, Size, Share, Industry, Revenue, Segments, Value, Segmentation, Supply, Forecast, Restraints, Outlook, Competition, Drivers, Trends, Demand, Pricing Analysis, Competitive, Strategic Insights, Companies, Challenges
- Saudi Arabia Core Assurance Service Market (2025-2031) | Strategy, Consumer Insights, Analysis, Investment Trends, Opportunities, Growth, Size, Share, Industry, Revenue, Segments, Value, Segmentation, Supply, Forecast, Restraints, Outlook, Competition, Drivers, Trends, Demand, Pricing Analysis, Competitive, Strategic Insights, Companies, Challenges
Industry Events and Analyst Meet

India EV Show 2026

EV tech India Expo 2026

Auto Tech Asia 2026

Battery Tech India 2026

Smart Production Solutions Guangzhou 2026
Whitepaper
- Middle East & Africa Commercial Security Market Click here to view more.
- Middle East & Africa Fire Safety Systems & Equipment Market Click here to view more.
- GCC Drone Market Click here to view more.
- Middle East Lighting Fixture Market Click here to view more.
- GCC Physical & Perimeter Security Market Click here to view more.
6WResearch In News
- Doha a strategic location for EV manufacturing hub: IPA Qatar
- Demand for luxury TVs surging in the GCC, says Samsung
- Empowering Growth: The Thriving Journey of Bangladesh’s Cable Industry
- Demand for luxury TVs surging in the GCC, says Samsung
- Video call with a traditional healer? Once unthinkable, it’s now common in South Africa
- Intelligent Buildings To Smooth GCC’s Path To Net Zero