Slovenia Manhole Cover Market (2026-2032) | Restraints, Supply, Value, Pricing Analysis, Segments, Growth, Demand, Share, Forecast, Companies, Size, Revenue, Strategic Insights, Segmentation, Competition, Opportunities, Investment Trends, Challenges, Analysis, Industry, Trends, Drivers, Strategy, Competitive, Consumer Insights, Outlook
Market Forecast By Type (Cast Iron Cover, Composite Cover, Concrete Cover), By Application (Drainage Systems, Utility Access, Sewer Systems), By End User (Municipal Corporations, Construction Industry, Infrastructure Projects), By Distribution Channel (Direct Sales, Wholesale Suppliers, Online Sales) And Competitive Landscape
| Product Code: ETC12909540 | Publication Date: Apr 2025 | Updated Date: Apr 2026 | Product Type: Market Research Report | |
| Publisher: 6Wresearch | Author: Sachin Kumar Rai | No. of Pages: 65 | No. of Figures: 34 | No. of Tables: 19 |
Slovenia Manhole Cover Market Size (2020-2030)
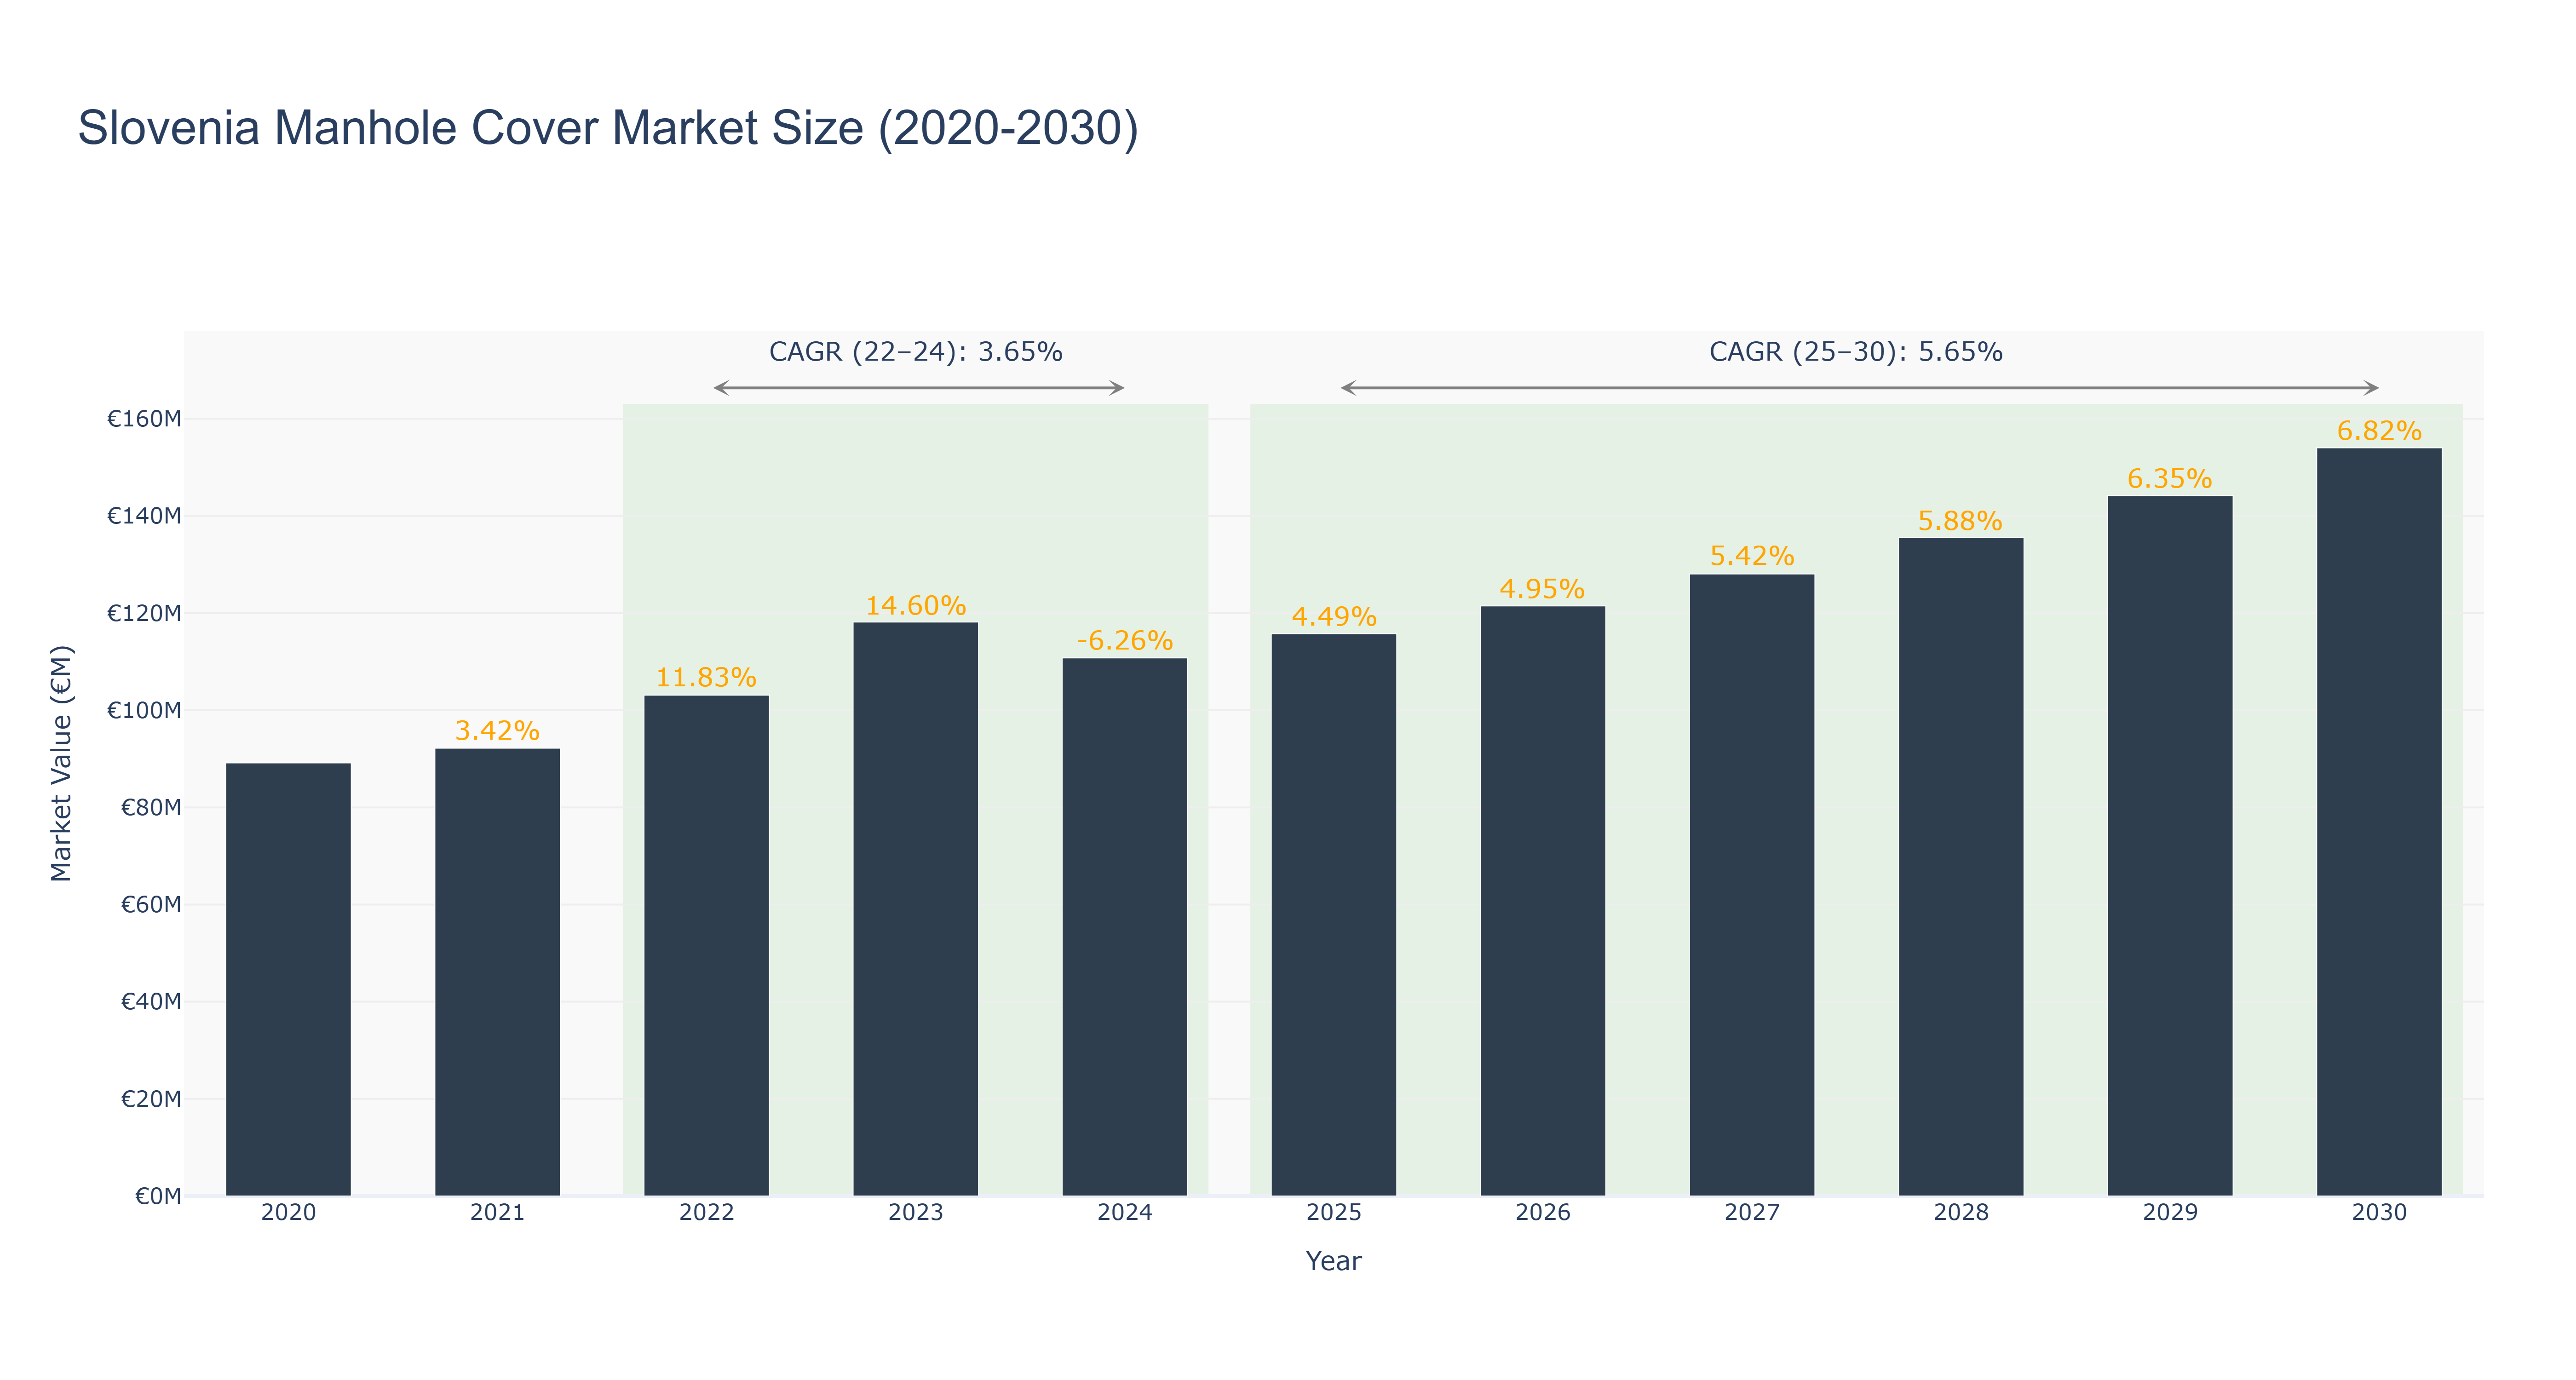
The Slovenia Manhole Cover Market experienced significant fluctuations between 2020 and 2024, with a peak market size of €118.16 million in 2023, reflecting a robust growth of 14.60% that year. However, this was followed by a notable decline of 6.26% in 2024, resulting in a market size of €110.77 million. The compound annual growth rate (CAGR) for the actual period from 2022 to 2024 stands at 3.65%, indicating moderate growth amidst market volatility. Looking ahead, the forecasted period from 2025 to 2030 shows a more optimistic outlook, with a projected CAGR of 5.65% and a market size reaching €154.03 million by 2030. This growth can be attributed to ongoing infrastructure investments and urban development projects in Slovenia, which are expected to drive demand for manhole covers as part of broader public works initiatives.
Slovenia Manhole Cover Market: Production & Trade Performance (2019-2025)
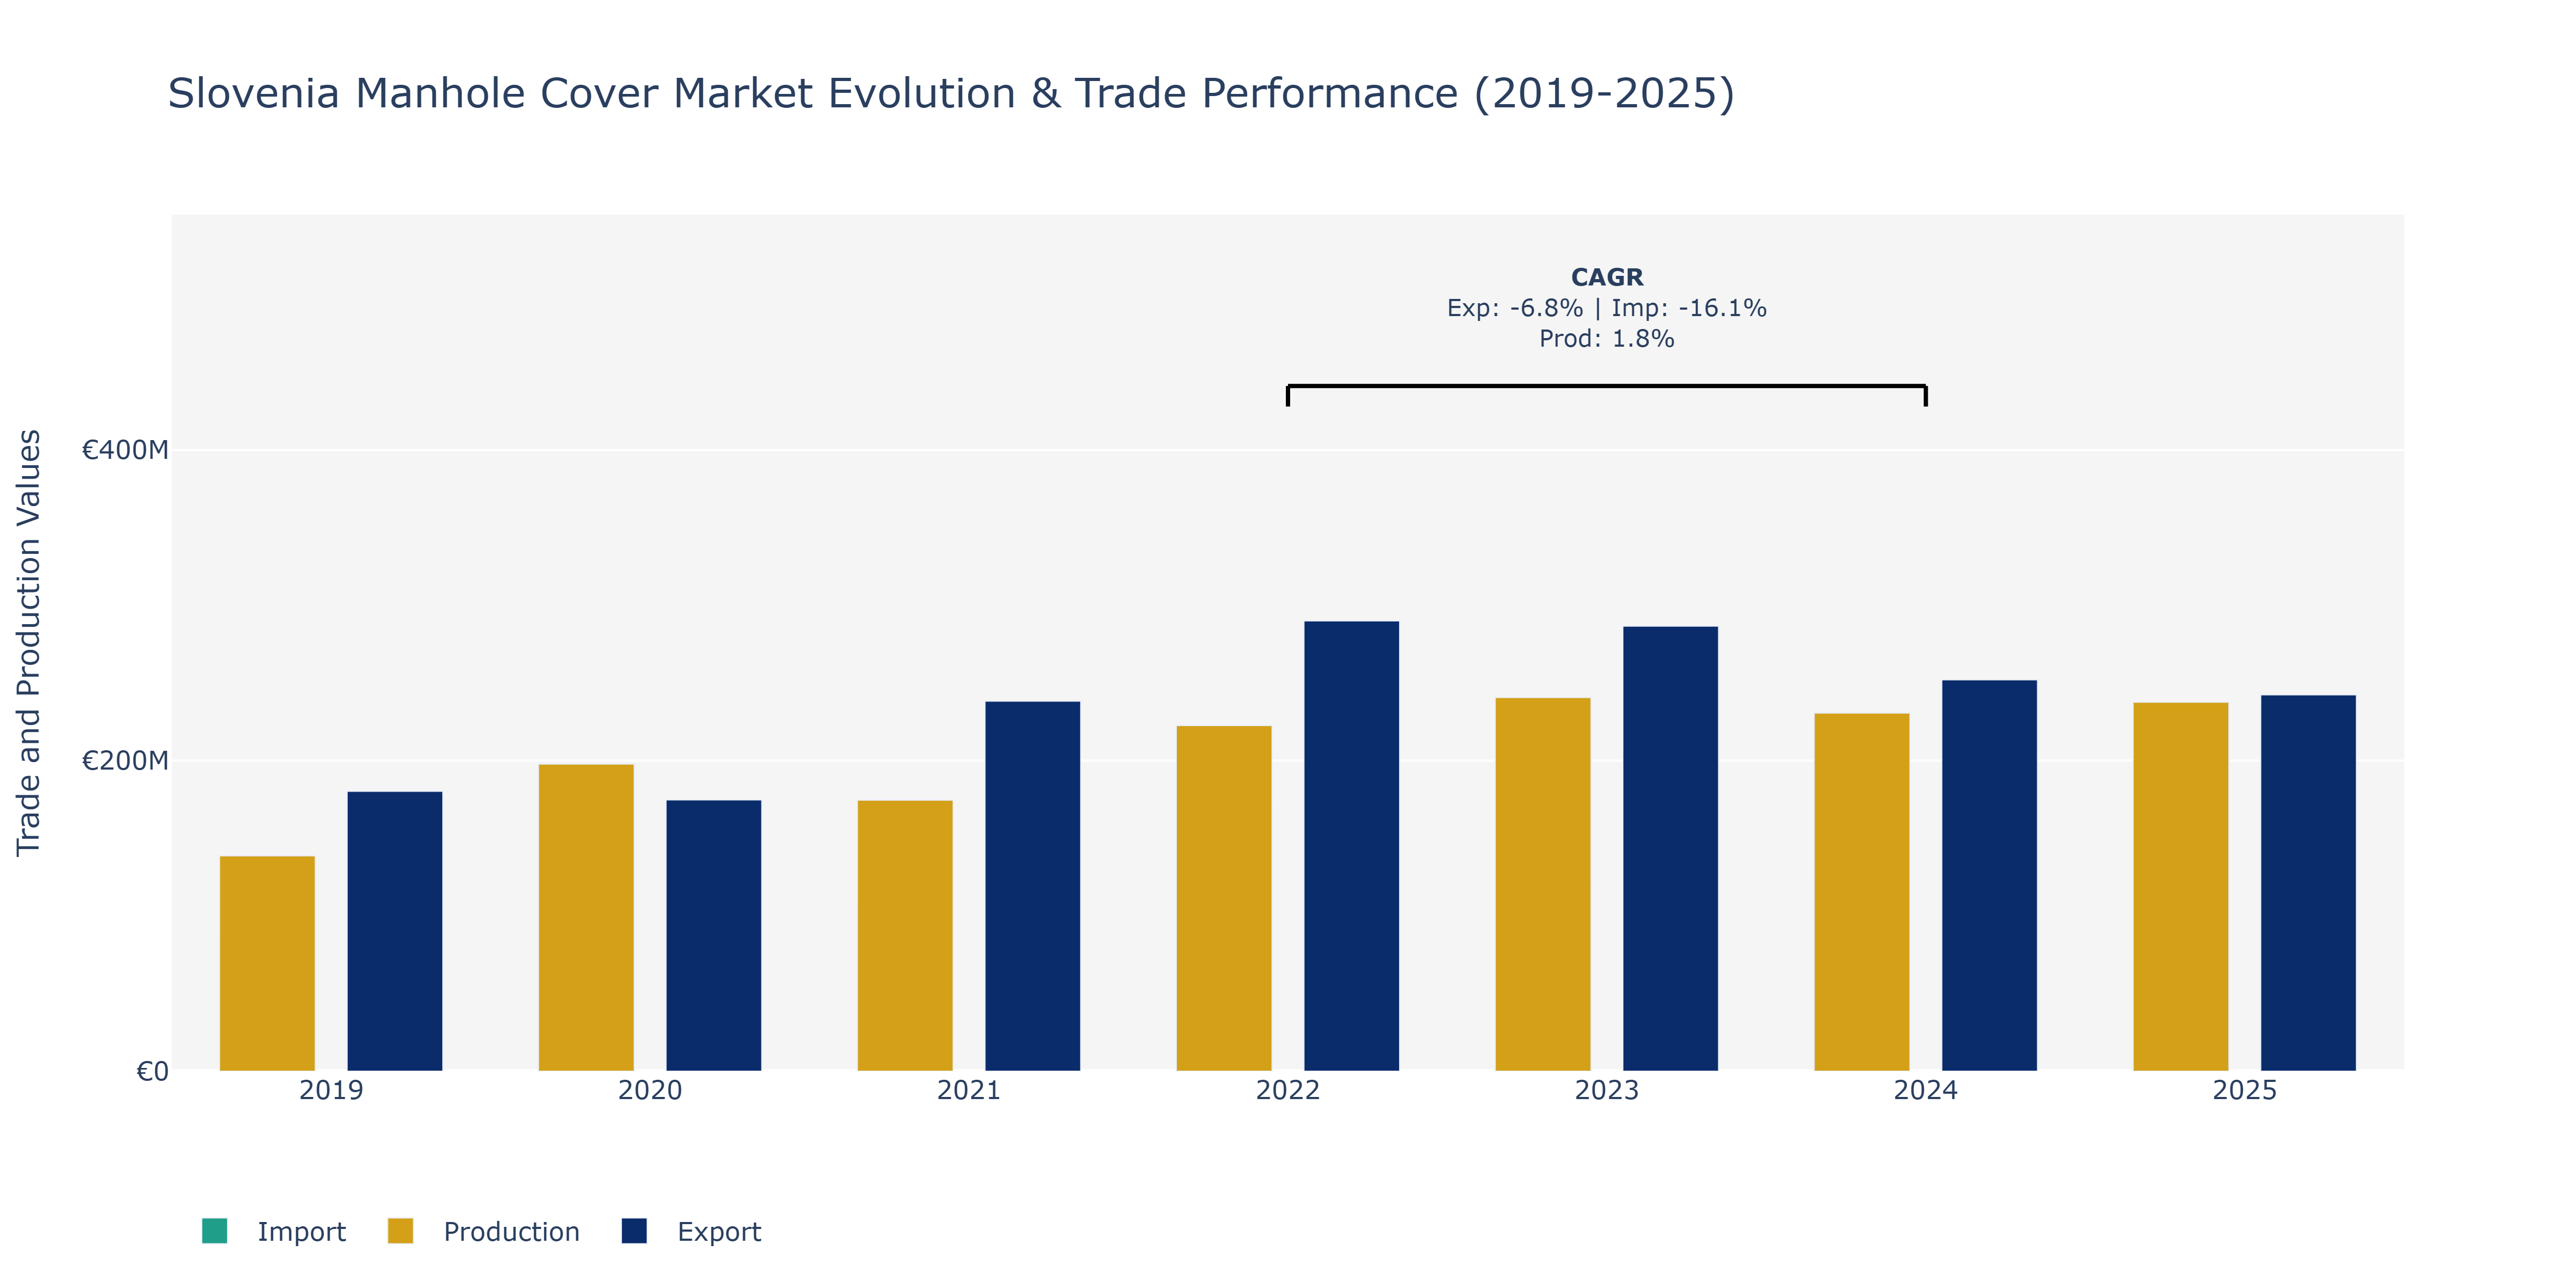
In the Slovenia Manhole Cover Market, exports experienced a moderate decline from €180.2 million in 2019 to €174.74 million in 2020, followed by a substantial increase to €238.32 million in 2021. This growth trend continued in 2022 and 2023, with exports peaking at €290.02 million before slightly decreasing to €286.57 million in 2023. In 2024 and 2025, exports stabilized around €252.04 million and €242.36 million, respectively. Imports started at €86.11 million in 2019, showed a downward trend until 2020, then increased to €109.74 million in 2021. However, from 2022 to 2025, imports fluctuated around €106.96 million to €171.47 million. Production values rose from €138.7 million in 2019 to €197.75 million in 2020, with a peak of €240.68 million in 2023. The slight decline in production to €237.61 million in 2025 may be attributed to advancing production technologies and increasing demand for manhole covers in infrastructure projects across Slovenia.
Key Highlights of the Report:
- Slovenia Manhole Cover Market Outlook
- Market Size of Slovenia Manhole Cover Market, 2025
- Forecast of Slovenia Manhole Cover Market, 2032
- Historical Data and Forecast of Slovenia Manhole Cover Revenues & Volume for the Period 2022-2032F
- Slovenia Manhole Cover Market Trend Evolution
- Slovenia Manhole Cover Market Drivers and Challenges
- Slovenia Manhole Cover Price Trends
- Slovenia Manhole Cover Porter's Five Forces
- Slovenia Manhole Cover Industry Life Cycle
- Historical Data and Forecast of Slovenia Manhole Cover Market Revenues & Volume By Type for the Period 2022-2032F
- Historical Data and Forecast of Slovenia Manhole Cover Market Revenues & Volume By Cast Iron Cover for the Period 2022-2032F
- Historical Data and Forecast of Slovenia Manhole Cover Market Revenues & Volume By Composite Cover for the Period 2022-2032F
- Historical Data and Forecast of Slovenia Manhole Cover Market Revenues & Volume By Concrete Cover for the Period 2022-2032F
- Historical Data and Forecast of Slovenia Manhole Cover Market Revenues & Volume By Application for the Period 2022-2032F
- Historical Data and Forecast of Slovenia Manhole Cover Market Revenues & Volume By Drainage Systems for the Period 2022-2032F
- Historical Data and Forecast of Slovenia Manhole Cover Market Revenues & Volume By Utility Access for the Period 2022-2032F
- Historical Data and Forecast of Slovenia Manhole Cover Market Revenues & Volume By Sewer Systems for the Period 2022-2032F
- Historical Data and Forecast of Slovenia Manhole Cover Market Revenues & Volume By End User for the Period 2022-2032F
- Historical Data and Forecast of Slovenia Manhole Cover Market Revenues & Volume By Municipal Corporations for the Period 2022-2032F
- Historical Data and Forecast of Slovenia Manhole Cover Market Revenues & Volume By Construction Industry for the Period 2022-2032F
- Historical Data and Forecast of Slovenia Manhole Cover Market Revenues & Volume By Infrastructure Projects for the Period 2022-2032F
- Historical Data and Forecast of Slovenia Manhole Cover Market Revenues & Volume By Distribution Channel for the Period 2022-2032F
- Historical Data and Forecast of Slovenia Manhole Cover Market Revenues & Volume By Direct Sales for the Period 2022-2032F
- Historical Data and Forecast of Slovenia Manhole Cover Market Revenues & Volume By Wholesale Suppliers for the Period 2022-2032F
- Historical Data and Forecast of Slovenia Manhole Cover Market Revenues & Volume By Online Sales for the Period 2022-2032F
- Slovenia Manhole Cover Import Export Trade Statistics
- Market Opportunity Assessment By Type
- Market Opportunity Assessment By Application
- Market Opportunity Assessment By End User
- Market Opportunity Assessment By Distribution Channel
- Slovenia Manhole Cover Top Companies Market Share
- Slovenia Manhole Cover Competitive Benchmarking By Technical and Operational Parameters
- Slovenia Manhole Cover Company Profiles
- Slovenia Manhole Cover Key Strategic Recommendations
Frequently Asked Questions About the Market Study (FAQs):
6Wresearch actively monitors the Slovenia Manhole Cover Market and publishes its comprehensive annual report, highlighting emerging trends, growth drivers, revenue analysis, and forecast outlook. Our insights help businesses to make data-backed strategic decisions with ongoing market dynamics. Our analysts track relevent industries related to the Slovenia Manhole Cover Market, allowing our clients with actionable intelligence and reliable forecasts tailored to emerging regional needs.
Yes, we provide customisation as per your requirements. To learn more, feel free to contact us on sales@6wresearch.com
1 Executive Summary |
2 Introduction |
2.1 Key Highlights of the Report |
2.2 Report Description |
2.3 Market Scope & Segmentation |
2.4 Research Methodology |
2.5 Assumptions |
3 Slovenia Manhole Cover Market Overview |
3.1 Slovenia Country Macro Economic Indicators |
3.2 Slovenia Manhole Cover Market Revenues & Volume, 2022 & 2032F |
3.3 Slovenia Manhole Cover Market - Industry Life Cycle |
3.4 Slovenia Manhole Cover Market - Porter's Five Forces |
3.5 Slovenia Manhole Cover Market Revenues & Volume Share, By Type, 2022 & 2032F |
3.6 Slovenia Manhole Cover Market Revenues & Volume Share, By Application, 2022 & 2032F |
3.7 Slovenia Manhole Cover Market Revenues & Volume Share, By End User, 2022 & 2032F |
3.8 Slovenia Manhole Cover Market Revenues & Volume Share, By Distribution Channel, 2022 & 2032F |
4 Slovenia Manhole Cover Market Dynamics |
4.1 Impact Analysis |
4.2 Market Drivers |
4.2.1 Increasing urbanization and infrastructure development in Slovenia |
4.2.2 Growing focus on wastewater management and environmental protection |
4.2.3 Government initiatives for improving public utilities and infrastructure |
4.3 Market Restraints |
4.3.1 Limited budget allocation for infrastructure projects |
4.3.2 Competition from alternative technologies like composite covers |
4.3.3 Potential impact of economic downturn on construction activities |
5 Slovenia Manhole Cover Market Trends |
6 Slovenia Manhole Cover Market, By Types |
6.1 Slovenia Manhole Cover Market, By Type |
6.1.1 Overview and Analysis |
6.1.2 Slovenia Manhole Cover Market Revenues & Volume, By Type, 2022 - 2032F |
6.1.3 Slovenia Manhole Cover Market Revenues & Volume, By Cast Iron Cover, 2022 - 2032F |
6.1.4 Slovenia Manhole Cover Market Revenues & Volume, By Composite Cover, 2022 - 2032F |
6.1.5 Slovenia Manhole Cover Market Revenues & Volume, By Concrete Cover, 2022 - 2032F |
6.2 Slovenia Manhole Cover Market, By Application |
6.2.1 Overview and Analysis |
6.2.2 Slovenia Manhole Cover Market Revenues & Volume, By Drainage Systems, 2022 - 2032F |
6.2.3 Slovenia Manhole Cover Market Revenues & Volume, By Utility Access, 2022 - 2032F |
6.2.4 Slovenia Manhole Cover Market Revenues & Volume, By Sewer Systems, 2022 - 2032F |
6.3 Slovenia Manhole Cover Market, By End User |
6.3.1 Overview and Analysis |
6.3.2 Slovenia Manhole Cover Market Revenues & Volume, By Municipal Corporations, 2022 - 2032F |
6.3.3 Slovenia Manhole Cover Market Revenues & Volume, By Construction Industry, 2022 - 2032F |
6.3.4 Slovenia Manhole Cover Market Revenues & Volume, By Infrastructure Projects, 2022 - 2032F |
6.4 Slovenia Manhole Cover Market, By Distribution Channel |
6.4.1 Overview and Analysis |
6.4.2 Slovenia Manhole Cover Market Revenues & Volume, By Direct Sales, 2022 - 2032F |
6.4.3 Slovenia Manhole Cover Market Revenues & Volume, By Wholesale Suppliers, 2022 - 2032F |
6.4.4 Slovenia Manhole Cover Market Revenues & Volume, By Online Sales, 2022 - 2032F |
7 Slovenia Manhole Cover Market Import-Export Trade Statistics |
7.1 Slovenia Manhole Cover Market Export to Major Countries |
7.2 Slovenia Manhole Cover Market Imports from Major Countries |
8 Slovenia Manhole Cover Market Key Performance Indicators |
8.1 Number of infrastructure projects initiated in Slovenia |
8.2 Percentage of municipal budgets allocated to infrastructure maintenance |
8.3 Compliance rate with environmental regulations for manhole covers |
9 Slovenia Manhole Cover Market - Opportunity Assessment |
9.1 Slovenia Manhole Cover Market Opportunity Assessment, By Type, 2022 & 2032F |
9.2 Slovenia Manhole Cover Market Opportunity Assessment, By Application, 2022 & 2032F |
9.3 Slovenia Manhole Cover Market Opportunity Assessment, By End User, 2022 & 2032F |
9.4 Slovenia Manhole Cover Market Opportunity Assessment, By Distribution Channel, 2022 & 2032F |
10 Slovenia Manhole Cover Market - Competitive Landscape |
10.1 Slovenia Manhole Cover Market Revenue Share, By Companies, 2025 |
10.2 Slovenia Manhole Cover Market Competitive Benchmarking, By Operating and Technical Parameters |
11 Company Profiles |
12 Recommendations |
13 Disclaimer |
Export potential assessment - trade Analytics for 2030
Export potential enables firms to identify high-growth global markets with greater confidence by combining advanced trade intelligence with a structured quantitative methodology. The framework analyzes emerging demand trends and country-level import patterns while integrating macroeconomic and trade datasets such as GDP and population forecasts, bilateral import–export flows, tariff structures, elasticity differentials between developed and developing economies, geographic distance, and import demand projections. Using weighted trade values from 2020–2024 as the base period to project country-to-country export potential for 2030, these inputs are operationalized through calculated drivers such as gravity model parameters, tariff impact factors, and projected GDP per-capita growth. Through an analysis of hidden potentials, demand hotspots, and market conditions that are most favorable to success, this method enables firms to focus on target countries, maximize returns, and global expansion with data, backed by accuracy.
By factoring in the projected importer demand gap that is currently unmet and could be potential opportunity, it identifies the potential for the Exporter (Country) among 190 countries, against the general trade analysis, which identifies the biggest importer or exporter.
To discover high-growth global markets and optimize your business strategy:
Click Here
Pricing
- Single User License$ 1,995
- Department License$ 2,400
- Site License$ 3,120
- Global License$ 3,795

Search
Thought Leadership and Analyst Meet


Our Clients
Latest Reports
- Canada Cloud CFD Market (2026-2032) | Size & Revenue, Industry, Growth, Competitive Landscape, Forecast, Segmentation, Value, Outlook, Trends, Share, Analysis, Companies
- Taiwan Food Delivery Platform Market (2026-2032) | Companies, Outlook, Analysis, Trends, Value, Revenue, Segmentation, Share, Forecast, Competitive Landscape, Growth, Size & Forecast
- United Kingdom (UK) Long-term Care Insurance Market (2026-2032) | Growth, Share, Consumer Insights, Drivers, Opportunities, Competition, Pricing Analysis, Segments, Restraints, Companies, Competitive, Value, Outlook, Size, Demand, Analysis, Challenges, Strategic Insights, Investment Trends, Revenue, Trends, Supply, Forecast
- United Kingdom (UK) Long Term Care Market (2026-2032) | Companies, Outlook, Analysis, Trends, Value, Revenue, Segmentation, Share, Forecast, Competitive Landscape, Growth, Size & Forecast
- Iraq Insulation and Waterproofing Market (2026-2032) | Outlook, Drivers, Growth, Size, Share, Industry, Revenue, Trends, Demand, Competitive, Strategic Insights, Opportunities, Segments, Companies, Challenges, Strategy, Consumer Insights, Analysis, Investment Trends, Value, Segmentation, Forecast, Restraints
- India Switchgear Market Outlook (2026-2032) | Size, Share, Trends, Growth, Revenue, Forecast, Analysis, Value, Outlook
- Pakistan Contraceptive Implants Market (2025-2031) | Demand, Growth, Size, Share, Industry, Pricing Analysis, Competitive, Strategic Insights, Strategy, Consumer Insights, Analysis, Investment Trends, Opportunities, Revenue, Segments, Value, Segmentation, Supply, Forecast, Restraints, Outlook, Competition, Drivers, Trends, Companies, Challenges
- Sri Lanka Packaging Market (2026-2032) | Outlook, Competition, Drivers, Trends, Demand, Pricing Analysis, Competitive, Strategic Insights, Companies, Challenges, Strategy, Consumer Insights, Analysis, Investment Trends, Opportunities, Growth, Size, Share, Industry, Revenue, Segments, Value, Segmentation, Supply, Forecast, Restraints
- India Kids Watches Market (2026-2032) | Strategy, Consumer Insights, Analysis, Investment Trends, Opportunities, Growth, Size, Share, Industry, Revenue, Segments, Value, Segmentation, Supply, Forecast, Restraints, Outlook, Competition, Drivers, Trends, Demand, Pricing Analysis, Competitive, Strategic Insights, Companies, Challenges
- Saudi Arabia Core Assurance Service Market (2025-2031) | Strategy, Consumer Insights, Analysis, Investment Trends, Opportunities, Growth, Size, Share, Industry, Revenue, Segments, Value, Segmentation, Supply, Forecast, Restraints, Outlook, Competition, Drivers, Trends, Demand, Pricing Analysis, Competitive, Strategic Insights, Companies, Challenges
Industry Events and Analyst Meet

India EV Show 2026

EV tech India Expo 2026

Auto Tech Asia 2026

Battery Tech India 2026

Smart Production Solutions Guangzhou 2026
Whitepaper
- Middle East & Africa Commercial Security Market Click here to view more.
- Middle East & Africa Fire Safety Systems & Equipment Market Click here to view more.
- GCC Drone Market Click here to view more.
- Middle East Lighting Fixture Market Click here to view more.
- GCC Physical & Perimeter Security Market Click here to view more.
6WResearch In News
- Doha a strategic location for EV manufacturing hub: IPA Qatar
- Demand for luxury TVs surging in the GCC, says Samsung
- Empowering Growth: The Thriving Journey of Bangladesh’s Cable Industry
- Demand for luxury TVs surging in the GCC, says Samsung
- Video call with a traditional healer? Once unthinkable, it’s now common in South Africa
- Intelligent Buildings To Smooth GCC’s Path To Net Zero