Slovenia Methacrylic Acid Market (2026-2032) | Value, Segmentation, Revenue, Analysis, Forecast, Size, Industry, Companies, Outlook, Trends, Share & Growth
Market Forecast By Application (Paint and Adhesives, Fiber Processing Agent, Rubber Modifier, Leather Treatment, Paper Processing Agent, Lubricant Additive, Cement Mixing Agent, Others), By End-users (Paints and Coatings, Textile, Leather, Paper Manufacture, Construction, Automobiles, Electronics, Others), By Type (Liquid Products, Glacial Products) And Competitive Landscape
| Product Code: ETC4791559 | Publication Date: Nov 2023 | Updated Date: Apr 2026 | Product Type: Market Research Report | |
| Publisher: 6Wresearch | Author: Shubham Padhi | No. of Pages: 60 | No. of Figures: 30 | No. of Tables: 5 |
Slovenia Methacrylic Acid Market Size (2020-2030)
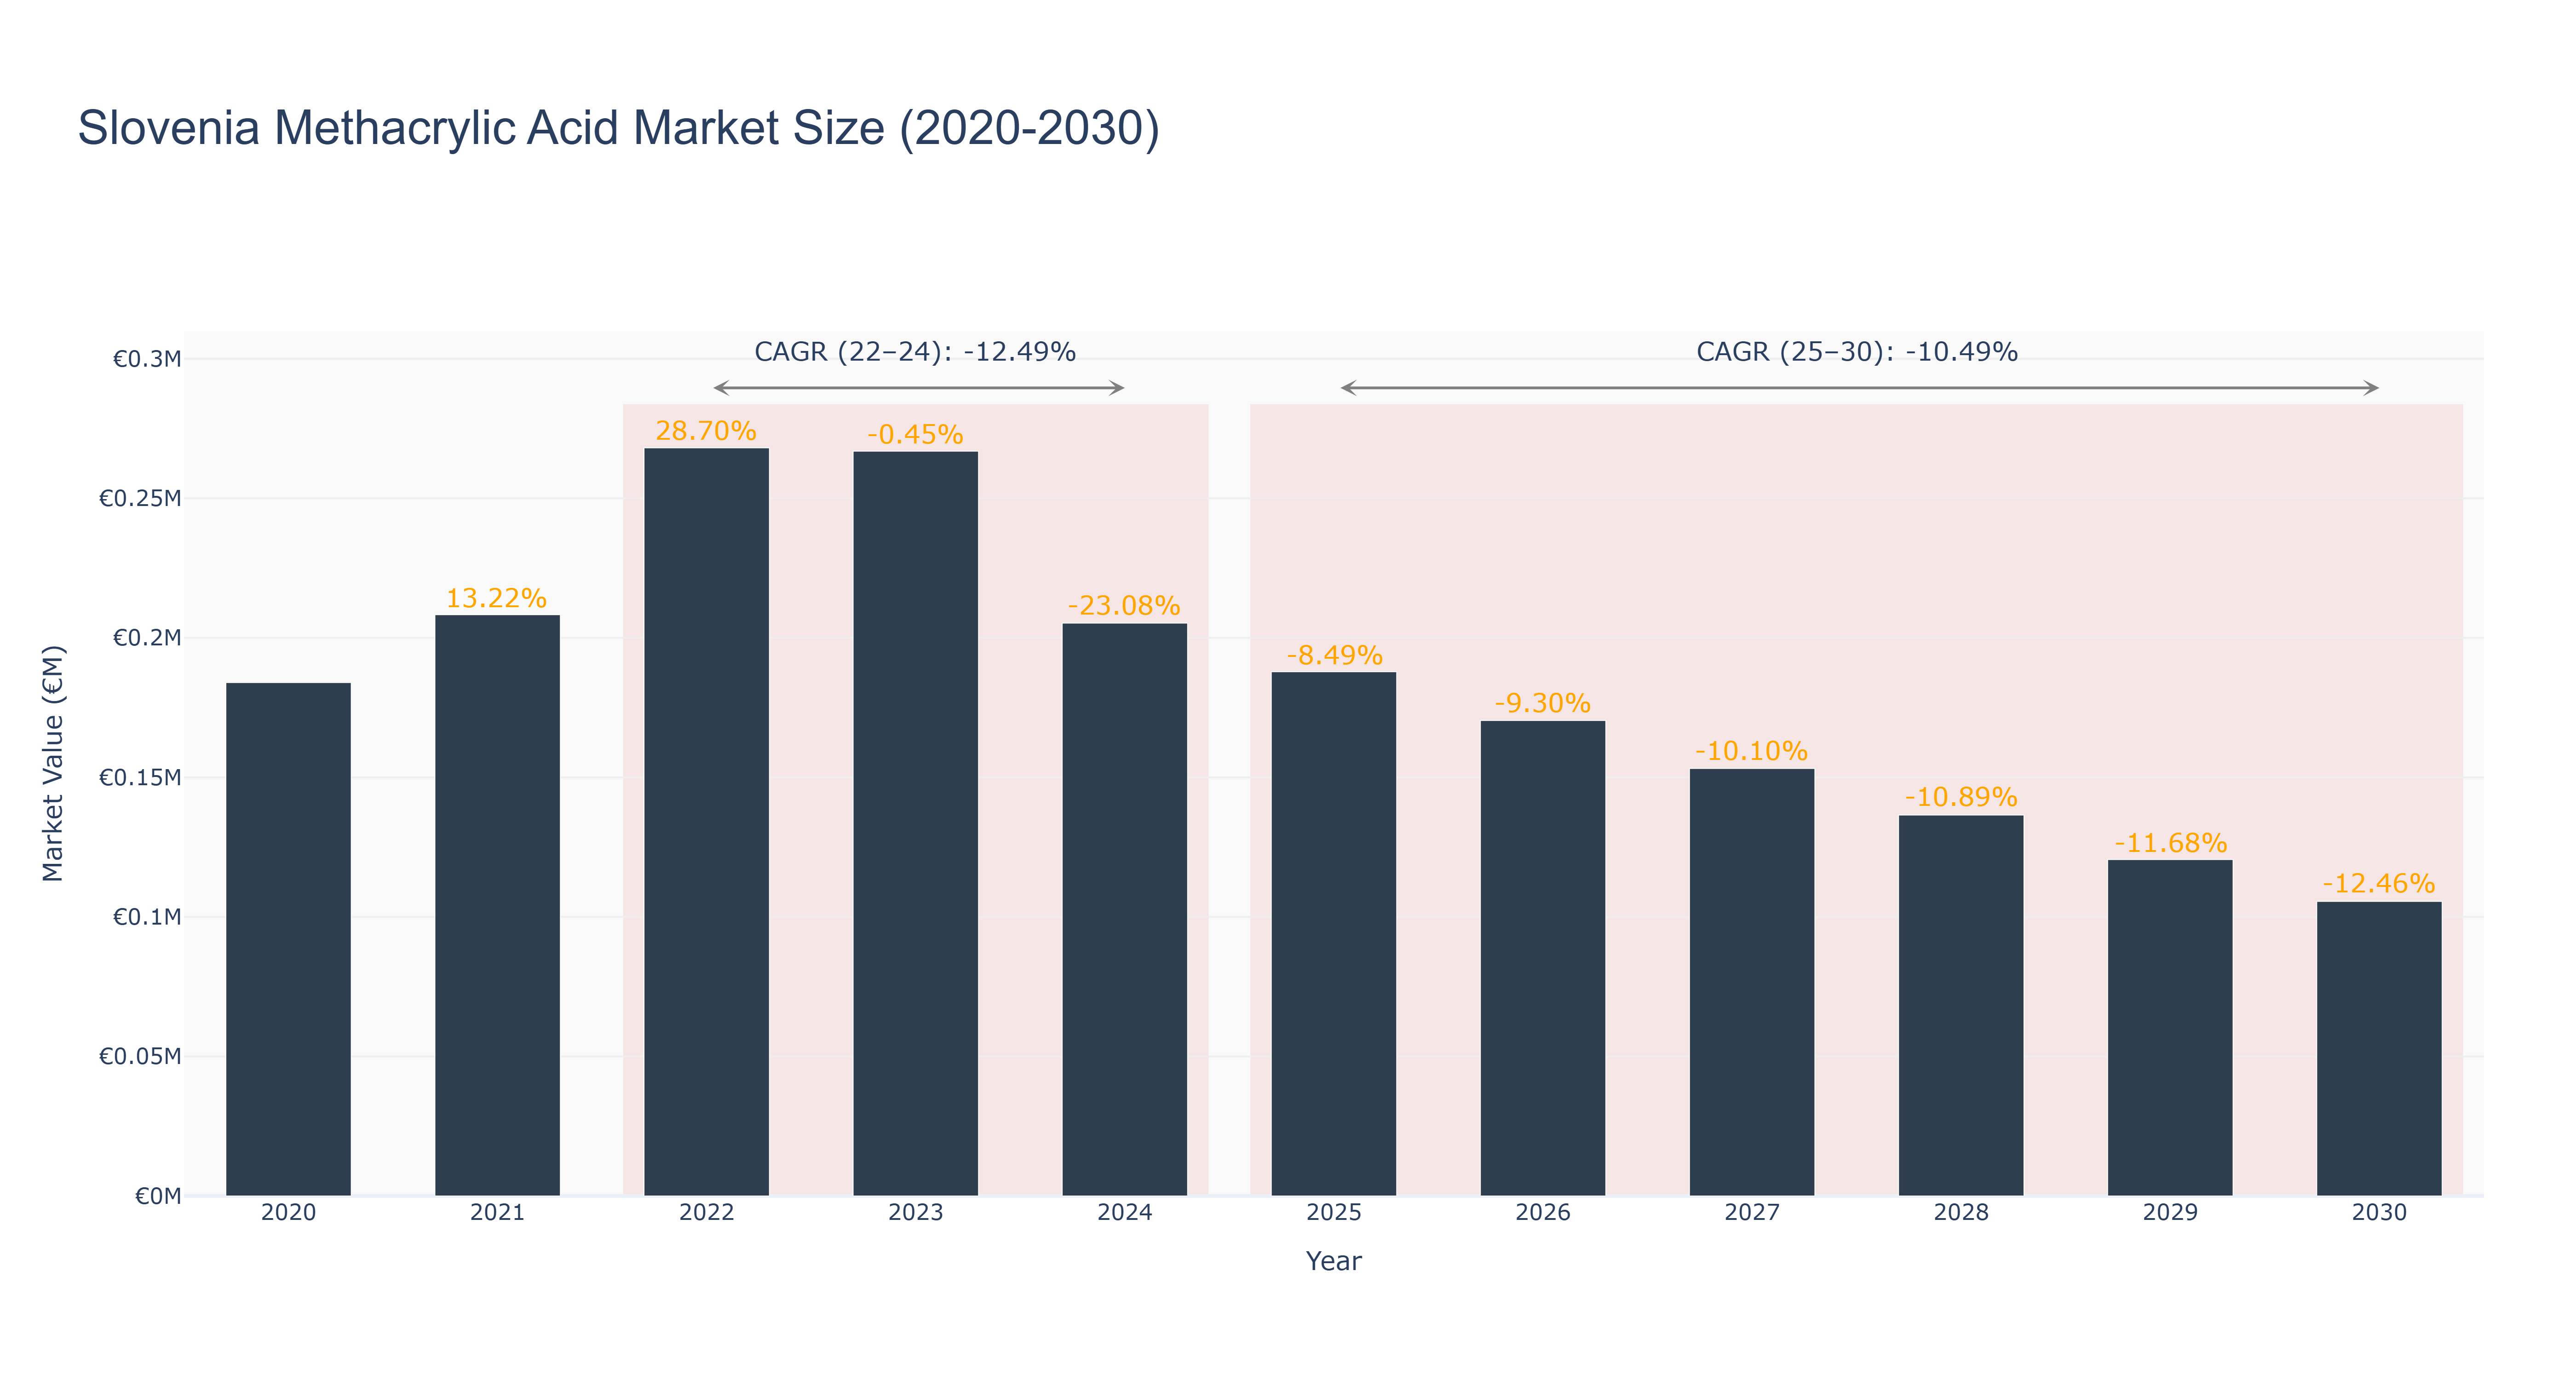
Slovenia's Methacrylic Acid Market has witnessed a fluctuating trend over the past decade. The peak market size was €0.27 million in 2022, followed by a decline to €0.11 million in 2030. From 2020 to 2024, the market experienced a significant decrease in size, attributed to a negative compound annual growth rate (CAGR) of -12.49% between 2022-24. The forecasted period from 2025 to 2030 shows a more moderate decline with a CAGR of -10.49%. The market's downturn can be linked to global economic challenges impacting demand for methacrylic acid-based products. Looking ahead, Slovenia is set to invest in sustainable production processes for methacrylic acid, aligning with the country's green initiatives and fostering growth opportunities in the chemical industry.
Slovenia Methacrylic Acid Market: Production & Trade Performance (2019-2025)
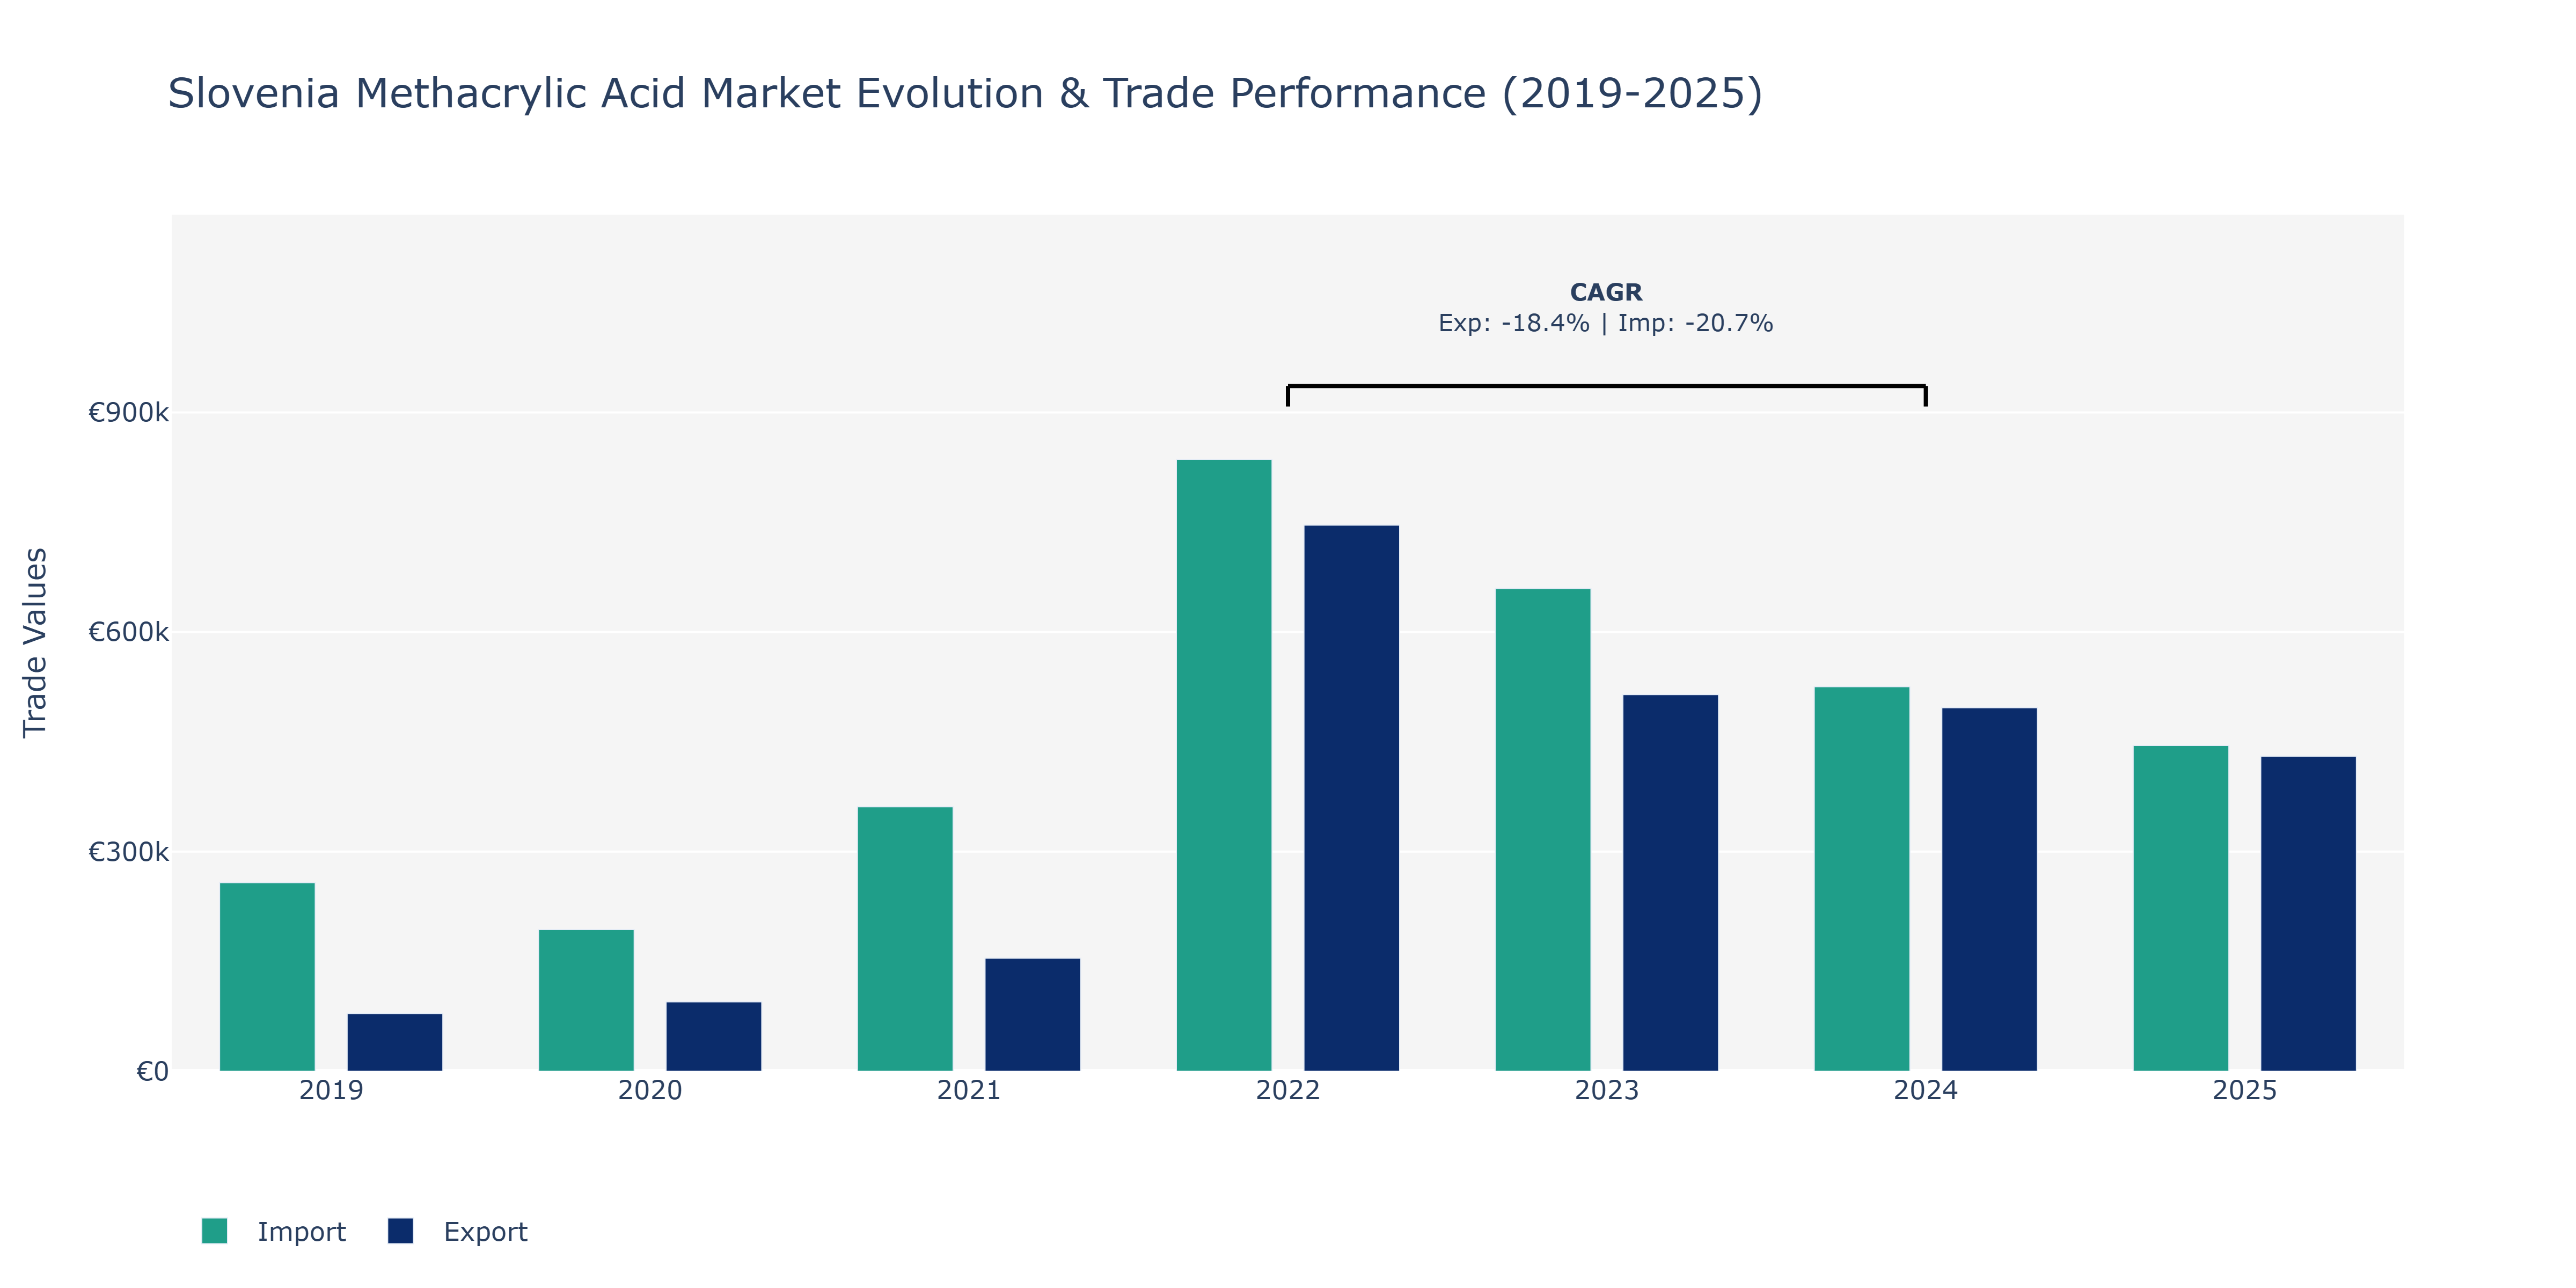
Between 2019 and 2025, Slovenia's Methacrylic Acid Market witnessed varying trends in exports and imports. Exports peaked in 2022 at approximately €745.99 thousand, only to drop to around €430.33 thousand in 2025. This decline was influenced by factors like fluctuating global demand for methacrylic acid and intensified competition in the market. On the other hand, imports followed a similar pattern, reaching their peak in 2022 at around €835.87 thousand and then decreasing to about €445.15 thousand in 2025. This decrease could be attributed to shifts in supply chains, changes in trade policies, and the impact of external economic factors on Slovenia's import activities. The market's fluctuations highlight the need for industry players to adapt to changing market dynamics and enhance their competitive strategies to navigate through uncertainties in the global trade environment.
Key Highlights of the Report:
- Slovenia Methacrylic Acid Market Outlook
- Market Size of Slovenia Methacrylic Acid Market, 2025
- Forecast of Slovenia Methacrylic Acid Market, 2032
- Historical Data and Forecast of Slovenia Methacrylic Acid Revenues & Volume for the Period 2022-2032F
- Slovenia Methacrylic Acid Market Trend Evolution
- Slovenia Methacrylic Acid Market Drivers and Challenges
- Slovenia Methacrylic Acid Price Trends
- Slovenia Methacrylic Acid Porter`s Five Forces
- Slovenia Methacrylic Acid Industry Life Cycle
- Historical Data and Forecast of Slovenia Methacrylic Acid Market Revenues & Volume By Application for the Period 2022-2032F
- Historical Data and Forecast of Slovenia Methacrylic Acid Market Revenues & Volume By Paint and Adhesives for the Period 2022-2032F
- Historical Data and Forecast of Slovenia Methacrylic Acid Market Revenues & Volume By Fiber Processing Agent for the Period 2022-2032F
- Historical Data and Forecast of Slovenia Methacrylic Acid Market Revenues & Volume By Rubber Modifier for the Period 2022-2032F
- Historical Data and Forecast of Slovenia Methacrylic Acid Market Revenues & Volume By Leather Treatment for the Period 2022-2032F
- Historical Data and Forecast of Slovenia Methacrylic Acid Market Revenues & Volume By Paper Processing Agent for the Period 2022-2032F
- Historical Data and Forecast of Slovenia Methacrylic Acid Market Revenues & Volume By Lubricant Additive for the Period 2022-2032F
- Historical Data and Forecast of Slovenia Methacrylic Acid Market Revenues & Volume By Cement Mixing Agent for the Period 2022-2032F
- Historical Data and Forecast of Slovenia Paint and Adhesives Methacrylic Acid Market Revenues & Volume By Others for the Period 2022-2032F
- Historical Data and Forecast of Slovenia Methacrylic Acid Market Revenues & Volume By End-users for the Period 2022-2032F
- Historical Data and Forecast of Slovenia Methacrylic Acid Market Revenues & Volume By Paints and Coatings for the Period 2022-2032F
- Historical Data and Forecast of Slovenia Methacrylic Acid Market Revenues & Volume By Textile for the Period 2022-2032F
- Historical Data and Forecast of Slovenia Methacrylic Acid Market Revenues & Volume By Leather for the Period 2022-2032F
- Historical Data and Forecast of Slovenia Methacrylic Acid Market Revenues & Volume By Paper Manufacture for the Period 2022-2032F
- Historical Data and Forecast of Slovenia Methacrylic Acid Market Revenues & Volume By Construction for the Period 2022-2032F
- Historical Data and Forecast of Slovenia Methacrylic Acid Market Revenues & Volume By Automobiles for the Period 2022-2032F
- Historical Data and Forecast of Slovenia Methacrylic Acid Market Revenues & Volume By Electronics for the Period 2022-2032F
- Historical Data and Forecast of Slovenia Methacrylic Acid Market Revenues & Volume By Others for the Period 2022-2032F
- Historical Data and Forecast of Slovenia Methacrylic Acid Market Revenues & Volume By Type for the Period 2022-2032F
- Historical Data and Forecast of Slovenia Methacrylic Acid Market Revenues & Volume By Liquid Products for the Period 2022-2032F
- Historical Data and Forecast of Slovenia Methacrylic Acid Market Revenues & Volume By Glacial Products for the Period 2022-2032F
- Slovenia Methacrylic Acid Import Export Trade Statistics
- Market Opportunity Assessment By Application
- Market Opportunity Assessment By End-users
- Market Opportunity Assessment By Type
- Slovenia Methacrylic Acid Top Companies Market Share
- Slovenia Methacrylic Acid Competitive Benchmarking By Technical and Operational Parameters
- Slovenia Methacrylic Acid Company Profiles
- Slovenia Methacrylic Acid Key Strategic Recommendations
Frequently Asked Questions About the Market Study (FAQs):
6Wresearch actively monitors the Slovenia Methacrylic Acid Market and publishes its comprehensive annual report, highlighting emerging trends, growth drivers, revenue analysis, and forecast outlook. Our insights help businesses to make data-backed strategic decisions with ongoing market dynamics. Our analysts track relevent industries related to the Slovenia Methacrylic Acid Market, allowing our clients with actionable intelligence and reliable forecasts tailored to emerging regional needs.
Yes, we provide customisation as per your requirements. To learn more, feel free to contact us on sales@6wresearch.com
1 Executive Summary |
2 Introduction |
2.1 Key Highlights of the Report |
2.2 Report Description |
2.3 Market Scope & Segmentation |
2.4 Research Methodology |
2.5 Assumptions |
3 Slovenia Methacrylic Acid Market Overview |
3.1 Slovenia Country Macro Economic Indicators |
3.2 Slovenia Methacrylic Acid Market Revenues & Volume, 2022 & 2032F |
3.3 Slovenia Methacrylic Acid Market - Industry Life Cycle |
3.4 Slovenia Methacrylic Acid Market - Porter's Five Forces |
3.5 Slovenia Methacrylic Acid Market Revenues & Volume Share, By Application, 2022 & 2032F |
3.6 Slovenia Methacrylic Acid Market Revenues & Volume Share, By End-users, 2022 & 2032F |
3.7 Slovenia Methacrylic Acid Market Revenues & Volume Share, By Type, 2022 & 2032F |
4 Slovenia Methacrylic Acid Market Dynamics |
4.1 Impact Analysis |
4.2 Market Drivers |
4.2.1 Increasing demand for methacrylic acid in the automotive industry for manufacturing coatings, adhesives, and sealants |
4.2.2 Growth in the construction sector leading to higher consumption of methacrylic acid-based products |
4.2.3 Rising investments in research and development for the development of innovative methacrylic acid derivatives |
4.3 Market Restraints |
4.3.1 Fluctuating prices of raw materials such as methanol and acetone affecting the production cost of methacrylic acid |
4.3.2 Stringent environmental regulations related to the disposal and handling of methacrylic acid impacting market growth |
4.3.3 Competition from alternative materials like acrylic acid limiting market expansion |
5 Slovenia Methacrylic Acid Market Trends |
6 Slovenia Methacrylic Acid Market Segmentations |
6.1 Slovenia Methacrylic Acid Market, By Application |
6.1.1 Overview and Analysis |
6.1.2 Slovenia Methacrylic Acid Market Revenues & Volume, By Paint and Adhesives, 2022-2032F |
6.1.3 Slovenia Methacrylic Acid Market Revenues & Volume, By Fiber Processing Agent, 2022-2032F |
6.1.4 Slovenia Methacrylic Acid Market Revenues & Volume, By Rubber Modifier, 2022-2032F |
6.1.5 Slovenia Methacrylic Acid Market Revenues & Volume, By Leather Treatment, 2022-2032F |
6.1.6 Slovenia Methacrylic Acid Market Revenues & Volume, By Paper Processing Agent, 2022-2032F |
6.1.7 Slovenia Methacrylic Acid Market Revenues & Volume, By Lubricant Additive, 2022-2032F |
6.1.9 Slovenia Methacrylic Acid Market Revenues & Volume, By Others, 2022-2032F |
6.1.10 Slovenia Methacrylic Acid Market Revenues & Volume, By Others, 2022-2032F |
6.2 Slovenia Methacrylic Acid Market, By End-users |
6.2.1 Overview and Analysis |
6.2.2 Slovenia Methacrylic Acid Market Revenues & Volume, By Paints and Coatings, 2022-2032F |
6.2.3 Slovenia Methacrylic Acid Market Revenues & Volume, By Textile, 2022-2032F |
6.2.4 Slovenia Methacrylic Acid Market Revenues & Volume, By Leather, 2022-2032F |
6.2.5 Slovenia Methacrylic Acid Market Revenues & Volume, By Paper Manufacture, 2022-2032F |
6.2.6 Slovenia Methacrylic Acid Market Revenues & Volume, By Construction, 2022-2032F |
6.2.7 Slovenia Methacrylic Acid Market Revenues & Volume, By Automobiles, 2022-2032F |
6.2.8 Slovenia Methacrylic Acid Market Revenues & Volume, By Others, 2022-2032F |
6.2.9 Slovenia Methacrylic Acid Market Revenues & Volume, By Others, 2022-2032F |
6.3 Slovenia Methacrylic Acid Market, By Type |
6.3.1 Overview and Analysis |
6.3.2 Slovenia Methacrylic Acid Market Revenues & Volume, By Liquid Products, 2022-2032F |
6.3.3 Slovenia Methacrylic Acid Market Revenues & Volume, By Glacial Products, 2022-2032F |
7 Slovenia Methacrylic Acid Market Import-Export Trade Statistics |
7.1 Slovenia Methacrylic Acid Market Export to Major Countries |
7.2 Slovenia Methacrylic Acid Market Imports from Major Countries |
8 Slovenia Methacrylic Acid Market Key Performance Indicators |
8.1 Research and development expenditure focused on methacrylic acid derivatives |
8.2 Adoption rate of methacrylic acid-based products in key end-user industries |
8.3 Number of patents filed for new applications of methacrylic acid derivatives |
9 Slovenia Methacrylic Acid Market - Opportunity Assessment |
9.1 Slovenia Methacrylic Acid Market Opportunity Assessment, By Application, 2022 & 2032F |
9.2 Slovenia Methacrylic Acid Market Opportunity Assessment, By End-users, 2022 & 2032F |
9.3 Slovenia Methacrylic Acid Market Opportunity Assessment, By Type, 2022 & 2032F |
10 Slovenia Methacrylic Acid Market - Competitive Landscape |
10.1 Slovenia Methacrylic Acid Market Revenue Share, By Companies, 2025 |
10.2 Slovenia Methacrylic Acid Market Competitive Benchmarking, By Operating and Technical Parameters |
11 Company Profiles |
12 Recommendations | 13 Disclaimer |
Export potential assessment - trade Analytics for 2030
Export potential enables firms to identify high-growth global markets with greater confidence by combining advanced trade intelligence with a structured quantitative methodology. The framework analyzes emerging demand trends and country-level import patterns while integrating macroeconomic and trade datasets such as GDP and population forecasts, bilateral import–export flows, tariff structures, elasticity differentials between developed and developing economies, geographic distance, and import demand projections. Using weighted trade values from 2020–2024 as the base period to project country-to-country export potential for 2030, these inputs are operationalized through calculated drivers such as gravity model parameters, tariff impact factors, and projected GDP per-capita growth. Through an analysis of hidden potentials, demand hotspots, and market conditions that are most favorable to success, this method enables firms to focus on target countries, maximize returns, and global expansion with data, backed by accuracy.
By factoring in the projected importer demand gap that is currently unmet and could be potential opportunity, it identifies the potential for the Exporter (Country) among 190 countries, against the general trade analysis, which identifies the biggest importer or exporter.
To discover high-growth global markets and optimize your business strategy:
Click Here
Pricing
- Single User License$ 1,995
- Department License$ 2,400
- Site License$ 3,120
- Global License$ 3,795

Search
Thought Leadership and Analyst Meet


Our Clients
Latest Reports
- Philippines Polyhydroxybutyrate-co-Hydroxyvalerate Market (2026-2032) | Trends, Insights, Challenges, Restraints, Competition, Size, Value, Forecast, Pricing, Share, Outlook, Revenue, Investment Opportunities, Strategy, Drivers, Demand, Growth, segmentation, Analysis, Companies
- Peru Polyhydroxybutyrate-co-Hydroxyvalerate Market (2026-2032) | Growth, Demand, Challenges, Share, Trends, Analysis, Pricing, Investment Opportunities, Drivers, Value, Forecast, Competition, Size, Companies, Insights, Outlook, Restraints, segmentation, Revenue, Strategy
- Pakistan Polyhydroxybutyrate-co-Hydroxyvalerate Market (2026-2032) | Restraints, segmentation, Pricing, Forecast, Share, Strategy, Competition, Trends, Insights, Drivers, Challenges, Growth, Revenue, Outlook, Value, Investment Opportunities, Companies, Size, Analysis, Demand
- Oman Polyhydroxybutyrate-co-Hydroxyvalerate Market (2026-2032) | Drivers, segmentation, Insights, Competition, Pricing, Outlook, Size, Revenue, Challenges, Forecast, Analysis, Growth, Value, Share, Trends, Investment Opportunities, Strategy, Restraints, Companies, Demand
- Nigeria Polyhydroxybutyrate-co-Hydroxyvalerate Market (2026-2032) | Value, Investment Opportunities, Analysis, Revenue, Restraints, Pricing, Outlook, Competition, Demand, Growth, Forecast, Companies, Trends, Challenges, segmentation, Drivers, Insights, Share, Size, Strategy
- Nepal Polyhydroxybutyrate-co-Hydroxyvalerate Market (2026-2032) | Insights, Analysis, Drivers, Share, Revenue, Demand, segmentation, Investment Opportunities, Competition, Forecast, Growth, Pricing, Companies, Strategy, Trends, Restraints, Challenges, Outlook, Size, Value
- Myanmar Polyhydroxybutyrate-co-Hydroxyvalerate Market (2026-2032) | Outlook, Revenue, Strategy, Restraints, Drivers, segmentation, Share, Forecast, Competition, Insights, Growth, Pricing, Size, Demand, Value, Companies, Trends, Challenges, Investment Opportunities, Analysis
- Morocco Polyhydroxybutyrate-co-Hydroxyvalerate Market (2026-2032) | Outlook, Investment Opportunities, Restraints, Strategy, Forecast, Challenges, Drivers, Growth, Companies, segmentation, Trends, Size, Competition, Revenue, Demand, Insights, Share, Analysis, Value, Pricing
- Mexico Polyhydroxybutyrate-co-Hydroxyvalerate Market (2026-2032) | Size, Drivers, Outlook, Share, Strategy, Growth, Pricing, Challenges, Companies, Demand, Value, Investment Opportunities, Restraints, Trends, Forecast, segmentation, Analysis, Insights, Competition, Revenue
- Malaysia Polyhydroxybutyrate-co-Hydroxyvalerate Market (2026-2032) | Share, segmentation, Size, Companies, Analysis, Insights, Forecast, Value, Revenue, Drivers, Restraints, Challenges, Investment Opportunities, Trends, Competition, Strategy, Demand, Growth, Outlook, Pricing
Industry Events and Analyst Meet

HIMTEX 2026

India Refining Summit 2026

India EV Show 2026

EV tech India Expo 2026

Auto Tech Asia 2026
Whitepaper
- Middle East & Africa Commercial Security Market Click here to view more.
- Middle East & Africa Fire Safety Systems & Equipment Market Click here to view more.
- GCC Drone Market Click here to view more.
- Middle East Lighting Fixture Market Click here to view more.
- GCC Physical & Perimeter Security Market Click here to view more.
6WResearch In News
- Doha a strategic location for EV manufacturing hub: IPA Qatar
- Demand for luxury TVs surging in the GCC, says Samsung
- Empowering Growth: The Thriving Journey of Bangladesh’s Cable Industry
- Demand for luxury TVs surging in the GCC, says Samsung
- Video call with a traditional healer? Once unthinkable, it’s now common in South Africa
- Intelligent Buildings To Smooth GCC’s Path To Net Zero