Slovenia Motorcycle Drive Chain Market (2026-2032) | Competitive Landscape, Outlook, Analysis, Value, Companies, Trends, Industry, Size & Revenue, Growth, Segmentation, Forecast, Share
Market Forecast By Types (Standard, Cruiser, Sports, Off-Road), By Chain type (Standard Rolling Chain, O Ring Chain, X Ring Chain), By Engine Capacity (Up to 150 CC, 151-300 CC, 301-500 CC, Above 500 CC), By Material Type (Mild Steel, Cast Steel, Cast Iron), By Distribution Channel (Online, Offline) And Competitive Landscape
| Product Code: ETC9321966 | Publication Date: Sep 2024 | Updated Date: Apr 2026 | Product Type: Market Research Report | |
| Publisher: 6Wresearch | Author: Dhaval Chaurasia | No. of Pages: 75 | No. of Figures: 35 | No. of Tables: 20 |
Slovenia Motorcycle Drive Chain Market Size (2020-2030)
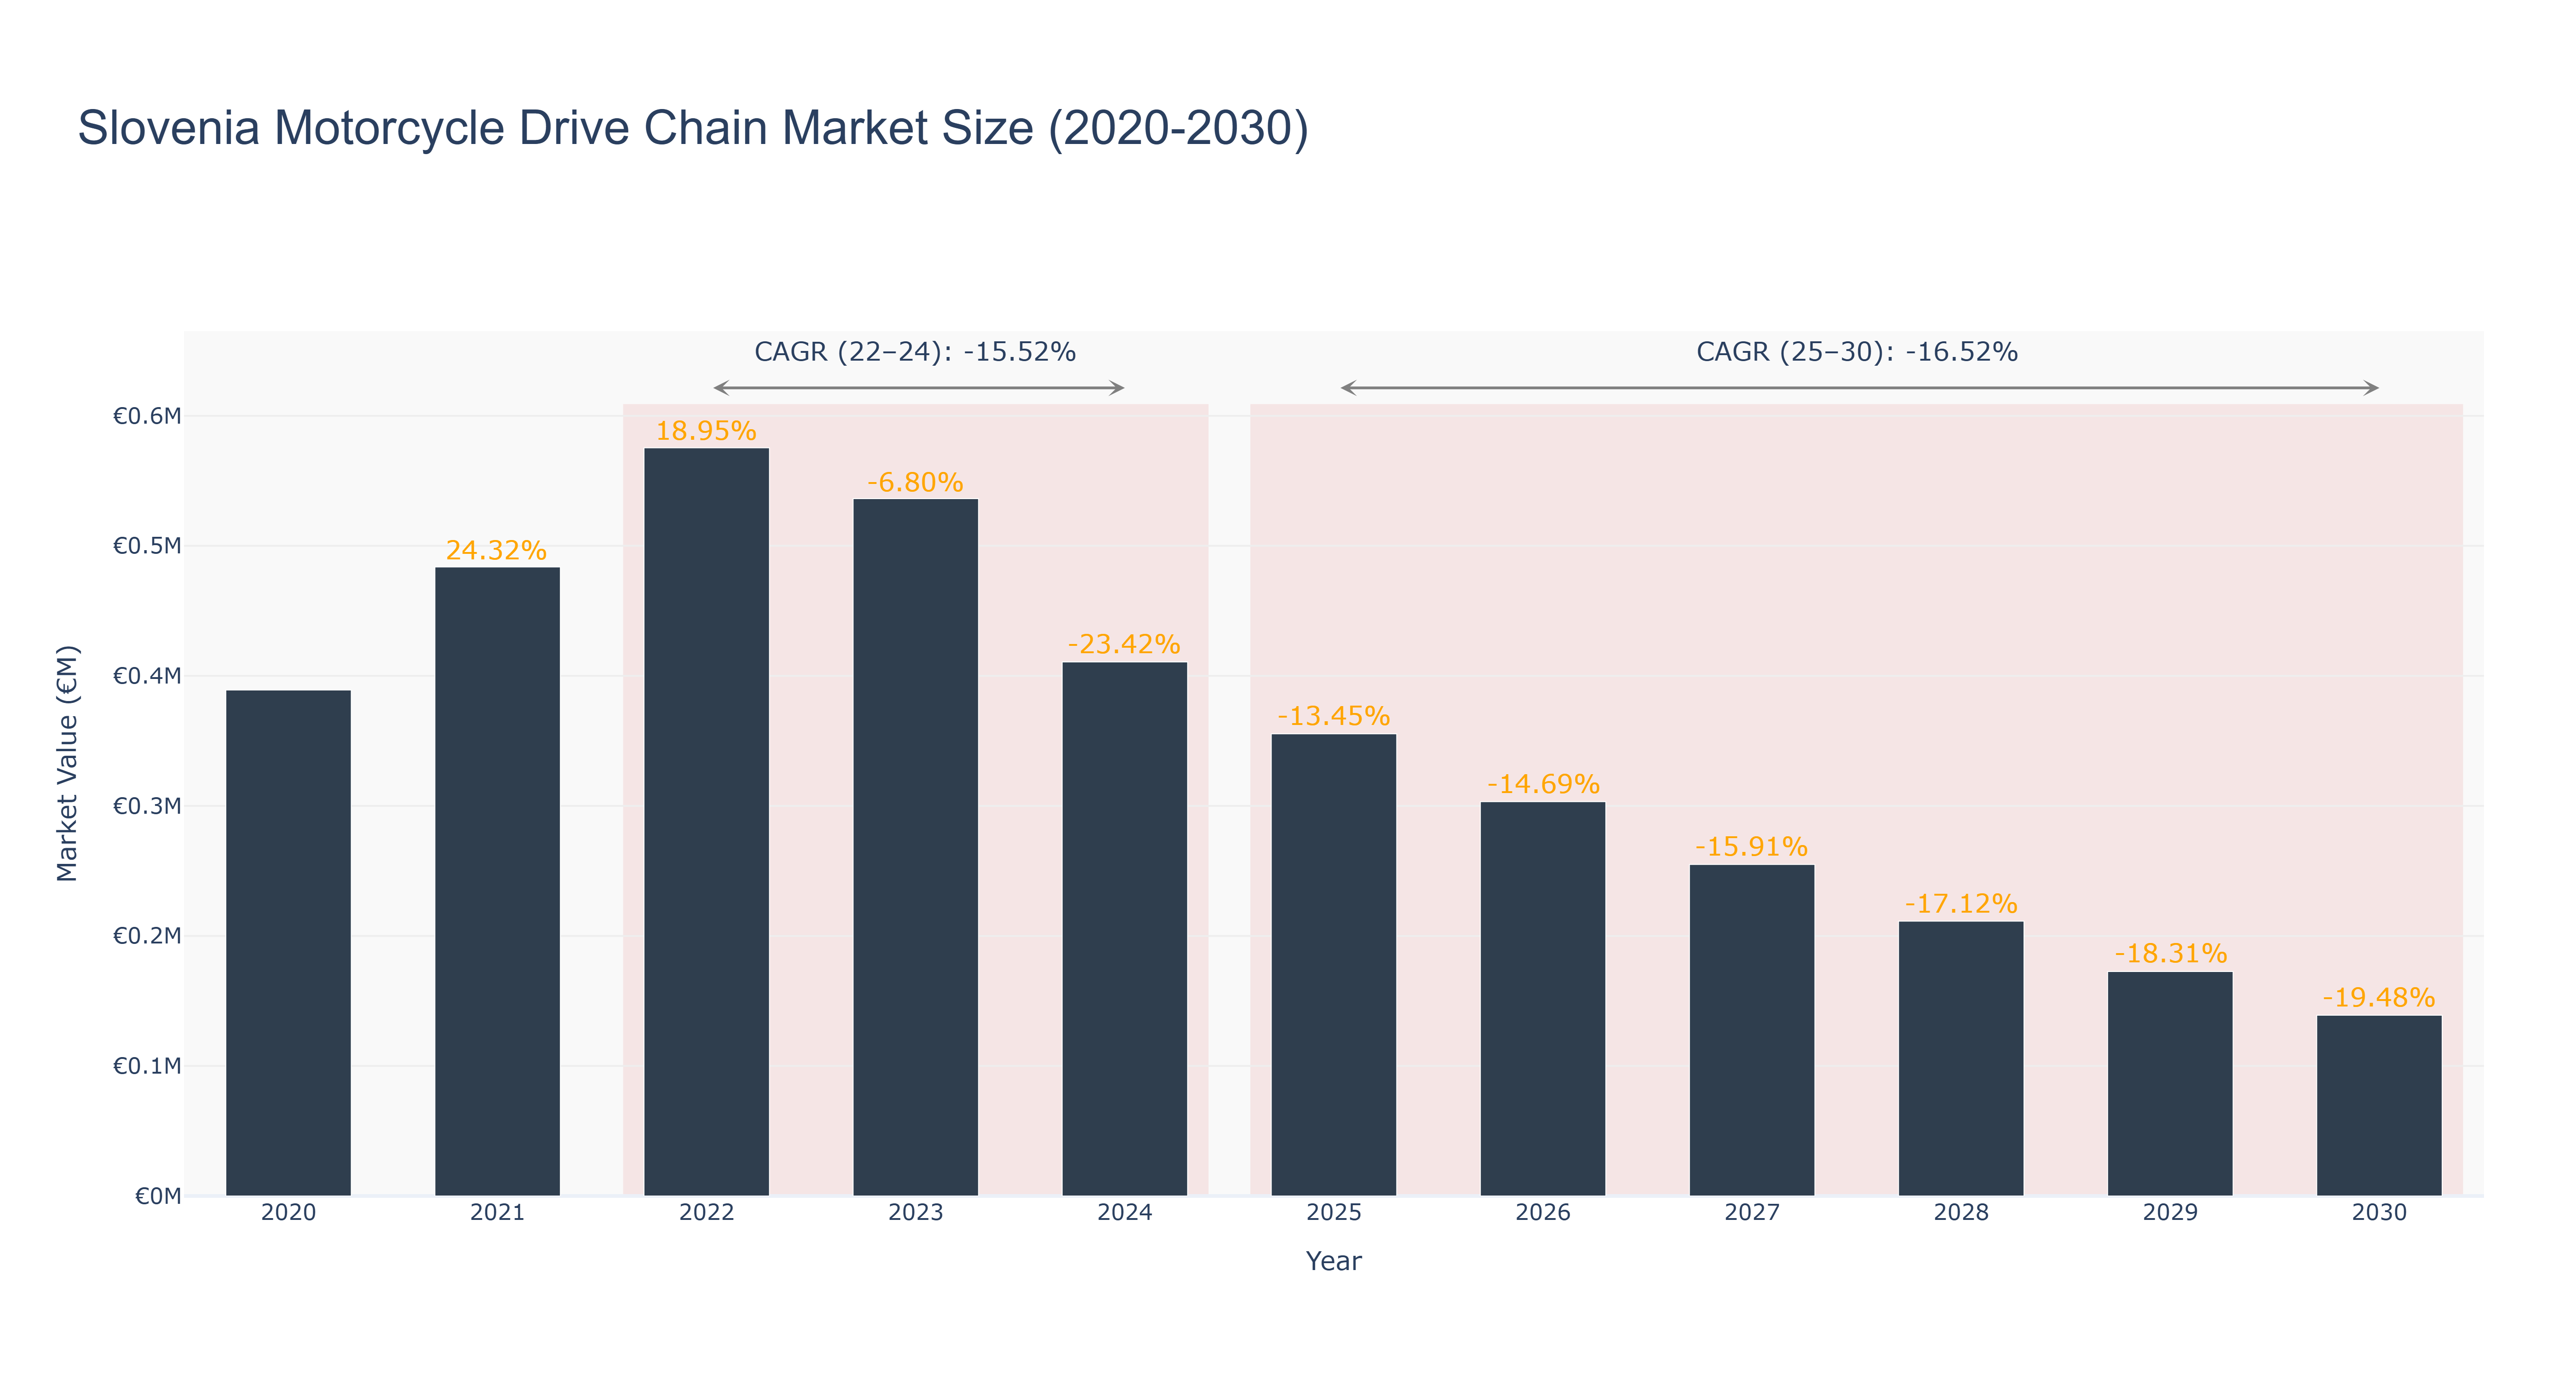
The Slovenia Motorcycle Drive Chain Market experienced significant fluctuations between 2020 and 2024, peaking at €575.39 thousand in 2022, followed by a sharp decline to €410.68 thousand by 2024, reflecting a compound annual growth rate (CAGR) of -15.52% during this period. The market's downturn can be attributed to decreased consumer demand, supply chain disruptions, and economic uncertainties impacting discretionary spending. Looking ahead, the forecasted period from 2025 to 2030 suggests a continued contraction, with projected market sizes decreasing from €355.45 thousand in 2025 to €139.02 thousand by 2030, corresponding to a CAGR of -16.52%. This decline is expected to be driven by ongoing shifts towards alternative transportation options and a potential decrease in motorcycle sales. As the industry evolves, stakeholders will need to adapt to these macroeconomic drivers to navigate the challenging landscape effectively.
Slovenia Motorcycle Drive Chain Market: Production & Trade Performance (2019-2025)
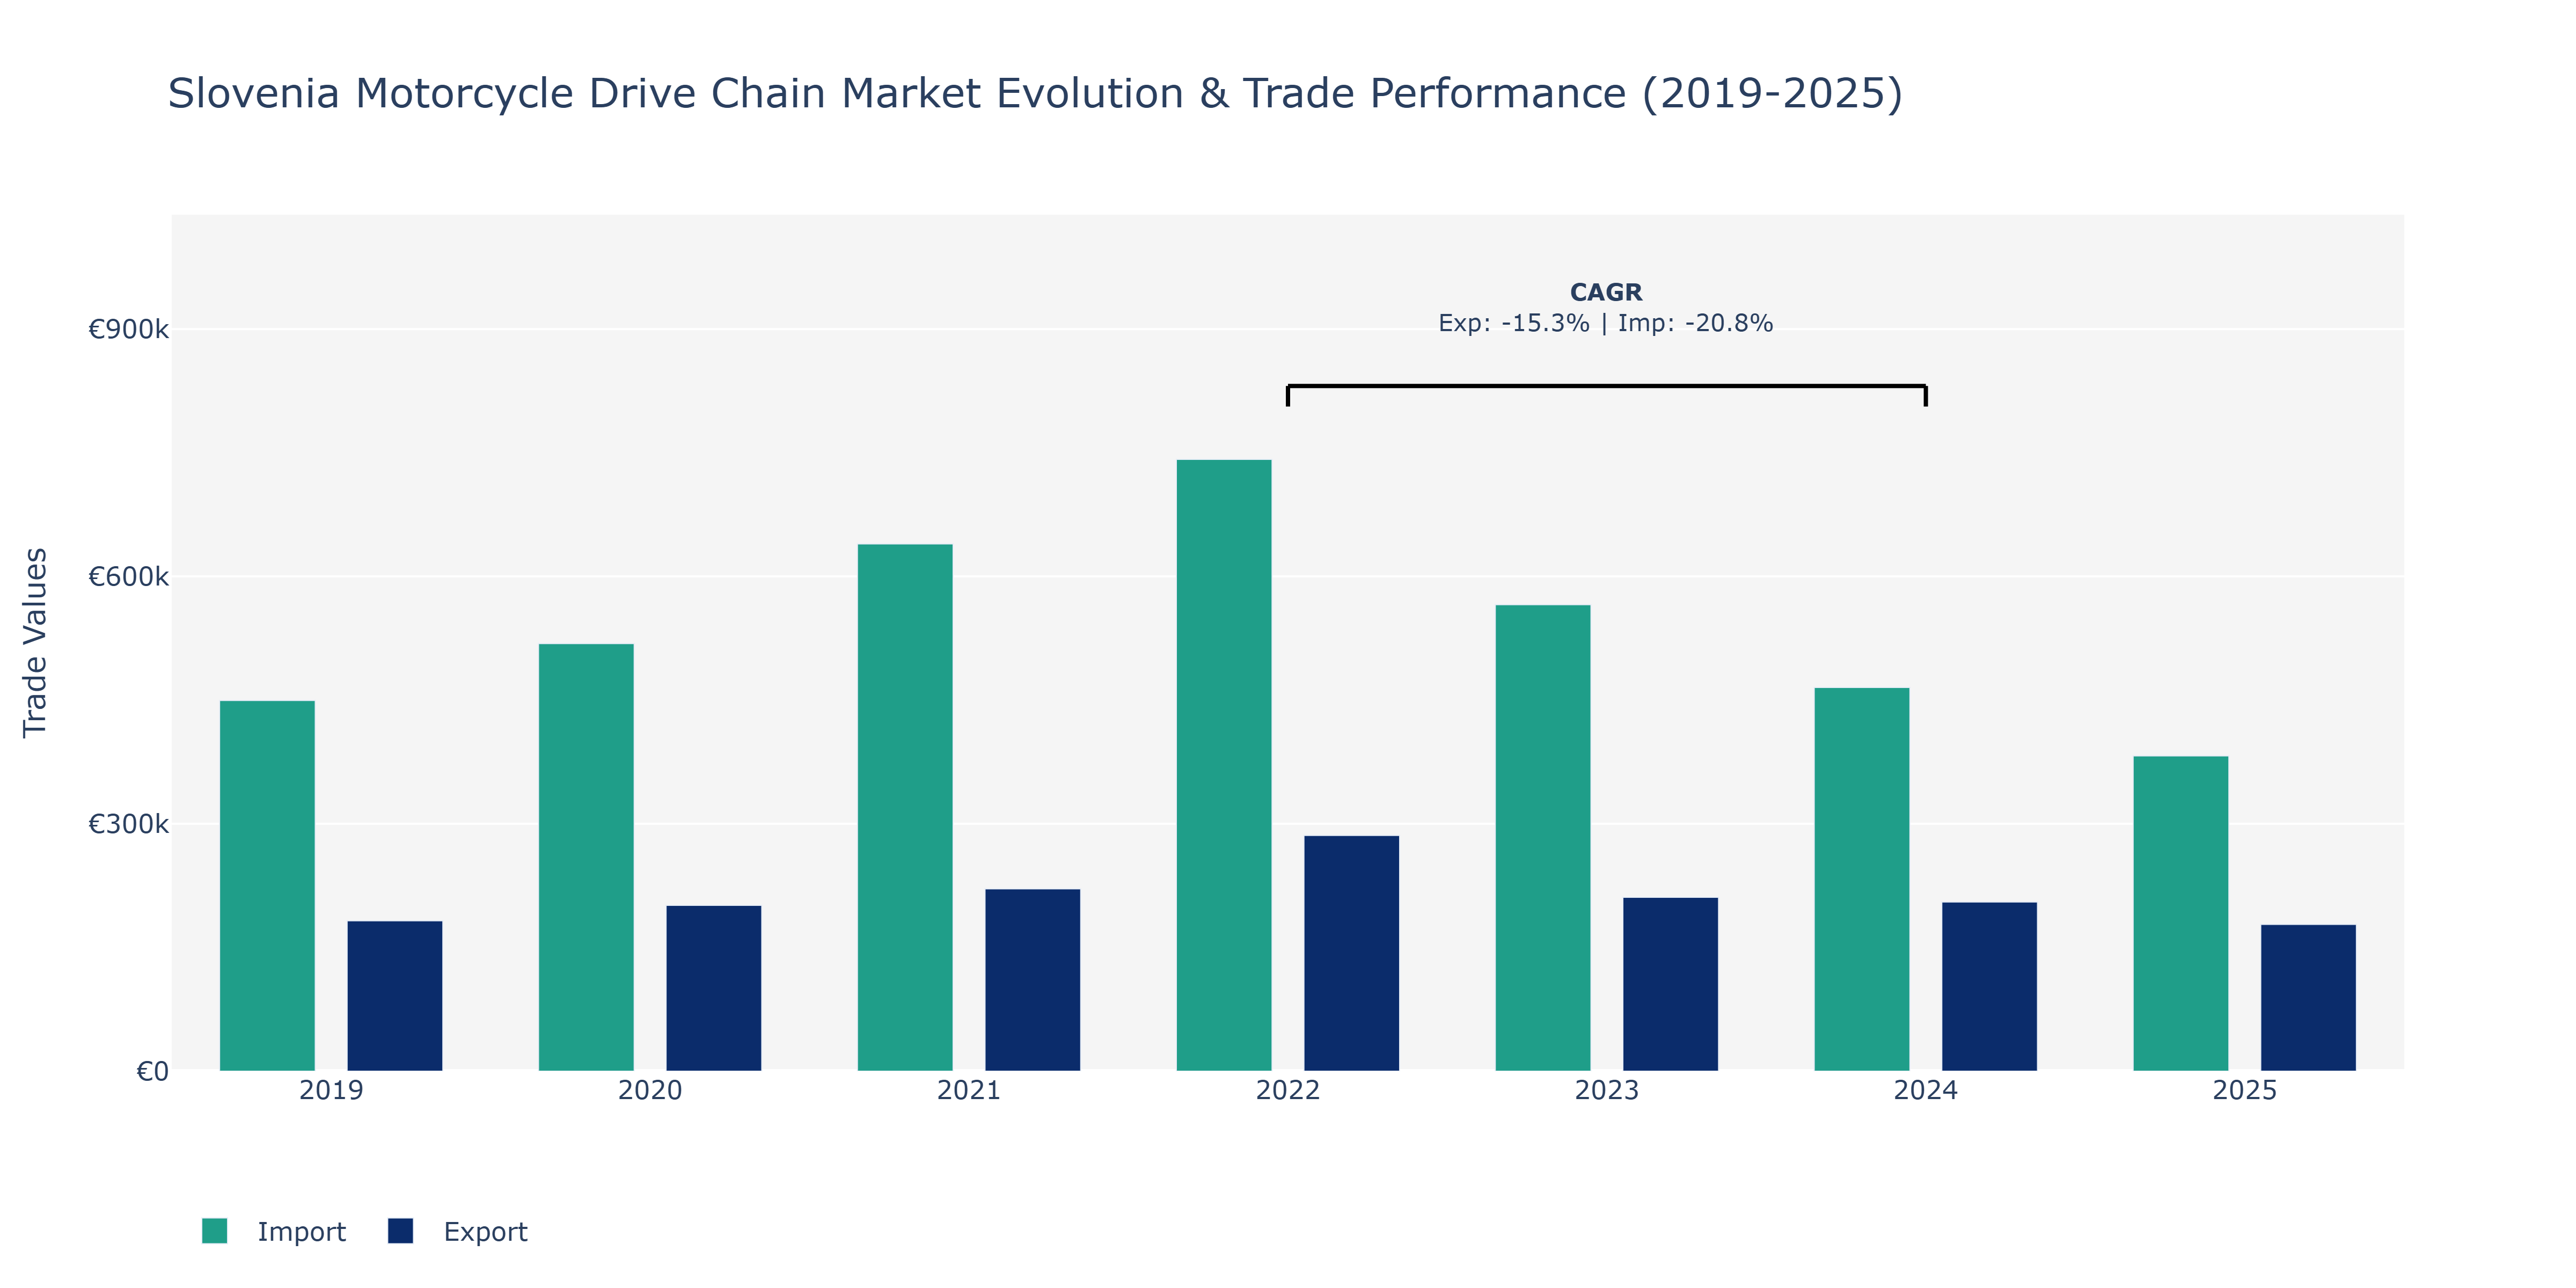
The Slovenia Motorcycle Drive Chain Market exhibited varying trends in Exports and Imports between 2019 and 2025. In 2019, Imports surpassed Exports significantly with €449.49 thousand against Exports of €182.34 thousand. The year 2022 marked the peak for both Exports and Imports, reaching €285.89 thousand and €741.97 thousand, respectively. However, a substantial decline was observed in 2023, with Exports dropping to €210.88 thousand and Imports to €565.8 thousand. Although both Exports and Imports experienced a slight recovery in 2024, the figures remained below the peak levels. The downward trend in Imports from 2022 to 2024 can be attributed to global economic uncertainties impacting consumer demand for motorcycles and related components. On the other hand, fluctuations in Exports could be linked to changes in international trade agreements affecting market access for Slovenian drive chain manufacturers. These trends highlight the market's sensitivity to external factors, necessitating strategic planning to navigate future uncertainties effectively.
Key Highlights of the Report:
- Slovenia Motorcycle Drive Chain Market Outlook
- Market Size of Slovenia Motorcycle Drive Chain Market, 2025
- Forecast of Slovenia Motorcycle Drive Chain Market, 2032
- Historical Data and Forecast of Slovenia Motorcycle Drive Chain Revenues & Volume for the Period 2022-2032F
- Slovenia Motorcycle Drive Chain Market Trend Evolution
- Slovenia Motorcycle Drive Chain Market Drivers and Challenges
- Slovenia Motorcycle Drive Chain Price Trends
- Slovenia Motorcycle Drive Chain Porter's Five Forces
- Slovenia Motorcycle Drive Chain Industry Life Cycle
- Historical Data and Forecast of Slovenia Motorcycle Drive Chain Market Revenues & Volume By Types for the Period 2022-2032F
- Historical Data and Forecast of Slovenia Motorcycle Drive Chain Market Revenues & Volume By Standard for the Period 2022-2032F
- Historical Data and Forecast of Slovenia Motorcycle Drive Chain Market Revenues & Volume By Cruiser for the Period 2022-2032F
- Historical Data and Forecast of Slovenia Motorcycle Drive Chain Market Revenues & Volume By Sports for the Period 2022-2032F
- Historical Data and Forecast of Slovenia Motorcycle Drive Chain Market Revenues & Volume By Off-Road for the Period 2022-2032F
- Historical Data and Forecast of Slovenia Motorcycle Drive Chain Market Revenues & Volume By Chain type for the Period 2022-2032F
- Historical Data and Forecast of Slovenia Motorcycle Drive Chain Market Revenues & Volume By Standard Rolling Chain for the Period 2022-2032F
- Historical Data and Forecast of Slovenia Motorcycle Drive Chain Market Revenues & Volume By O Ring Chain for the Period 2022-2032F
- Historical Data and Forecast of Slovenia Motorcycle Drive Chain Market Revenues & Volume By X Ring Chain for the Period 2022-2032F
- Historical Data and Forecast of Slovenia Motorcycle Drive Chain Market Revenues & Volume By Engine Capacity for the Period 2022-2032F
- Historical Data and Forecast of Slovenia Motorcycle Drive Chain Market Revenues & Volume By Up to 150 CC for the Period 2022-2032F
- Historical Data and Forecast of Slovenia Motorcycle Drive Chain Market Revenues & Volume By 151-300 CC for the Period 2022-2032F
- Historical Data and Forecast of Slovenia Motorcycle Drive Chain Market Revenues & Volume By 301-500 CC for the Period 2022-2032F
- Historical Data and Forecast of Slovenia Motorcycle Drive Chain Market Revenues & Volume By Above 500 CC for the Period 2022-2032F
- Historical Data and Forecast of Slovenia Motorcycle Drive Chain Market Revenues & Volume By Material Type for the Period 2022-2032F
- Historical Data and Forecast of Slovenia Motorcycle Drive Chain Market Revenues & Volume By Mild Steel for the Period 2022-2032F
- Historical Data and Forecast of Slovenia Motorcycle Drive Chain Market Revenues & Volume By Cast Steel for the Period 2022-2032F
- Historical Data and Forecast of Slovenia Motorcycle Drive Chain Market Revenues & Volume By Cast Iron for the Period 2022-2032F
- Historical Data and Forecast of Slovenia Motorcycle Drive Chain Market Revenues & Volume By Distribution Channel for the Period 2022-2032F
- Historical Data and Forecast of Slovenia Motorcycle Drive Chain Market Revenues & Volume By Online for the Period 2022-2032F
- Historical Data and Forecast of Slovenia Motorcycle Drive Chain Market Revenues & Volume By Offline for the Period 2022-2032F
- Slovenia Motorcycle Drive Chain Import Export Trade Statistics
- Market Opportunity Assessment By Types
- Market Opportunity Assessment By Chain type
- Market Opportunity Assessment By Engine Capacity
- Market Opportunity Assessment By Material Type
- Market Opportunity Assessment By Distribution Channel
- Slovenia Motorcycle Drive Chain Top Companies Market Share
- Slovenia Motorcycle Drive Chain Competitive Benchmarking By Technical and Operational Parameters
- Slovenia Motorcycle Drive Chain Company Profiles
- Slovenia Motorcycle Drive Chain Key Strategic Recommendations
Frequently Asked Questions About the Market Study (FAQs):
6Wresearch actively monitors the Slovenia Motorcycle Drive Chain Market and publishes its comprehensive annual report, highlighting emerging trends, growth drivers, revenue analysis, and forecast outlook. Our insights help businesses to make data-backed strategic decisions with ongoing market dynamics. Our analysts track relevent industries related to the Slovenia Motorcycle Drive Chain Market, allowing our clients with actionable intelligence and reliable forecasts tailored to emerging regional needs.
Yes, we provide customisation as per your requirements. To learn more, feel free to contact us on sales@6wresearch.com
1 Executive Summary |
2 Introduction |
2.1 Key Highlights of the Report |
2.2 Report Description |
2.3 Market Scope & Segmentation |
2.4 Research Methodology |
2.5 Assumptions |
3 Slovenia Motorcycle Drive Chain Market Overview |
3.1 Slovenia Country Macro Economic Indicators |
3.2 Slovenia Motorcycle Drive Chain Market Revenues & Volume, 2022 & 2032F |
3.3 Slovenia Motorcycle Drive Chain Market - Industry Life Cycle |
3.4 Slovenia Motorcycle Drive Chain Market - Porter's Five Forces |
3.5 Slovenia Motorcycle Drive Chain Market Revenues & Volume Share, By Types, 2022 & 2032F |
3.6 Slovenia Motorcycle Drive Chain Market Revenues & Volume Share, By Chain type, 2022 & 2032F |
3.7 Slovenia Motorcycle Drive Chain Market Revenues & Volume Share, By Engine Capacity, 2022 & 2032F |
3.8 Slovenia Motorcycle Drive Chain Market Revenues & Volume Share, By Material Type, 2022 & 2032F |
3.9 Slovenia Motorcycle Drive Chain Market Revenues & Volume Share, By Distribution Channel, 2022 & 2032F |
4 Slovenia Motorcycle Drive Chain Market Dynamics |
4.1 Impact Analysis |
4.2 Market Drivers |
4.2.1 Increasing popularity of motorcycling as a recreational activity in Slovenia |
4.2.2 Growth in motorcycle sales and registrations |
4.2.3 Technological advancements leading to more durable and efficient drive chains |
4.3 Market Restraints |
4.3.1 Economic downturn impacting consumer spending on motorcycles and related parts |
4.3.2 Competition from alternative modes of transport like electric scooters |
4.3.3 Fluctuating raw material prices affecting production costs |
5 Slovenia Motorcycle Drive Chain Market Trends |
6 Slovenia Motorcycle Drive Chain Market, By Types |
6.1 Slovenia Motorcycle Drive Chain Market, By Types |
6.1.1 Overview and Analysis |
6.1.2 Slovenia Motorcycle Drive Chain Market Revenues & Volume, By Types, 2022-2032F |
6.1.3 Slovenia Motorcycle Drive Chain Market Revenues & Volume, By Standard, 2022-2032F |
6.1.4 Slovenia Motorcycle Drive Chain Market Revenues & Volume, By Cruiser, 2022-2032F |
6.1.5 Slovenia Motorcycle Drive Chain Market Revenues & Volume, By Sports, 2022-2032F |
6.1.6 Slovenia Motorcycle Drive Chain Market Revenues & Volume, By Off-Road, 2022-2032F |
6.2 Slovenia Motorcycle Drive Chain Market, By Chain type |
6.2.1 Overview and Analysis |
6.2.2 Slovenia Motorcycle Drive Chain Market Revenues & Volume, By Standard Rolling Chain, 2022-2032F |
6.2.3 Slovenia Motorcycle Drive Chain Market Revenues & Volume, By O Ring Chain, 2022-2032F |
6.2.4 Slovenia Motorcycle Drive Chain Market Revenues & Volume, By X Ring Chain, 2022-2032F |
6.3 Slovenia Motorcycle Drive Chain Market, By Engine Capacity |
6.3.1 Overview and Analysis |
6.3.2 Slovenia Motorcycle Drive Chain Market Revenues & Volume, By Up to 150 CC, 2022-2032F |
6.3.3 Slovenia Motorcycle Drive Chain Market Revenues & Volume, By 151-300 CC, 2022-2032F |
6.3.4 Slovenia Motorcycle Drive Chain Market Revenues & Volume, By 301-500 CC, 2022-2032F |
6.3.5 Slovenia Motorcycle Drive Chain Market Revenues & Volume, By Above 500 CC, 2022-2032F |
6.4 Slovenia Motorcycle Drive Chain Market, By Material Type |
6.4.1 Overview and Analysis |
6.4.2 Slovenia Motorcycle Drive Chain Market Revenues & Volume, By Mild Steel, 2022-2032F |
6.4.3 Slovenia Motorcycle Drive Chain Market Revenues & Volume, By Cast Steel, 2022-2032F |
6.4.4 Slovenia Motorcycle Drive Chain Market Revenues & Volume, By Cast Iron, 2022-2032F |
6.5 Slovenia Motorcycle Drive Chain Market, By Distribution Channel |
6.5.1 Overview and Analysis |
6.5.2 Slovenia Motorcycle Drive Chain Market Revenues & Volume, By Online, 2022-2032F |
6.5.3 Slovenia Motorcycle Drive Chain Market Revenues & Volume, By Offline, 2022-2032F |
7 Slovenia Motorcycle Drive Chain Market Import-Export Trade Statistics |
7.1 Slovenia Motorcycle Drive Chain Market Export to Major Countries |
7.2 Slovenia Motorcycle Drive Chain Market Imports from Major Countries |
8 Slovenia Motorcycle Drive Chain Market Key Performance Indicators |
8.1 Number of motorcycle registrations in Slovenia |
8.2 Average age of motorcycles on the road |
8.3 Adoption rate of advanced drive chain technologies in motorcycles |
9 Slovenia Motorcycle Drive Chain Market - Opportunity Assessment |
9.1 Slovenia Motorcycle Drive Chain Market Opportunity Assessment, By Types, 2022 & 2032F |
9.2 Slovenia Motorcycle Drive Chain Market Opportunity Assessment, By Chain type, 2022 & 2032F |
9.3 Slovenia Motorcycle Drive Chain Market Opportunity Assessment, By Engine Capacity, 2022 & 2032F |
9.4 Slovenia Motorcycle Drive Chain Market Opportunity Assessment, By Material Type, 2022 & 2032F |
9.5 Slovenia Motorcycle Drive Chain Market Opportunity Assessment, By Distribution Channel, 2022 & 2032F |
10 Slovenia Motorcycle Drive Chain Market - Competitive Landscape |
10.1 Slovenia Motorcycle Drive Chain Market Revenue Share, By Companies, 2025 |
10.2 Slovenia Motorcycle Drive Chain Market Competitive Benchmarking, By Operating and Technical Parameters |
11 Company Profiles |
12 Recommendations |
13 Disclaimer |
Global Go To Market Strategy - 2030
Export potential enables firms to identify high-growth global markets with greater confidence by combining advanced trade intelligence with a structured quantitative methodology. The framework analyzes emerging demand trends and country-level import patterns while integrating macroeconomic and trade datasets such as GDP and population forecasts, bilateral import–export flows, tariff structures, elasticity differentials between developed and developing economies, geographic distance, and import demand projections. Using weighted trade values from 2020–2024 as the base period to project country-to-country export potential for 2030, these inputs are operationalized through calculated drivers such as gravity model parameters, tariff impact factors, and projected GDP per-capita growth. Through an analysis of hidden potentials, demand hotspots, and market conditions that are most favorable to success, this method enables firms to focus on target countries, maximize returns, and global expansion with data, backed by accuracy.
By factoring in the projected importer demand gap that is currently unmet and could be potential opportunity, it identifies the potential for the Exporter (Country) among 190 countries, against the general trade analysis, which identifies the biggest importer or exporter.
To discover high-growth global markets and optimize your business strategy:
Click Here
Pricing
- Single User License$ 1,995
- Department License$ 2,400
- Site License$ 3,120
- Global License$ 3,795

Leadership Perspectives from Industry Events
Search
Thought Leadership and Analyst Meet


Our Clients
6WResearch In News
- Doha a strategic location for EV manufacturing hub: IPA Qatar
- Demand for luxury TVs surging in the GCC, says Samsung
- Empowering Growth: The Thriving Journey of Bangladesh’s Cable Industry
- Demand for luxury TVs surging in the GCC, says Samsung
- Video call with a traditional healer? Once unthinkable, it’s now common in South Africa
- Intelligent Buildings To Smooth GCC’s Path To Net Zero
Latest Reports
- Taiwan Airport Wireless Infrastructure Market (2026-2032)
- Vietnam Airport Wireless Infrastructure Market (2026-2032)
- Thailand Airport Wireless Infrastructure Market (2026-2032)
- South Korea Airport Wireless Infrastructure Market (2026-2032)
- Romania Airport Wireless Infrastructure Market (2026-2032)
- Qatar Airport Wireless Infrastructure Market (2026-2032)
- Philippines Airport Wireless Infrastructure Market (2026-2032)
- Japan Airport Wireless Infrastructure Market (2026-2032)
- Taiwan Airport Winter Services Market (2026-2032)
- Vietnam Airport Winter Services Market (2026-2032)
Industry Events and Analyst Meet

HIMTEX 2026

India Refining Summit 2026

India EV Show 2026

EV tech India Expo 2026

Auto Tech Asia 2026
Whitepaper
- Middle East & Africa Commercial Security Market Click here to view more.
- Middle East & Africa Fire Safety Systems & Equipment Market Click here to view more.
- GCC Drone Market Click here to view more.
- Middle East Lighting Fixture Market Click here to view more.
- GCC Physical & Perimeter Security Market Click here to view more.