Slovenia Radar Market (2026-2032) | Outlook, Segmentation, Growth, Size, Value, Revenue, Companies, Share, Analysis, Trends, Industry & Forecast
Market Forecast By Component (Antenna, Transmitter, Receiver, Others), By Service (Installation/Integration, Support & Maintenance, Training & Consulting), By Platform (Ground-based, Naval, Airborne, Space-based), By Frequency Band (L-band, S-band, C-band, X-band, Ku-band, Ka-band, Others), By Range (Long, Medium, Short), By End-Users (Military Applications, Air Traffic Control, Remote Sensing, Ground Traffic Control, Others) And Competitive Landscape
| Product Code: ETC4663081 | Publication Date: Nov 2023 | Updated Date: Apr 2026 | Product Type: Market Research Report | |
| Publisher: 6Wresearch | Author: Shubham Padhi | No. of Pages: 60 | No. of Figures: 30 | No. of Tables: 5 |
Slovenia Radar Market Size (2020-2030)
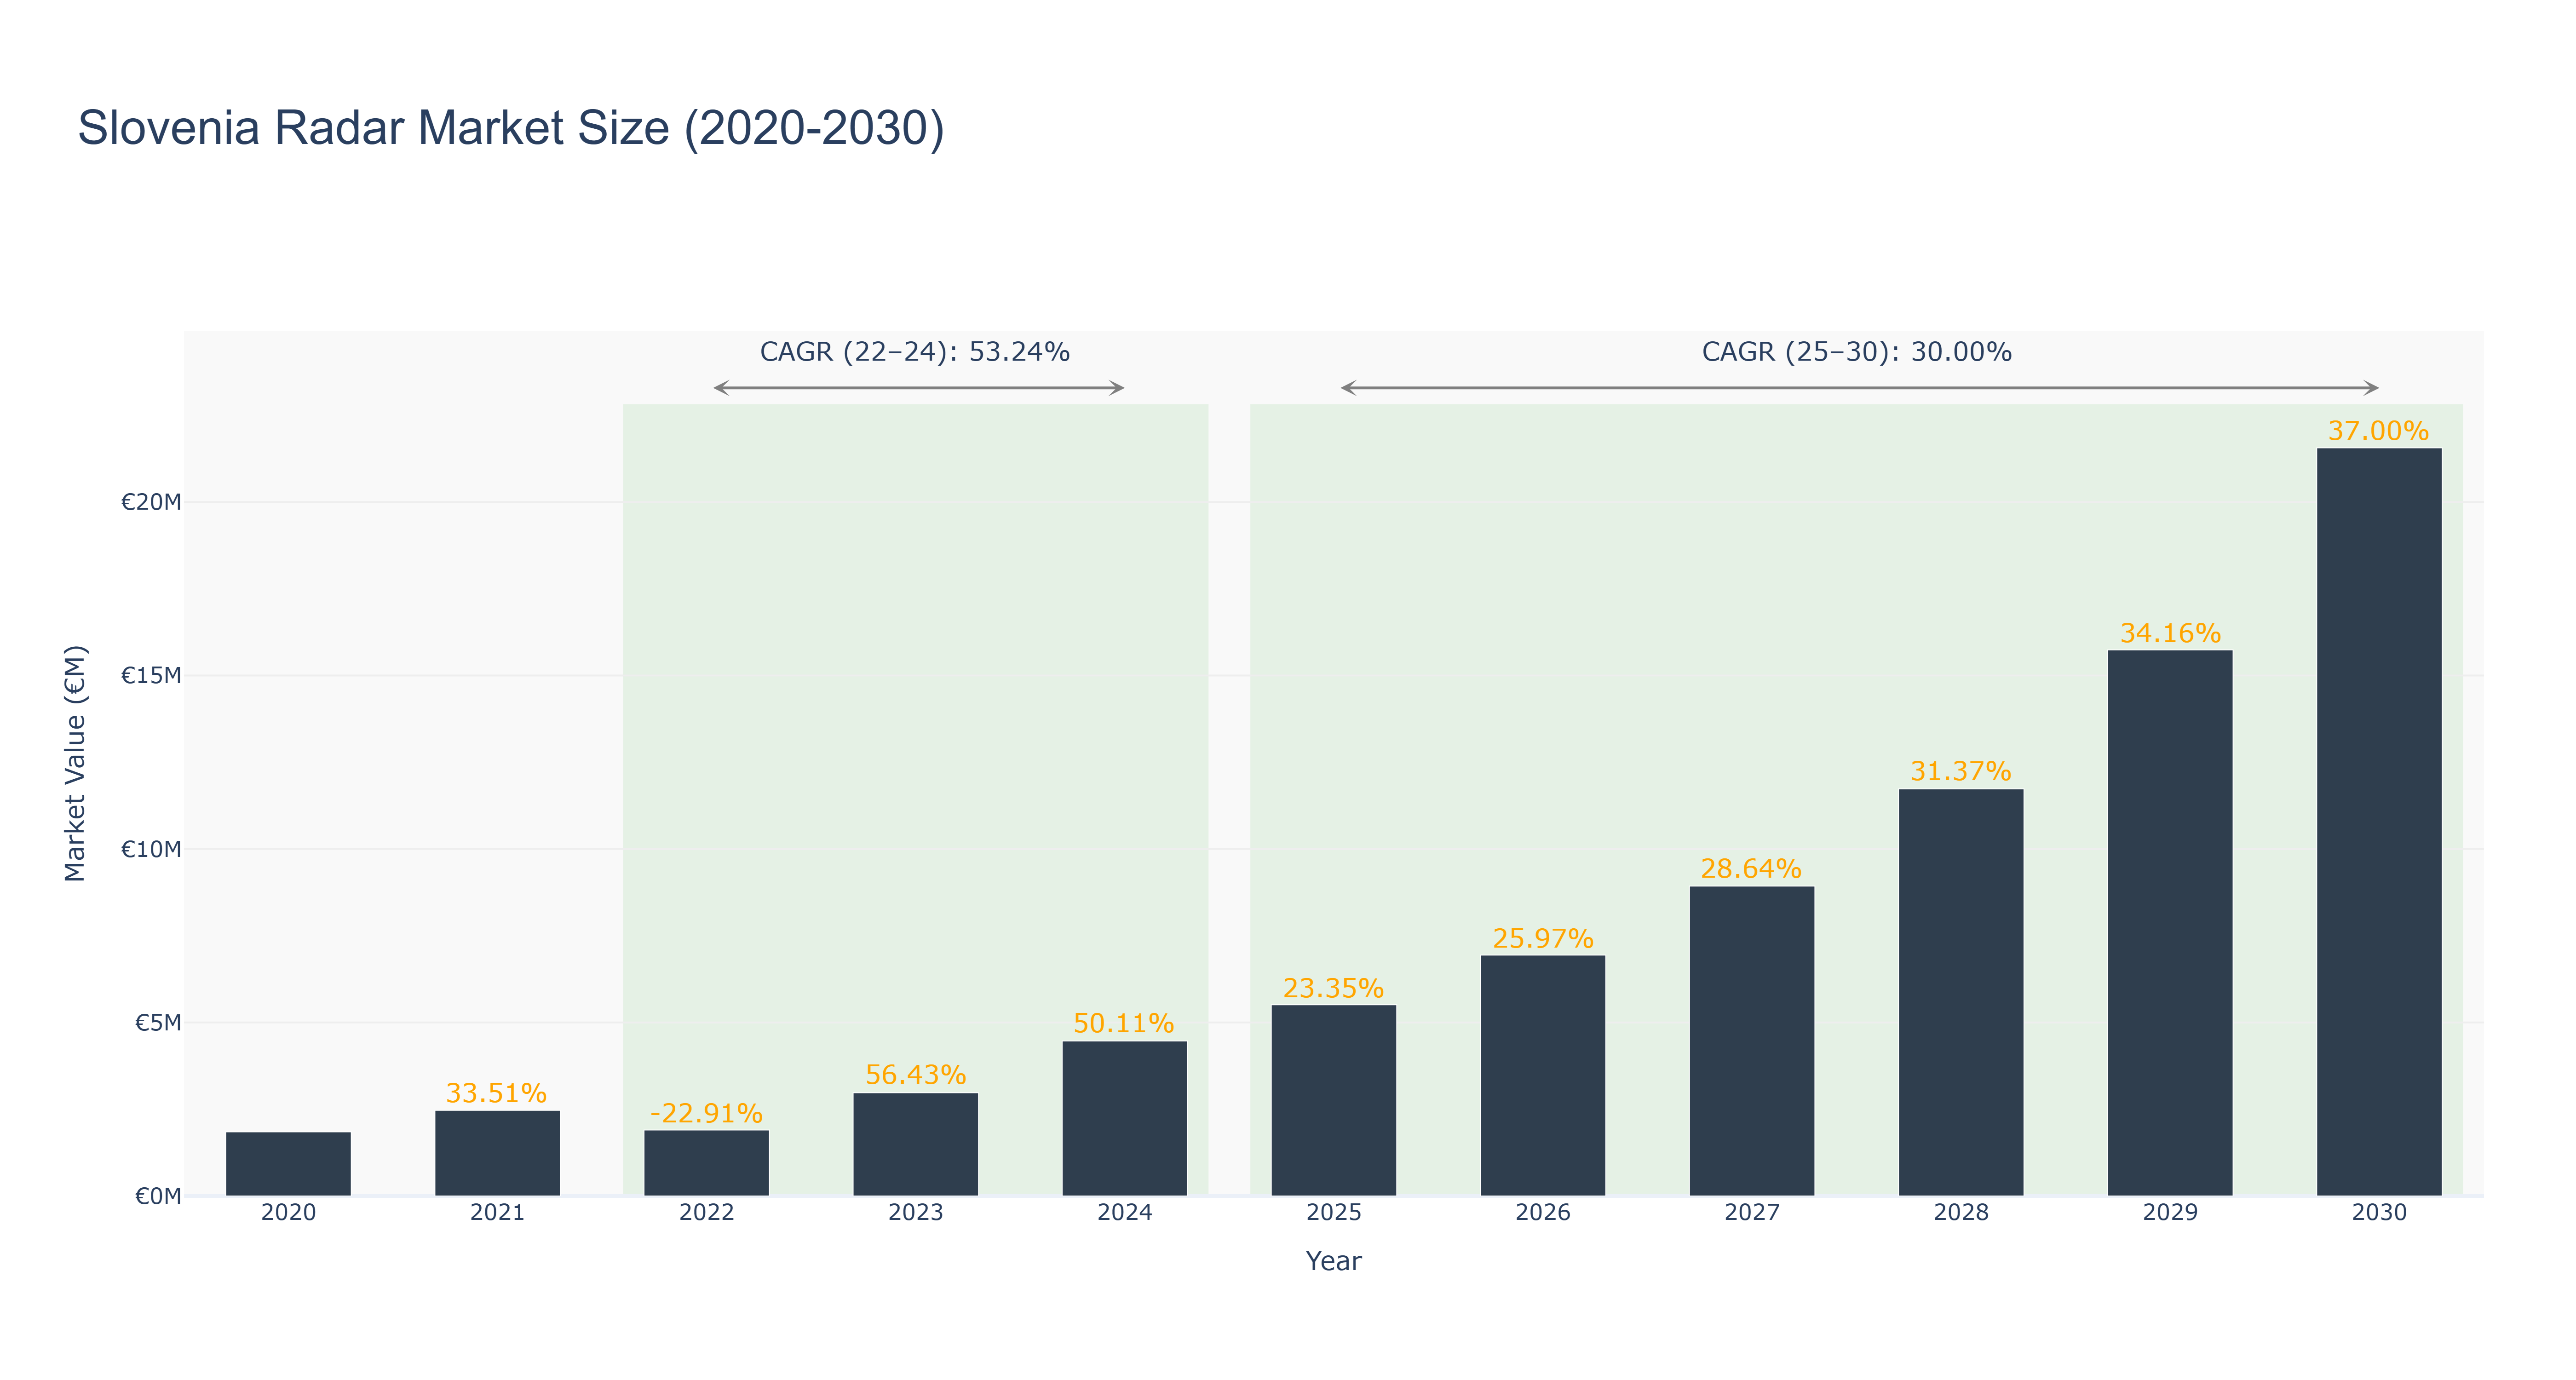
Slovenia Radar Market has shown significant growth over the years. The peak market size of €21.56 million is forecasted for 2030, with a steady increase from €1.85 million in 2020. Notably, the market experienced a sharp decline in 2022 to €1.90 million, attributed to external factors impacting demand. However, the market rebounded swiftly with a CAGR of 53.24% from 2022 to 2024, driven by technological advancements and increased adoption. Looking ahead, a CAGR of 30.0% from 2025 to 2030 is expected, indicating sustained growth opportunities. Industry drivers such as increased focus on national security and surveillance are fueling market expansion. Future developments in Slovenia include the implementation of advanced radar systems for border control and military applications, enhancing the country's defense capabilities.
Slovenia Radar Market: Production & Trade Performance (2019-2025)
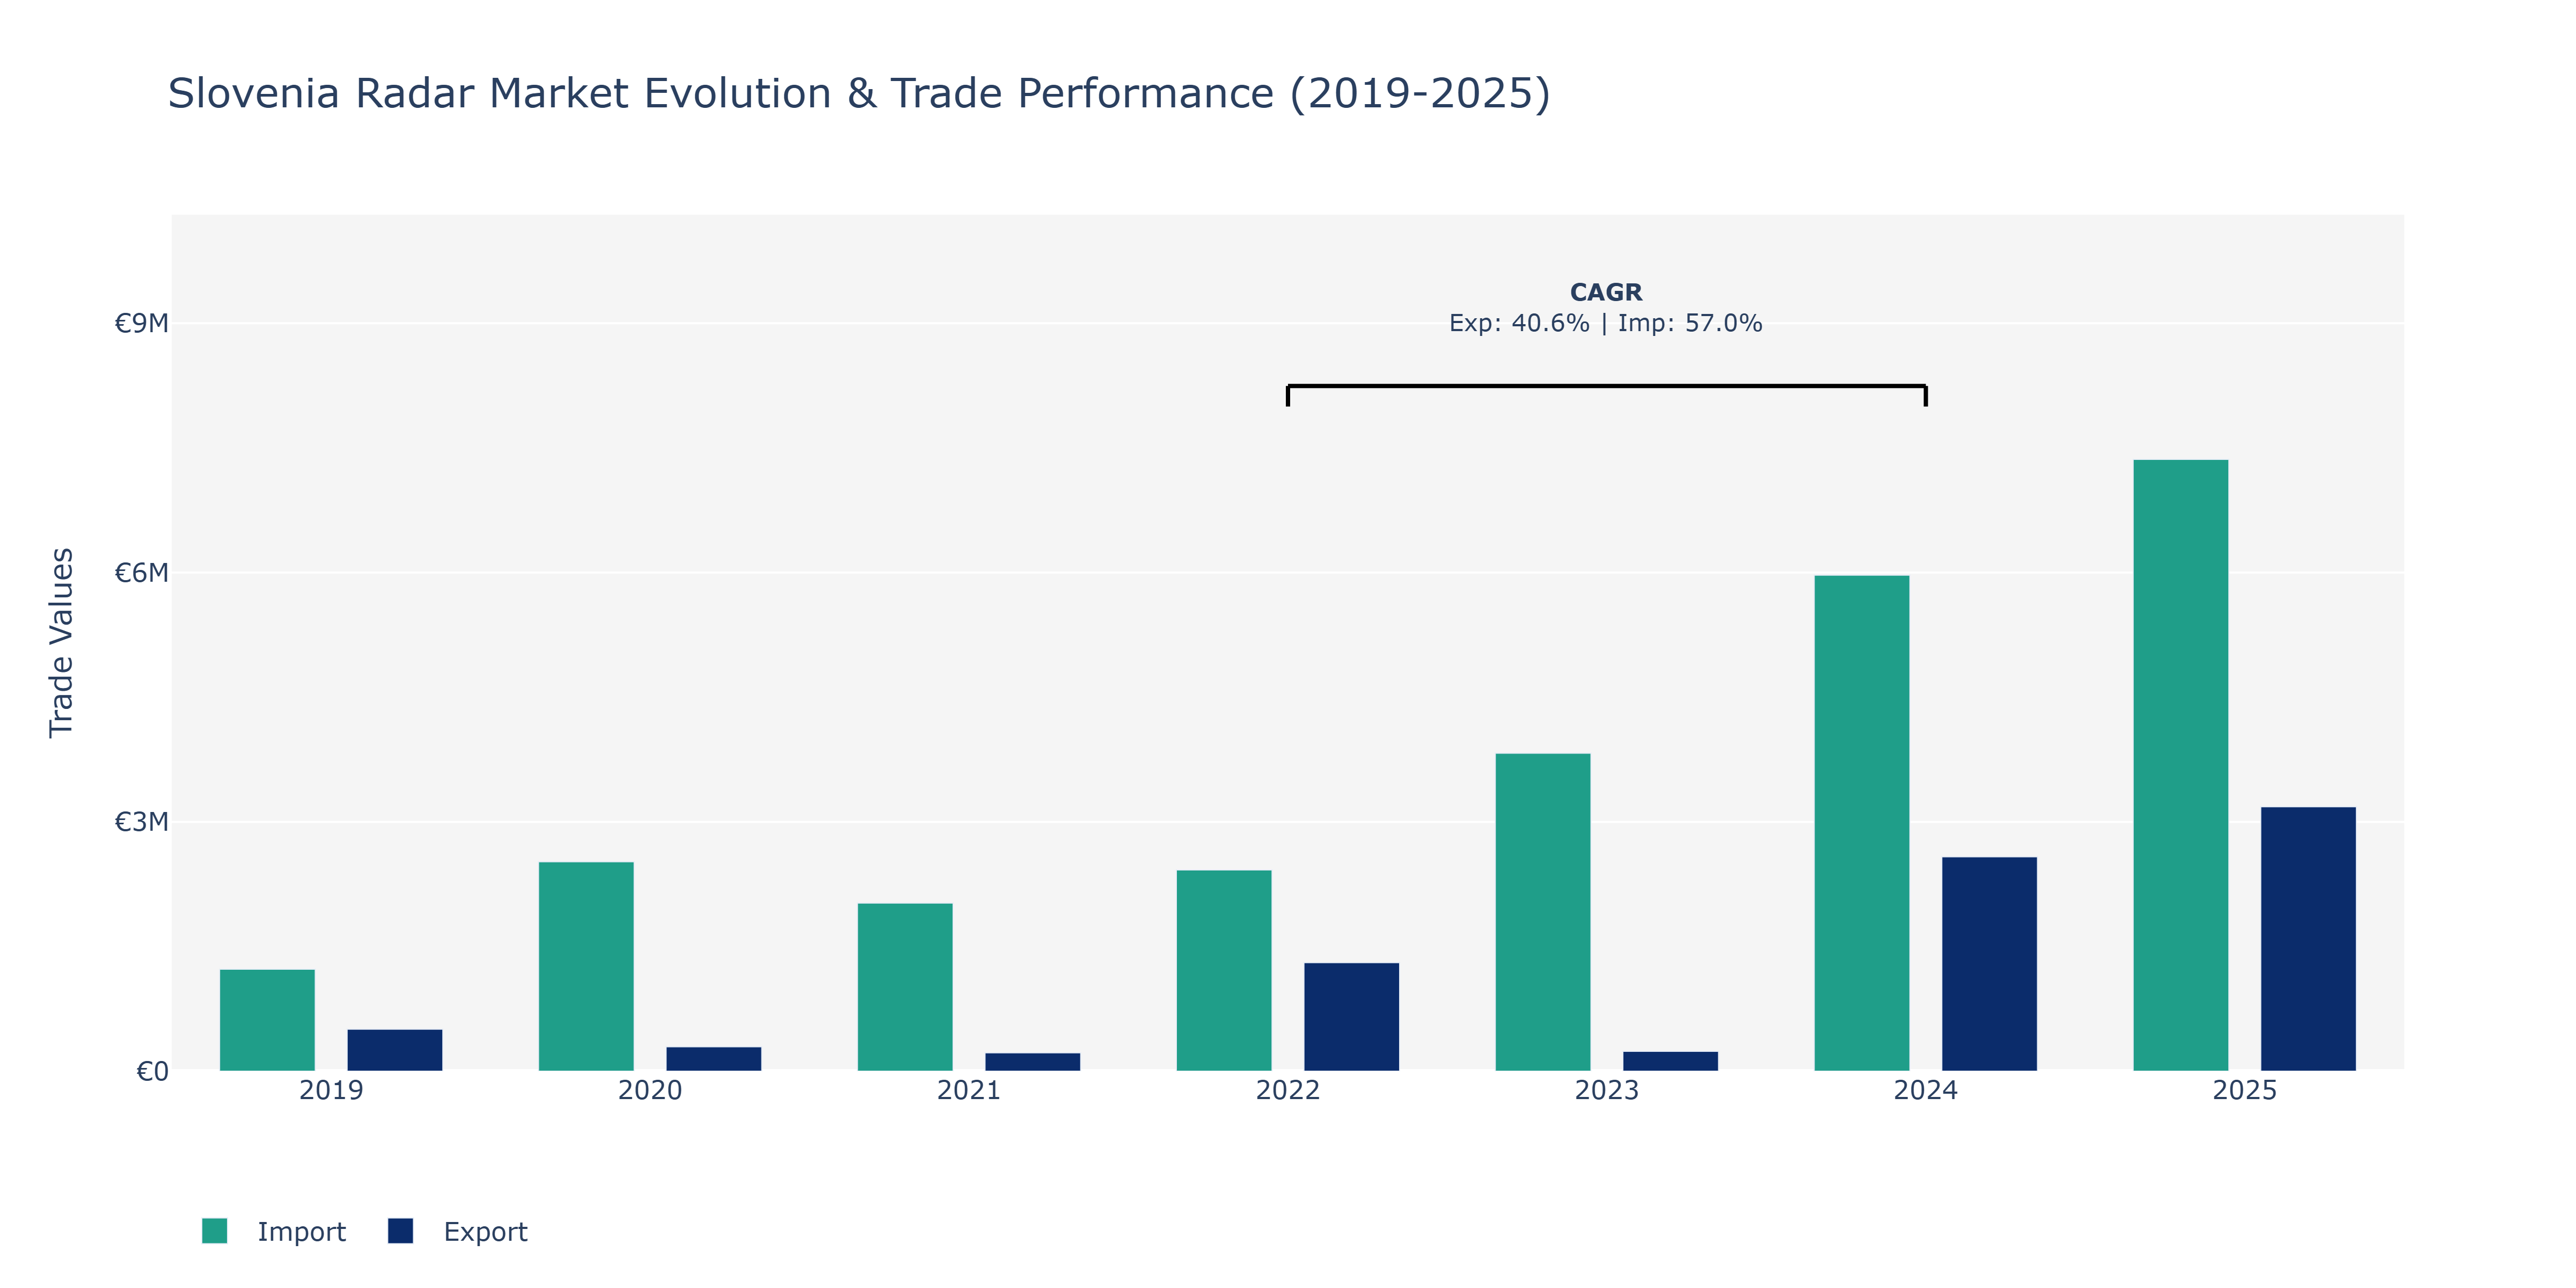
Between 2019 and 2025, Slovenia's Radar Market showcased varied performances in exports and imports. Exports experienced a downward trajectory from €505.97 thousand in 2019 to €220.7 thousand in 2021 before rebounding significantly in 2022 to €1.31 million and continuing to rise to €3.18 million in 2025. In contrast, imports surged consistently over the years, starting at €1.23 million in 2019 and peaking at €7.36 million in 2025. The steep growth in imports can be attributed to Slovenia's increasing reliance on foreign technology and components for radar systems, reflecting the country's efforts to modernize its defense capabilities and infrastructure. This heightened import activity could signify strategic partnerships with global radar technology providers, aiming to enhance Slovenia's national security and bolster its position in the global radar market.
Key Highlights of the Report:
- Slovenia Radar Market Outlook
- Market Size of Slovenia Radar Market, 2025
- Forecast of Slovenia Radar Market, 2032
- Historical Data and Forecast of Slovenia Radar Revenues & Volume for the Period 2022-2032F
- Slovenia Radar Market Trend Evolution
- Slovenia Radar Market Drivers and Challenges
- Slovenia Radar Price Trends
- Slovenia Radar Porter`s Five Forces
- Slovenia Radar Industry Life Cycle
- Historical Data and Forecast of Slovenia Radar Market Revenues & Volume By Component for the Period 2022-2032F
- Historical Data and Forecast of Slovenia Radar Market Revenues & Volume By Antenna for the Period 2022-2032F
- Historical Data and Forecast of Slovenia Radar Market Revenues & Volume By Transmitter for the Period 2022-2032F
- Historical Data and Forecast of Slovenia Radar Market Revenues & Volume By Receiver for the Period 2022-2032F
- Historical Data and Forecast of Slovenia Radar Market Revenues & Volume By Others for the Period 2022-2032F
- Historical Data and Forecast of Slovenia Radar Market Revenues & Volume By Service for the Period 2022-2032F
- Historical Data and Forecast of Slovenia Radar Market Revenues & Volume By Installation/Integration for the Period 2022-2032F
- Historical Data and Forecast of Slovenia Radar Market Revenues & Volume By Support & Maintenance for the Period 2022-2032F
- Historical Data and Forecast of Slovenia Radar Market Revenues & Volume By Training & Consulting for the Period 2022-2032F
- Historical Data and Forecast of Slovenia Radar Market Revenues & Volume By Platform for the Period 2022-2032F
- Historical Data and Forecast of Slovenia Radar Market Revenues & Volume By Ground-based for the Period 2022-2032F
- Historical Data and Forecast of Slovenia Radar Market Revenues & Volume By Naval for the Period 2022-2032F
- Historical Data and Forecast of Slovenia Radar Market Revenues & Volume By Airborne for the Period 2022-2032F
- Historical Data and Forecast of Slovenia Radar Market Revenues & Volume By Space-based for the Period 2022-2032F
- Historical Data and Forecast of Slovenia Radar Market Revenues & Volume By Frequency Band for the Period 2022-2032F
- Historical Data and Forecast of Slovenia Radar Market Revenues & Volume By L-band for the Period 2022-2032F
- Historical Data and Forecast of Slovenia Radar Market Revenues & Volume By S-band for the Period 2022-2032F
- Historical Data and Forecast of Slovenia Radar Market Revenues & Volume By C-band for the Period 2022-2032F
- Historical Data and Forecast of Slovenia Radar Market Revenues & Volume By X-band for the Period 2022-2032F
- Historical Data and Forecast of Slovenia Radar Market Revenues & Volume By Ku-band for the Period 2022-2032F
- Historical Data and Forecast of Slovenia Radar Market Revenues & Volume By Ka-band for the Period 2022-2032F
- Historical Data and Forecast of Slovenia Radar Market Revenues & Volume By Others for the Period 2022-2032F
- Historical Data and Forecast of Slovenia Radar Market Revenues & Volume By Range for the Period 2022-2032F
- Historical Data and Forecast of Slovenia Radar Market Revenues & Volume By Long for the Period 2022-2032F
- Historical Data and Forecast of Slovenia Radar Market Revenues & Volume By Medium for the Period 2022-2032F
- Historical Data and Forecast of Slovenia Radar Market Revenues & Volume By Short for the Period 2022-2032F
- Historical Data and Forecast of Slovenia Radar Market Revenues & Volume By End-Users for the Period 2022-2032F
- Historical Data and Forecast of Slovenia Radar Market Revenues & Volume By Military Applications for the Period 2022-2032F
- Historical Data and Forecast of Slovenia Radar Market Revenues & Volume By Air Traffic Control for the Period 2022-2032F
- Historical Data and Forecast of Slovenia Radar Market Revenues & Volume By Remote Sensing for the Period 2022-2032F
- Historical Data and Forecast of Slovenia Radar Market Revenues & Volume By Ground Traffic Control for the Period 2022-2032F
- Historical Data and Forecast of Slovenia Radar Market Revenues & Volume By Others for the Period 2022-2032F
- Slovenia Radar Import Export Trade Statistics
- Market Opportunity Assessment By Component
- Market Opportunity Assessment By Service
- Market Opportunity Assessment By Platform
- Market Opportunity Assessment By Frequency Band
- Market Opportunity Assessment By Range
- Market Opportunity Assessment By End-Users
- Slovenia Radar Top Companies Market Share
- Slovenia Radar Competitive Benchmarking By Technical and Operational Parameters
- Slovenia Radar Company Profiles
- Slovenia Radar Key Strategic Recommendations
Frequently Asked Questions About the Market Study (FAQs):
6Wresearch actively monitors the Slovenia Radar Market and publishes its comprehensive annual report, highlighting emerging trends, growth drivers, revenue analysis, and forecast outlook. Our insights help businesses to make data-backed strategic decisions with ongoing market dynamics. Our analysts track relevent industries related to the Slovenia Radar Market, allowing our clients with actionable intelligence and reliable forecasts tailored to emerging regional needs.
Yes, we provide customisation as per your requirements. To learn more, feel free to contact us on sales@6wresearch.com
1 Executive Summary |
2 Introduction |
2.1 Key Highlights of the Report |
2.2 Report Description |
2.3 Market Scope & Segmentation |
2.4 Research Methodology |
2.5 Assumptions |
3 Slovenia Radar Market Overview |
3.1 Slovenia Country Macro Economic Indicators |
3.2 Slovenia Radar Market Revenues & Volume, 2022 & 2032F |
3.3 Slovenia Radar Market - Industry Life Cycle |
3.4 Slovenia Radar Market - Porter's Five Forces |
3.5 Slovenia Radar Market Revenues & Volume Share, By Component, 2022 & 2032F |
3.6 Slovenia Radar Market Revenues & Volume Share, By Service, 2022 & 2032F |
3.7 Slovenia Radar Market Revenues & Volume Share, By Platform, 2022 & 2032F |
3.8 Slovenia Radar Market Revenues & Volume Share, By Frequency Band, 2022 & 2032F |
3.9 Slovenia Radar Market Revenues & Volume Share, By Range, 2022 & 2032F |
3.10 Slovenia Radar Market Revenues & Volume Share, By End-Users, 2022 & 2032F |
4 Slovenia Radar Market Dynamics |
4.1 Impact Analysis |
4.2 Market Drivers |
4.2.1 Technological advancements in radar systems |
4.2.2 Increasing demand for radar systems in defense and security applications |
4.2.3 Growing investments in infrastructure development in Slovenia |
4.3 Market Restraints |
4.3.1 High initial investment costs for radar systems |
4.3.2 Regulatory challenges and compliance requirements |
4.3.3 Competition from alternative technologies such as LiDAR and satellite imaging |
5 Slovenia Radar Market Trends |
6 Slovenia Radar Market Segmentations |
6.1 Slovenia Radar Market, By Component |
6.1.1 Overview and Analysis |
6.1.2 Slovenia Radar Market Revenues & Volume, By Antenna, 2022-2032F |
6.1.3 Slovenia Radar Market Revenues & Volume, By Transmitter, 2022-2032F |
6.1.4 Slovenia Radar Market Revenues & Volume, By Receiver, 2022-2032F |
6.1.5 Slovenia Radar Market Revenues & Volume, By Others, 2022-2032F |
6.2 Slovenia Radar Market, By Service |
6.2.1 Overview and Analysis |
6.2.2 Slovenia Radar Market Revenues & Volume, By Installation/Integration, 2022-2032F |
6.2.3 Slovenia Radar Market Revenues & Volume, By Support & Maintenance, 2022-2032F |
6.2.4 Slovenia Radar Market Revenues & Volume, By Training & Consulting, 2022-2032F |
6.3 Slovenia Radar Market, By Platform |
6.3.1 Overview and Analysis |
6.3.2 Slovenia Radar Market Revenues & Volume, By Ground-based, 2022-2032F |
6.3.3 Slovenia Radar Market Revenues & Volume, By Naval, 2022-2032F |
6.3.4 Slovenia Radar Market Revenues & Volume, By Airborne, 2022-2032F |
6.3.5 Slovenia Radar Market Revenues & Volume, By Space-based, 2022-2032F |
6.4 Slovenia Radar Market, By Frequency Band |
6.4.1 Overview and Analysis |
6.4.2 Slovenia Radar Market Revenues & Volume, By L-band, 2022-2032F |
6.4.3 Slovenia Radar Market Revenues & Volume, By S-band, 2022-2032F |
6.4.4 Slovenia Radar Market Revenues & Volume, By C-band, 2022-2032F |
6.4.5 Slovenia Radar Market Revenues & Volume, By X-band, 2022-2032F |
6.4.6 Slovenia Radar Market Revenues & Volume, By Ku-band, 2022-2032F |
6.4.7 Slovenia Radar Market Revenues & Volume, By Ka-band, 2022-2032F |
6.5 Slovenia Radar Market, By Range |
6.5.1 Overview and Analysis |
6.5.2 Slovenia Radar Market Revenues & Volume, By Long, 2022-2032F |
6.5.3 Slovenia Radar Market Revenues & Volume, By Medium, 2022-2032F |
6.5.4 Slovenia Radar Market Revenues & Volume, By Short, 2022-2032F |
6.6 Slovenia Radar Market, By End-Users |
6.6.1 Overview and Analysis |
6.6.2 Slovenia Radar Market Revenues & Volume, By Military Applications, 2022-2032F |
6.6.3 Slovenia Radar Market Revenues & Volume, By Air Traffic Control, 2022-2032F |
6.6.4 Slovenia Radar Market Revenues & Volume, By Remote Sensing, 2022-2032F |
6.6.5 Slovenia Radar Market Revenues & Volume, By Ground Traffic Control, 2022-2032F |
6.6.6 Slovenia Radar Market Revenues & Volume, By Others, 2022-2032F |
7 Slovenia Radar Market Import-Export Trade Statistics |
7.1 Slovenia Radar Market Export to Major Countries |
7.2 Slovenia Radar Market Imports from Major Countries |
8 Slovenia Radar Market Key Performance Indicators |
8.1 Number of research and development partnerships in radar technology |
8.2 Percentage of defense budget allocated to radar systems |
8.3 Rate of adoption of radar systems in critical infrastructure projects |
9 Slovenia Radar Market - Opportunity Assessment |
9.1 Slovenia Radar Market Opportunity Assessment, By Component, 2022 & 2032F |
9.2 Slovenia Radar Market Opportunity Assessment, By Service, 2022 & 2032F |
9.3 Slovenia Radar Market Opportunity Assessment, By Platform, 2022 & 2032F |
9.4 Slovenia Radar Market Opportunity Assessment, By Frequency Band, 2022 & 2032F |
9.5 Slovenia Radar Market Opportunity Assessment, By Range, 2022 & 2032F |
9.6 Slovenia Radar Market Opportunity Assessment, By End-Users, 2022 & 2032F |
10 Slovenia Radar Market - Competitive Landscape |
10.1 Slovenia Radar Market Revenue Share, By Companies, 2025 |
10.2 Slovenia Radar Market Competitive Benchmarking, By Operating and Technical Parameters |
11 Company Profiles |
12 Recommendations | 13 Disclaimer |
Export potential assessment - trade Analytics for 2030
Export potential enables firms to identify high-growth global markets with greater confidence by combining advanced trade intelligence with a structured quantitative methodology. The framework analyzes emerging demand trends and country-level import patterns while integrating macroeconomic and trade datasets such as GDP and population forecasts, bilateral import–export flows, tariff structures, elasticity differentials between developed and developing economies, geographic distance, and import demand projections. Using weighted trade values from 2020–2024 as the base period to project country-to-country export potential for 2030, these inputs are operationalized through calculated drivers such as gravity model parameters, tariff impact factors, and projected GDP per-capita growth. Through an analysis of hidden potentials, demand hotspots, and market conditions that are most favorable to success, this method enables firms to focus on target countries, maximize returns, and global expansion with data, backed by accuracy.
By factoring in the projected importer demand gap that is currently unmet and could be potential opportunity, it identifies the potential for the Exporter (Country) among 190 countries, against the general trade analysis, which identifies the biggest importer or exporter.
To discover high-growth global markets and optimize your business strategy:
Click Here
Pricing
- Single User License$ 1,995
- Department License$ 2,400
- Site License$ 3,120
- Global License$ 3,795

Search
Thought Leadership and Analyst Meet


Our Clients
Latest Reports
- Canada Cloud CFD Market (2026-2032) | Size & Revenue, Industry, Growth, Competitive Landscape, Forecast, Segmentation, Value, Outlook, Trends, Share, Analysis, Companies
- Taiwan Food Delivery Platform Market (2026-2032) | Companies, Outlook, Analysis, Trends, Value, Revenue, Segmentation, Share, Forecast, Competitive Landscape, Growth, Size & Forecast
- United Kingdom (UK) Long-term Care Insurance Market (2026-2032) | Growth, Share, Consumer Insights, Drivers, Opportunities, Competition, Pricing Analysis, Segments, Restraints, Companies, Competitive, Value, Outlook, Size, Demand, Analysis, Challenges, Strategic Insights, Investment Trends, Revenue, Trends, Supply, Forecast
- United Kingdom (UK) Long Term Care Market (2026-2032) | Companies, Outlook, Analysis, Trends, Value, Revenue, Segmentation, Share, Forecast, Competitive Landscape, Growth, Size & Forecast
- Iraq Insulation and Waterproofing Market (2026-2032) | Outlook, Drivers, Growth, Size, Share, Industry, Revenue, Trends, Demand, Competitive, Strategic Insights, Opportunities, Segments, Companies, Challenges, Strategy, Consumer Insights, Analysis, Investment Trends, Value, Segmentation, Forecast, Restraints
- India Switchgear Market Outlook (2026-2032) | Size, Share, Trends, Growth, Revenue, Forecast, Analysis, Value, Outlook
- Pakistan Contraceptive Implants Market (2025-2031) | Demand, Growth, Size, Share, Industry, Pricing Analysis, Competitive, Strategic Insights, Strategy, Consumer Insights, Analysis, Investment Trends, Opportunities, Revenue, Segments, Value, Segmentation, Supply, Forecast, Restraints, Outlook, Competition, Drivers, Trends, Companies, Challenges
- Sri Lanka Packaging Market (2026-2032) | Outlook, Competition, Drivers, Trends, Demand, Pricing Analysis, Competitive, Strategic Insights, Companies, Challenges, Strategy, Consumer Insights, Analysis, Investment Trends, Opportunities, Growth, Size, Share, Industry, Revenue, Segments, Value, Segmentation, Supply, Forecast, Restraints
- India Kids Watches Market (2026-2032) | Strategy, Consumer Insights, Analysis, Investment Trends, Opportunities, Growth, Size, Share, Industry, Revenue, Segments, Value, Segmentation, Supply, Forecast, Restraints, Outlook, Competition, Drivers, Trends, Demand, Pricing Analysis, Competitive, Strategic Insights, Companies, Challenges
- Saudi Arabia Core Assurance Service Market (2025-2031) | Strategy, Consumer Insights, Analysis, Investment Trends, Opportunities, Growth, Size, Share, Industry, Revenue, Segments, Value, Segmentation, Supply, Forecast, Restraints, Outlook, Competition, Drivers, Trends, Demand, Pricing Analysis, Competitive, Strategic Insights, Companies, Challenges
Industry Events and Analyst Meet

India EV Show 2026

EV tech India Expo 2026

Auto Tech Asia 2026

Battery Tech India 2026

Smart Production Solutions Guangzhou 2026
Whitepaper
- Middle East & Africa Commercial Security Market Click here to view more.
- Middle East & Africa Fire Safety Systems & Equipment Market Click here to view more.
- GCC Drone Market Click here to view more.
- Middle East Lighting Fixture Market Click here to view more.
- GCC Physical & Perimeter Security Market Click here to view more.
6WResearch In News
- Doha a strategic location for EV manufacturing hub: IPA Qatar
- Demand for luxury TVs surging in the GCC, says Samsung
- Empowering Growth: The Thriving Journey of Bangladesh’s Cable Industry
- Demand for luxury TVs surging in the GCC, says Samsung
- Video call with a traditional healer? Once unthinkable, it’s now common in South Africa
- Intelligent Buildings To Smooth GCC’s Path To Net Zero