Slovenia Stable Isotope Labeled Compound Market (2026-2032) | Segmentation, Companies, Value, Competitive Landscape, Forecast, Growth, Size & Revenue, Outlook, Analysis, Industry, Share, Trends
Market Forecast By Type (Deuterium, Carbon 12 & 13, Nitrogen 15, Oxygen 16 & 18, Lithium 6 & 7, Sulphur 34, Chlorine 35 & 37), By Application (Research, Clinical Diagnostics, Industrial), By End User (Academic & Research, Institution, Hospital & Diagnostic Centers, Pharmaceutical & Biopharmaceutical Companies) And Competitive Landscape
| Product Code: ETC9328187 | Publication Date: Sep 2024 | Updated Date: Apr 2026 | Product Type: Market Research Report | |
| Publisher: 6Wresearch | Author: Summon Dutta | No. of Pages: 75 | No. of Figures: 35 | No. of Tables: 20 |
Slovenia Stable Isotope Labeled Compound Market Size (2020-2030)
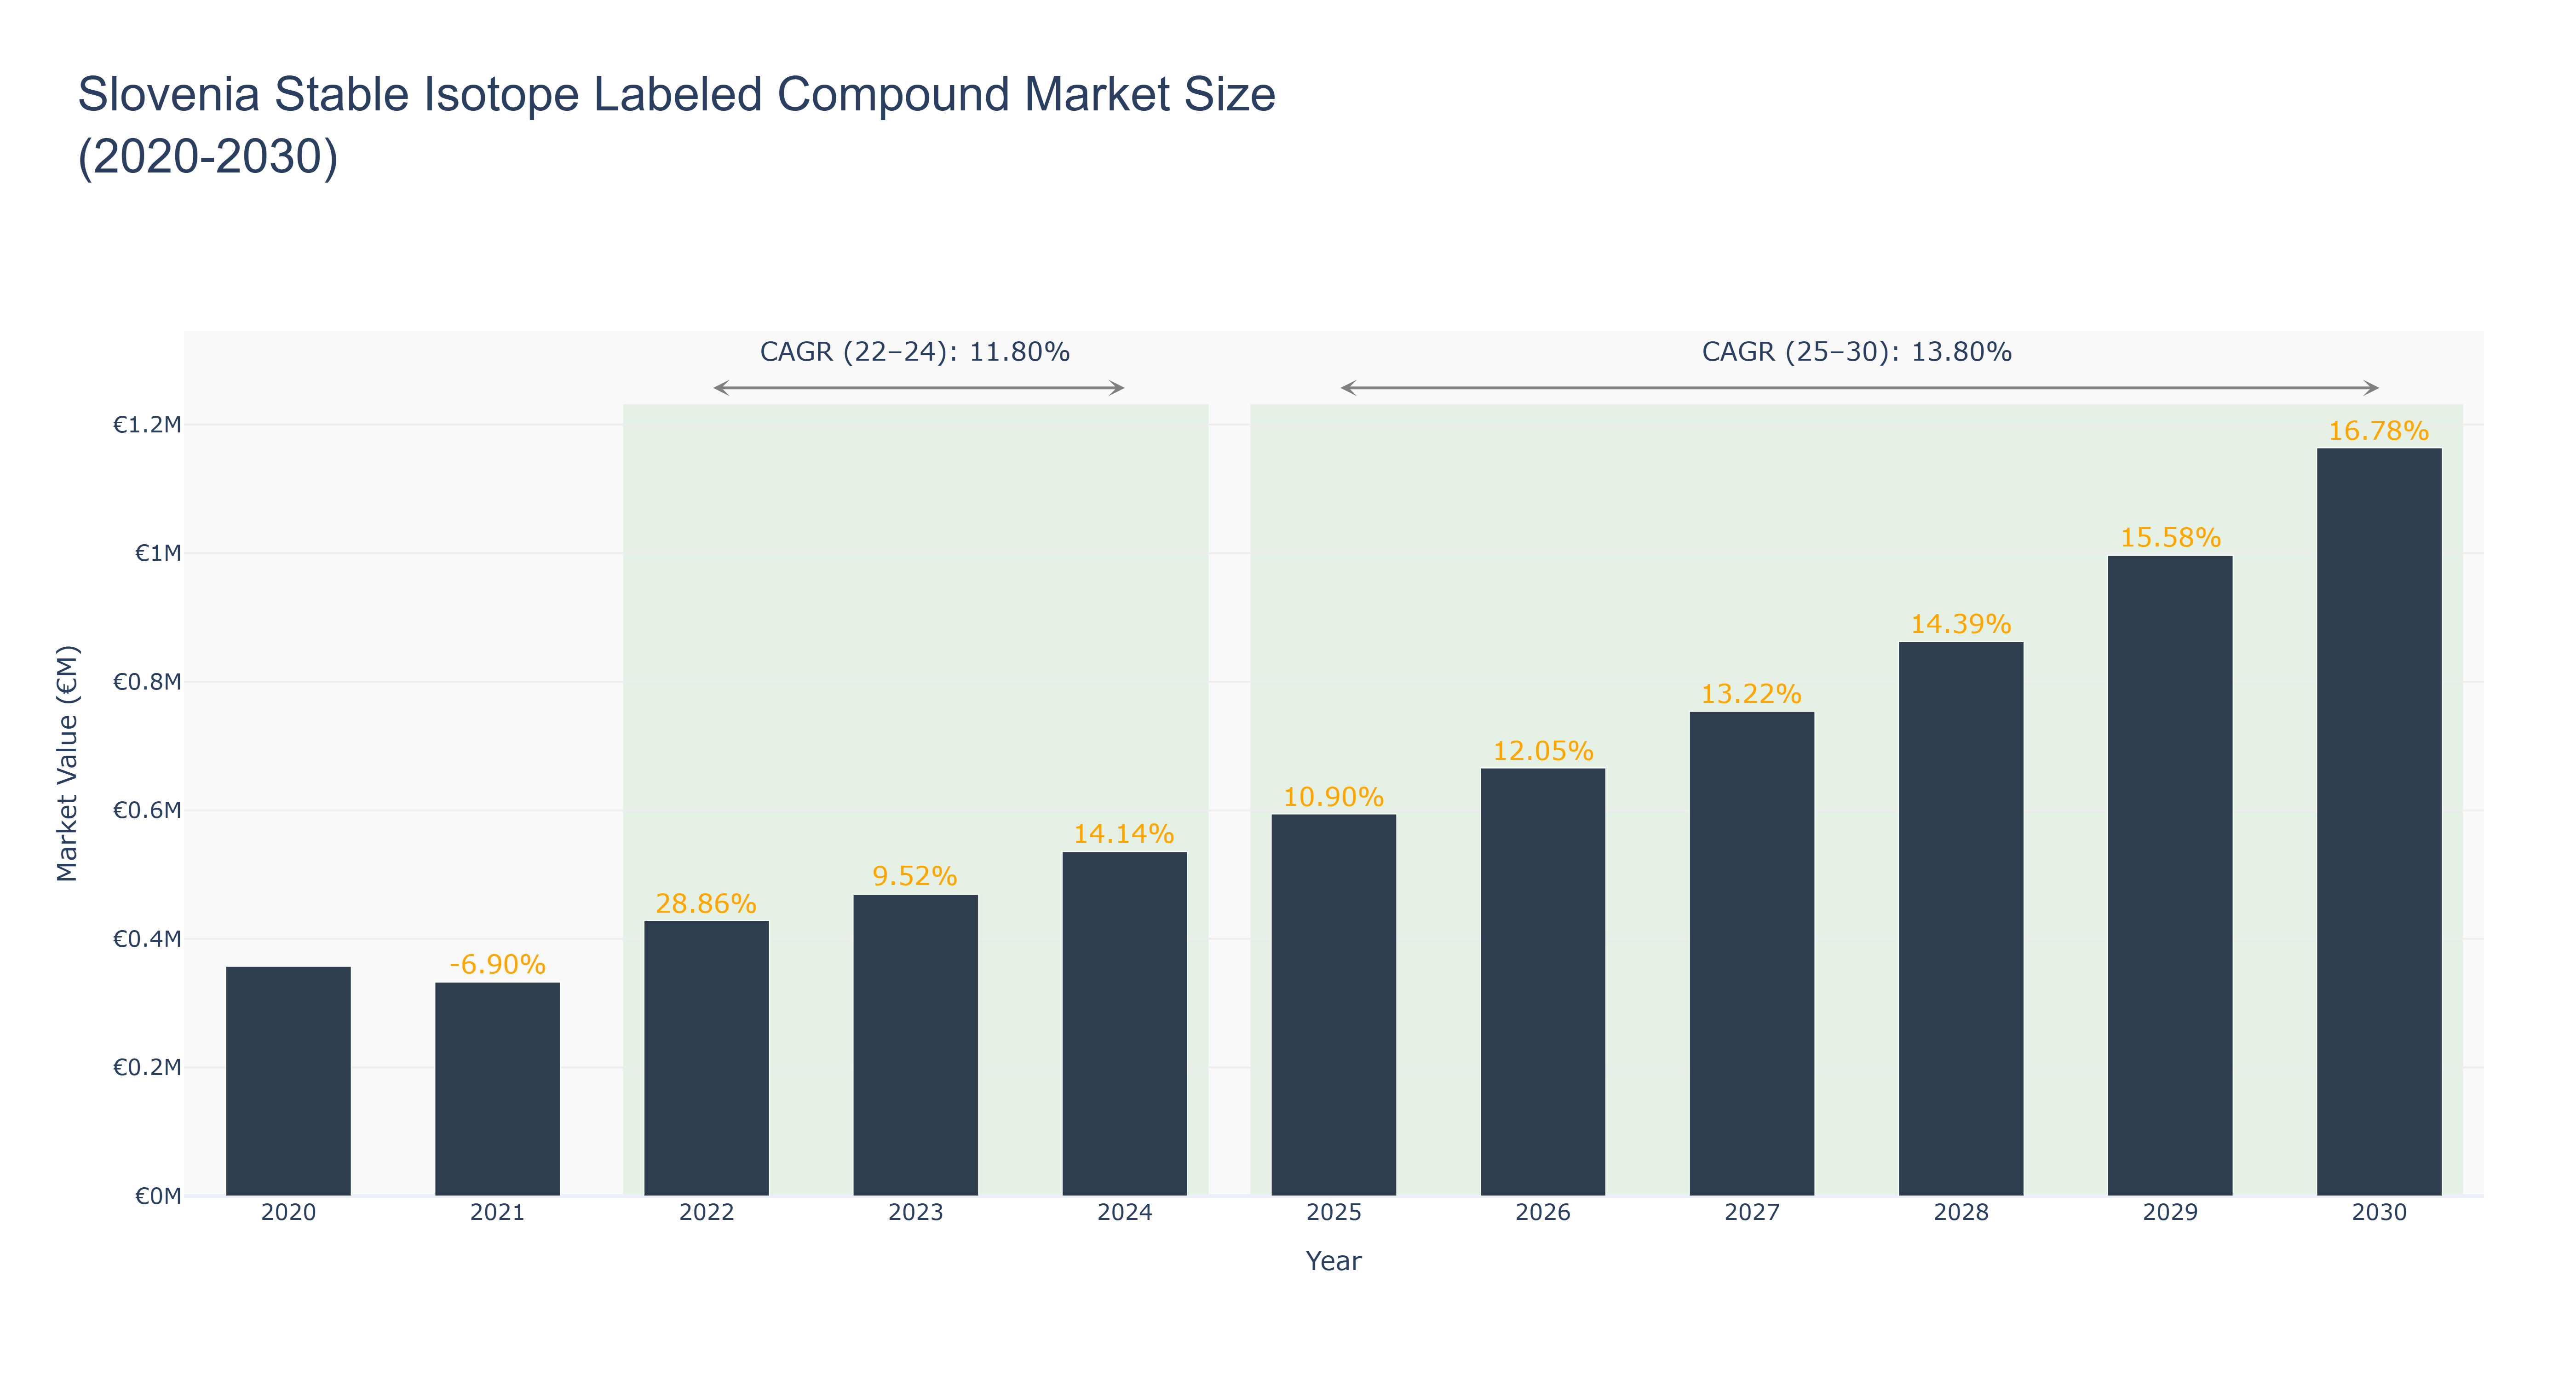
The Slovenia Stable Isotope Labeled Compound Market experienced steady growth from 2020 to 2024, reaching a peak market size of €0.54 million in 2024. The market is forecasted to continue its growth trajectory, with an expected market size of €1.16 million in 2030. The CAGR for the period 2022-24 is 11.80%, while for 2025-30, it is projected at 13.80%. The market's growth can be attributed to increasing demand for stable isotope-labeled compounds in pharmaceutical and research applications. Recent developments in the market include collaborations between research institutions and pharmaceutical companies to develop new labeled compounds for drug discovery purposes. Looking ahead, ongoing research projects aim to expand the application of stable isotope-labeled compounds in precision medicine, driving further market growth in the coming years.
Slovenia Stable Isotope Labeled Compound Market: Production & Trade Performance (2019-2025)
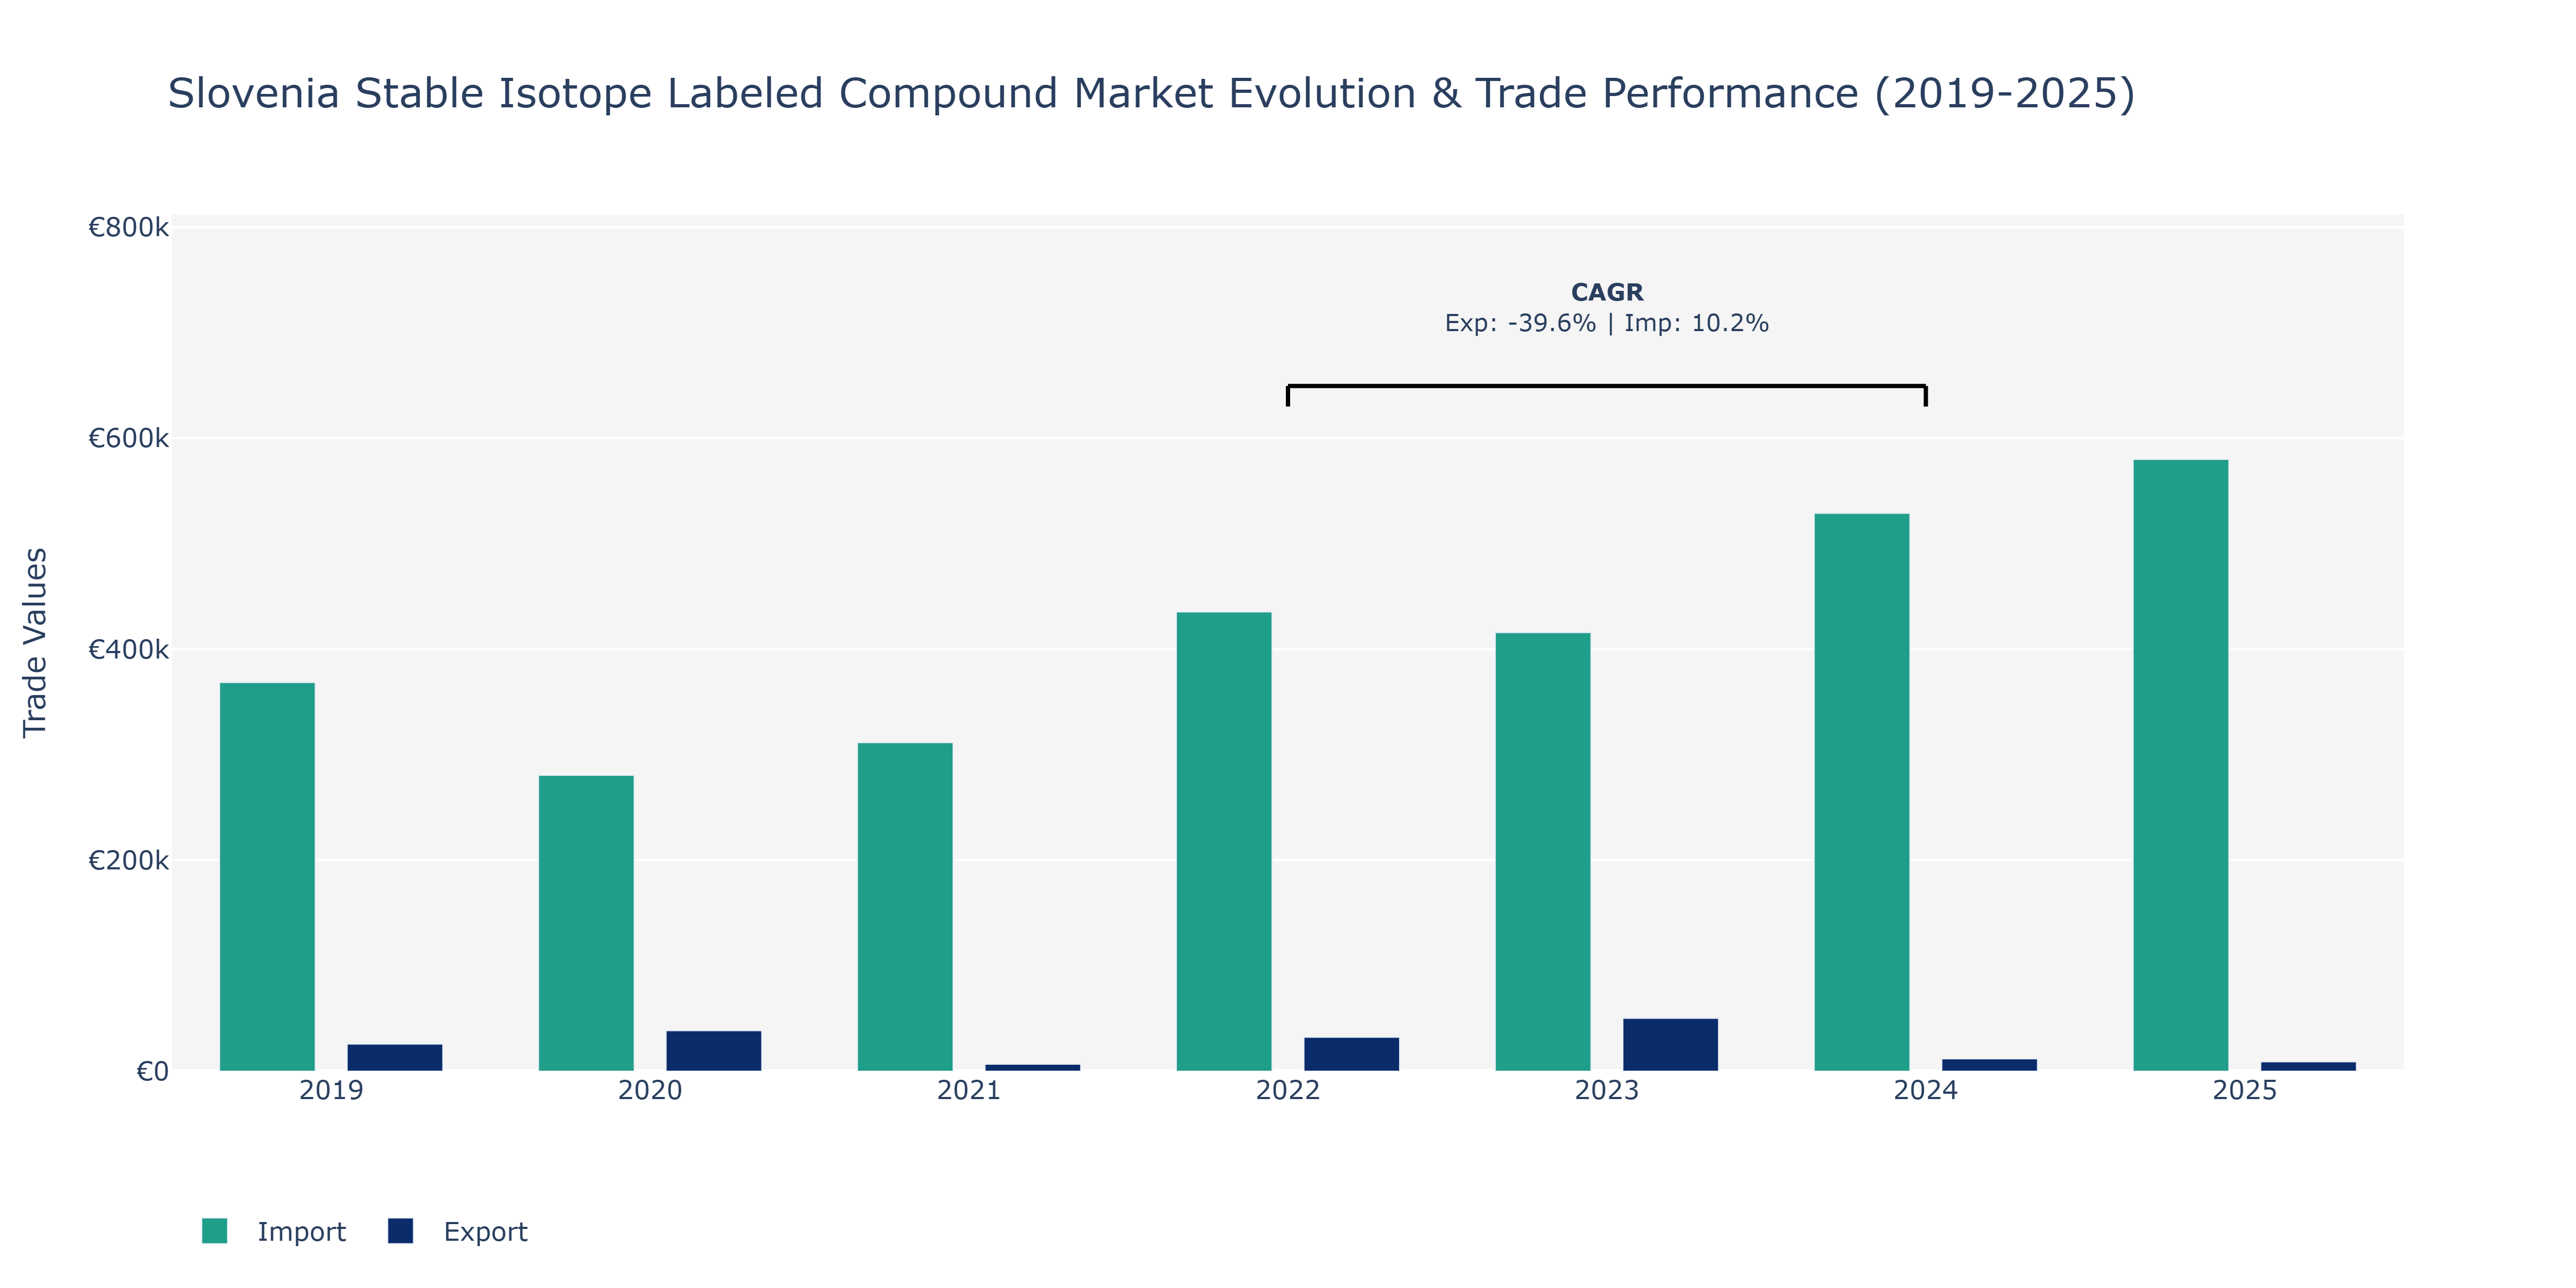
Between 2019 and 2025, Slovenia's Stable Isotope Labeled Compound Market exhibited notable fluctuations in exports and imports. In 2019, exports stood at €25.69 thousand, showing a substantial increase to €50.12 thousand in 2023 before decreasing to €8.85 thousand in 2025. Conversely, imports started at €368.5 thousand in 2019, peaked at €579.95 thousand in 2025, with some fluctuations in between. The peak in imports in 2025 could be attributed to increased demand for stable isotope-labeled compounds in various industries, such as pharmaceuticals, biotechnology, and scientific research. The fluctuations in exports might be influenced by global market dynamics and competition from other countries offering similar products at competitive prices. The negative CAGR in exports from 2022 to 2024 could be due to changes in trade policies or shifts in demand for specific isotopes. To sustain market growth, stakeholders in Slovenia's stable isotope market could focus on enhancing product quality, expanding market reach, and forming strategic partnerships with global players.
Key Highlights of the Report:
- Slovenia Stable Isotope Labeled Compound Market Outlook
- Market Size of Slovenia Stable Isotope Labeled Compound Market, 2025
- Forecast of Slovenia Stable Isotope Labeled Compound Market, 2032
- Historical Data and Forecast of Slovenia Stable Isotope Labeled Compound Revenues & Volume for the Period 2022-2032F
- Slovenia Stable Isotope Labeled Compound Market Trend Evolution
- Slovenia Stable Isotope Labeled Compound Market Drivers and Challenges
- Slovenia Stable Isotope Labeled Compound Price Trends
- Slovenia Stable Isotope Labeled Compound Porter's Five Forces
- Slovenia Stable Isotope Labeled Compound Industry Life Cycle
- Historical Data and Forecast of Slovenia Stable Isotope Labeled Compound Market Revenues & Volume By Type for the Period 2022-2032F
- Historical Data and Forecast of Slovenia Stable Isotope Labeled Compound Market Revenues & Volume By Deuterium for the Period 2022-2032F
- Historical Data and Forecast of Slovenia Stable Isotope Labeled Compound Market Revenues & Volume By Carbon 12 & 13 for the Period 2022-2032F
- Historical Data and Forecast of Slovenia Stable Isotope Labeled Compound Market Revenues & Volume By Nitrogen 15 for the Period 2022-2032F
- Historical Data and Forecast of Slovenia Stable Isotope Labeled Compound Market Revenues & Volume By Oxygen 16 & 18 for the Period 2022-2032F
- Historical Data and Forecast of Slovenia Stable Isotope Labeled Compound Market Revenues & Volume By Lithium 6 & 7 for the Period 2022-2032F
- Historical Data and Forecast of Slovenia Stable Isotope Labeled Compound Market Revenues & Volume By Sulphur 34 for the Period 2022-2032F
- Historical Data and Forecast of Slovenia Stable Isotope Labeled Compound Market Revenues & Volume By Chlorine 35 & 37 for the Period 2022-2032F
- Historical Data and Forecast of Slovenia Stable Isotope Labeled Compound Market Revenues & Volume By Application for the Period 2022-2032F
- Historical Data and Forecast of Slovenia Stable Isotope Labeled Compound Market Revenues & Volume By Research for the Period 2022-2032F
- Historical Data and Forecast of Slovenia Stable Isotope Labeled Compound Market Revenues & Volume By Clinical Diagnostics for the Period 2022-2032F
- Historical Data and Forecast of Slovenia Stable Isotope Labeled Compound Market Revenues & Volume By Industrial for the Period 2022-2032F
- Historical Data and Forecast of Slovenia Stable Isotope Labeled Compound Market Revenues & Volume By End User for the Period 2022-2032F
- Historical Data and Forecast of Slovenia Stable Isotope Labeled Compound Market Revenues & Volume By Academic & Research for the Period 2022-2032F
- Historical Data and Forecast of Slovenia Stable Isotope Labeled Compound Market Revenues & Volume By Institution for the Period 2022-2032F
- Historical Data and Forecast of Slovenia Stable Isotope Labeled Compound Market Revenues & Volume By Hospital & Diagnostic Centers for the Period 2022-2032F
- Historical Data and Forecast of Slovenia Stable Isotope Labeled Compound Market Revenues & Volume By Pharmaceutical & Biopharmaceutical Companies for the Period 2022-2032F
- Slovenia Stable Isotope Labeled Compound Import Export Trade Statistics
- Market Opportunity Assessment By Type
- Market Opportunity Assessment By Application
- Market Opportunity Assessment By End User
- Slovenia Stable Isotope Labeled Compound Top Companies Market Share
- Slovenia Stable Isotope Labeled Compound Competitive Benchmarking By Technical and Operational Parameters
- Slovenia Stable Isotope Labeled Compound Company Profiles
- Slovenia Stable Isotope Labeled Compound Key Strategic Recommendations
Frequently Asked Questions About the Market Study (FAQs):
6Wresearch actively monitors the Slovenia Stable Isotope Labeled Compound Market and publishes its comprehensive annual report, highlighting emerging trends, growth drivers, revenue analysis, and forecast outlook. Our insights help businesses to make data-backed strategic decisions with ongoing market dynamics. Our analysts track relevent industries related to the Slovenia Stable Isotope Labeled Compound Market, allowing our clients with actionable intelligence and reliable forecasts tailored to emerging regional needs.
Yes, we provide customisation as per your requirements. To learn more, feel free to contact us on sales@6wresearch.com
1 Executive Summary |
2 Introduction |
2.1 Key Highlights of the Report |
2.2 Report Description |
2.3 Market Scope & Segmentation |
2.4 Research Methodology |
2.5 Assumptions |
3 Slovenia Stable Isotope Labeled Compound Market Overview |
3.1 Slovenia Country Macro Economic Indicators |
3.2 Slovenia Stable Isotope Labeled Compound Market Revenues & Volume, 2022 & 2032F |
3.3 Slovenia Stable Isotope Labeled Compound Market - Industry Life Cycle |
3.4 Slovenia Stable Isotope Labeled Compound Market - Porter's Five Forces |
3.5 Slovenia Stable Isotope Labeled Compound Market Revenues & Volume Share, By Type, 2022 & 2032F |
3.6 Slovenia Stable Isotope Labeled Compound Market Revenues & Volume Share, By Application, 2022 & 2032F |
3.7 Slovenia Stable Isotope Labeled Compound Market Revenues & Volume Share, By End User, 2022 & 2032F |
4 Slovenia Stable Isotope Labeled Compound Market Dynamics |
4.1 Impact Analysis |
4.2 Market Drivers |
4.3 Market Restraints |
5 Slovenia Stable Isotope Labeled Compound Market Trends |
6 Slovenia Stable Isotope Labeled Compound Market, By Types |
6.1 Slovenia Stable Isotope Labeled Compound Market, By Type |
6.1.1 Overview and Analysis |
6.1.2 Slovenia Stable Isotope Labeled Compound Market Revenues & Volume, By Type, 2022-2032F |
6.1.3 Slovenia Stable Isotope Labeled Compound Market Revenues & Volume, By Deuterium, 2022-2032F |
6.1.4 Slovenia Stable Isotope Labeled Compound Market Revenues & Volume, By Carbon 12 & 13, 2022-2032F |
6.1.5 Slovenia Stable Isotope Labeled Compound Market Revenues & Volume, By Nitrogen 15, 2022-2032F |
6.1.6 Slovenia Stable Isotope Labeled Compound Market Revenues & Volume, By Oxygen 16 & 18, 2022-2032F |
6.1.7 Slovenia Stable Isotope Labeled Compound Market Revenues & Volume, By Lithium 6 & 7, 2022-2032F |
6.1.8 Slovenia Stable Isotope Labeled Compound Market Revenues & Volume, By Sulphur 34, 2022-2032F |
6.2 Slovenia Stable Isotope Labeled Compound Market, By Application |
6.2.1 Overview and Analysis |
6.2.2 Slovenia Stable Isotope Labeled Compound Market Revenues & Volume, By Research, 2022-2032F |
6.2.3 Slovenia Stable Isotope Labeled Compound Market Revenues & Volume, By Clinical Diagnostics, 2022-2032F |
6.2.4 Slovenia Stable Isotope Labeled Compound Market Revenues & Volume, By Industrial, 2022-2032F |
6.3 Slovenia Stable Isotope Labeled Compound Market, By End User |
6.3.1 Overview and Analysis |
6.3.2 Slovenia Stable Isotope Labeled Compound Market Revenues & Volume, By Academic & Research, 2022-2032F |
6.3.3 Slovenia Stable Isotope Labeled Compound Market Revenues & Volume, By Institution, 2022-2032F |
6.3.4 Slovenia Stable Isotope Labeled Compound Market Revenues & Volume, By Hospital & Diagnostic Centers, 2022-2032F |
6.3.5 Slovenia Stable Isotope Labeled Compound Market Revenues & Volume, By Pharmaceutical & Biopharmaceutical Companies, 2022-2032F |
7 Slovenia Stable Isotope Labeled Compound Market Import-Export Trade Statistics |
7.1 Slovenia Stable Isotope Labeled Compound Market Export to Major Countries |
7.2 Slovenia Stable Isotope Labeled Compound Market Imports from Major Countries |
8 Slovenia Stable Isotope Labeled Compound Market Key Performance Indicators |
9 Slovenia Stable Isotope Labeled Compound Market - Opportunity Assessment |
9.1 Slovenia Stable Isotope Labeled Compound Market Opportunity Assessment, By Type, 2022 & 2032F |
9.2 Slovenia Stable Isotope Labeled Compound Market Opportunity Assessment, By Application, 2022 & 2032F |
9.3 Slovenia Stable Isotope Labeled Compound Market Opportunity Assessment, By End User, 2022 & 2032F |
10 Slovenia Stable Isotope Labeled Compound Market - Competitive Landscape |
10.1 Slovenia Stable Isotope Labeled Compound Market Revenue Share, By Companies, 2025 |
10.2 Slovenia Stable Isotope Labeled Compound Market Competitive Benchmarking, By Operating and Technical Parameters |
11 Company Profiles |
12 Recommendations |
13 Disclaimer |
Export potential assessment - trade Analytics for 2030
Export potential enables firms to identify high-growth global markets with greater confidence by combining advanced trade intelligence with a structured quantitative methodology. The framework analyzes emerging demand trends and country-level import patterns while integrating macroeconomic and trade datasets such as GDP and population forecasts, bilateral import–export flows, tariff structures, elasticity differentials between developed and developing economies, geographic distance, and import demand projections. Using weighted trade values from 2020–2024 as the base period to project country-to-country export potential for 2030, these inputs are operationalized through calculated drivers such as gravity model parameters, tariff impact factors, and projected GDP per-capita growth. Through an analysis of hidden potentials, demand hotspots, and market conditions that are most favorable to success, this method enables firms to focus on target countries, maximize returns, and global expansion with data, backed by accuracy.
By factoring in the projected importer demand gap that is currently unmet and could be potential opportunity, it identifies the potential for the Exporter (Country) among 190 countries, against the general trade analysis, which identifies the biggest importer or exporter.
To discover high-growth global markets and optimize your business strategy:
Click Here
Pricing
- Single User License$ 1,995
- Department License$ 2,400
- Site License$ 3,120
- Global License$ 3,795

Search
Thought Leadership and Analyst Meet


Our Clients
Latest Reports
- Philippines Polyhydroxybutyrate-co-Hydroxyvalerate Market (2026-2032) | Trends, Insights, Challenges, Restraints, Competition, Size, Value, Forecast, Pricing, Share, Outlook, Revenue, Investment Opportunities, Strategy, Drivers, Demand, Growth, segmentation, Analysis, Companies
- Peru Polyhydroxybutyrate-co-Hydroxyvalerate Market (2026-2032) | Growth, Demand, Challenges, Share, Trends, Analysis, Pricing, Investment Opportunities, Drivers, Value, Forecast, Competition, Size, Companies, Insights, Outlook, Restraints, segmentation, Revenue, Strategy
- Pakistan Polyhydroxybutyrate-co-Hydroxyvalerate Market (2026-2032) | Restraints, segmentation, Pricing, Forecast, Share, Strategy, Competition, Trends, Insights, Drivers, Challenges, Growth, Revenue, Outlook, Value, Investment Opportunities, Companies, Size, Analysis, Demand
- Oman Polyhydroxybutyrate-co-Hydroxyvalerate Market (2026-2032) | Drivers, segmentation, Insights, Competition, Pricing, Outlook, Size, Revenue, Challenges, Forecast, Analysis, Growth, Value, Share, Trends, Investment Opportunities, Strategy, Restraints, Companies, Demand
- Nigeria Polyhydroxybutyrate-co-Hydroxyvalerate Market (2026-2032) | Value, Investment Opportunities, Analysis, Revenue, Restraints, Pricing, Outlook, Competition, Demand, Growth, Forecast, Companies, Trends, Challenges, segmentation, Drivers, Insights, Share, Size, Strategy
- Nepal Polyhydroxybutyrate-co-Hydroxyvalerate Market (2026-2032) | Insights, Analysis, Drivers, Share, Revenue, Demand, segmentation, Investment Opportunities, Competition, Forecast, Growth, Pricing, Companies, Strategy, Trends, Restraints, Challenges, Outlook, Size, Value
- Myanmar Polyhydroxybutyrate-co-Hydroxyvalerate Market (2026-2032) | Outlook, Revenue, Strategy, Restraints, Drivers, segmentation, Share, Forecast, Competition, Insights, Growth, Pricing, Size, Demand, Value, Companies, Trends, Challenges, Investment Opportunities, Analysis
- Morocco Polyhydroxybutyrate-co-Hydroxyvalerate Market (2026-2032) | Outlook, Investment Opportunities, Restraints, Strategy, Forecast, Challenges, Drivers, Growth, Companies, segmentation, Trends, Size, Competition, Revenue, Demand, Insights, Share, Analysis, Value, Pricing
- Mexico Polyhydroxybutyrate-co-Hydroxyvalerate Market (2026-2032) | Size, Drivers, Outlook, Share, Strategy, Growth, Pricing, Challenges, Companies, Demand, Value, Investment Opportunities, Restraints, Trends, Forecast, segmentation, Analysis, Insights, Competition, Revenue
- Malaysia Polyhydroxybutyrate-co-Hydroxyvalerate Market (2026-2032) | Share, segmentation, Size, Companies, Analysis, Insights, Forecast, Value, Revenue, Drivers, Restraints, Challenges, Investment Opportunities, Trends, Competition, Strategy, Demand, Growth, Outlook, Pricing
Industry Events and Analyst Meet

HIMTEX 2026

India Refining Summit 2026

India EV Show 2026

EV tech India Expo 2026

Auto Tech Asia 2026
Whitepaper
- Middle East & Africa Commercial Security Market Click here to view more.
- Middle East & Africa Fire Safety Systems & Equipment Market Click here to view more.
- GCC Drone Market Click here to view more.
- Middle East Lighting Fixture Market Click here to view more.
- GCC Physical & Perimeter Security Market Click here to view more.
6WResearch In News
- Doha a strategic location for EV manufacturing hub: IPA Qatar
- Demand for luxury TVs surging in the GCC, says Samsung
- Empowering Growth: The Thriving Journey of Bangladesh’s Cable Industry
- Demand for luxury TVs surging in the GCC, says Samsung
- Video call with a traditional healer? Once unthinkable, it’s now common in South Africa
- Intelligent Buildings To Smooth GCC’s Path To Net Zero