Slovenia Technical Glass Market (2026-2032) | Segments, Competition, Opportunities, Outlook, Industry, Forecast, Value, Demand, Supply, Segmentation, Consumer Insights, Trends, Restraints, Pricing Analysis, Strategy, Share, Size, Revenue, Strategic Insights, Competitive, Growth, Analysis, Investment Trends, Companies, Drivers, Challenges
Market Forecast By Product Type (Borosilicate Glass, Aluminosilicate Glass, Fused Quartz), By Material Type (SilicaBased, MetalOxide Based, Pure Silica), By Application (Optical Lenses, Display Screens, Laboratory Equipment), By Property (High Heat Resistance, Scratch Resistance, Chemical Stability), By End Use (Electronics, Automotive, Healthcare) And Competitive Landscape
| Product Code: ETC10903524 | Publication Date: Apr 2025 | Updated Date: Apr 2026 | Product Type: Market Research Report | |
| Publisher: 6Wresearch | No. of Pages: 65 | No. of Figures: 34 | No. of Tables: 19 | |
Slovenia Technical Glass Market Size (2020-2030)
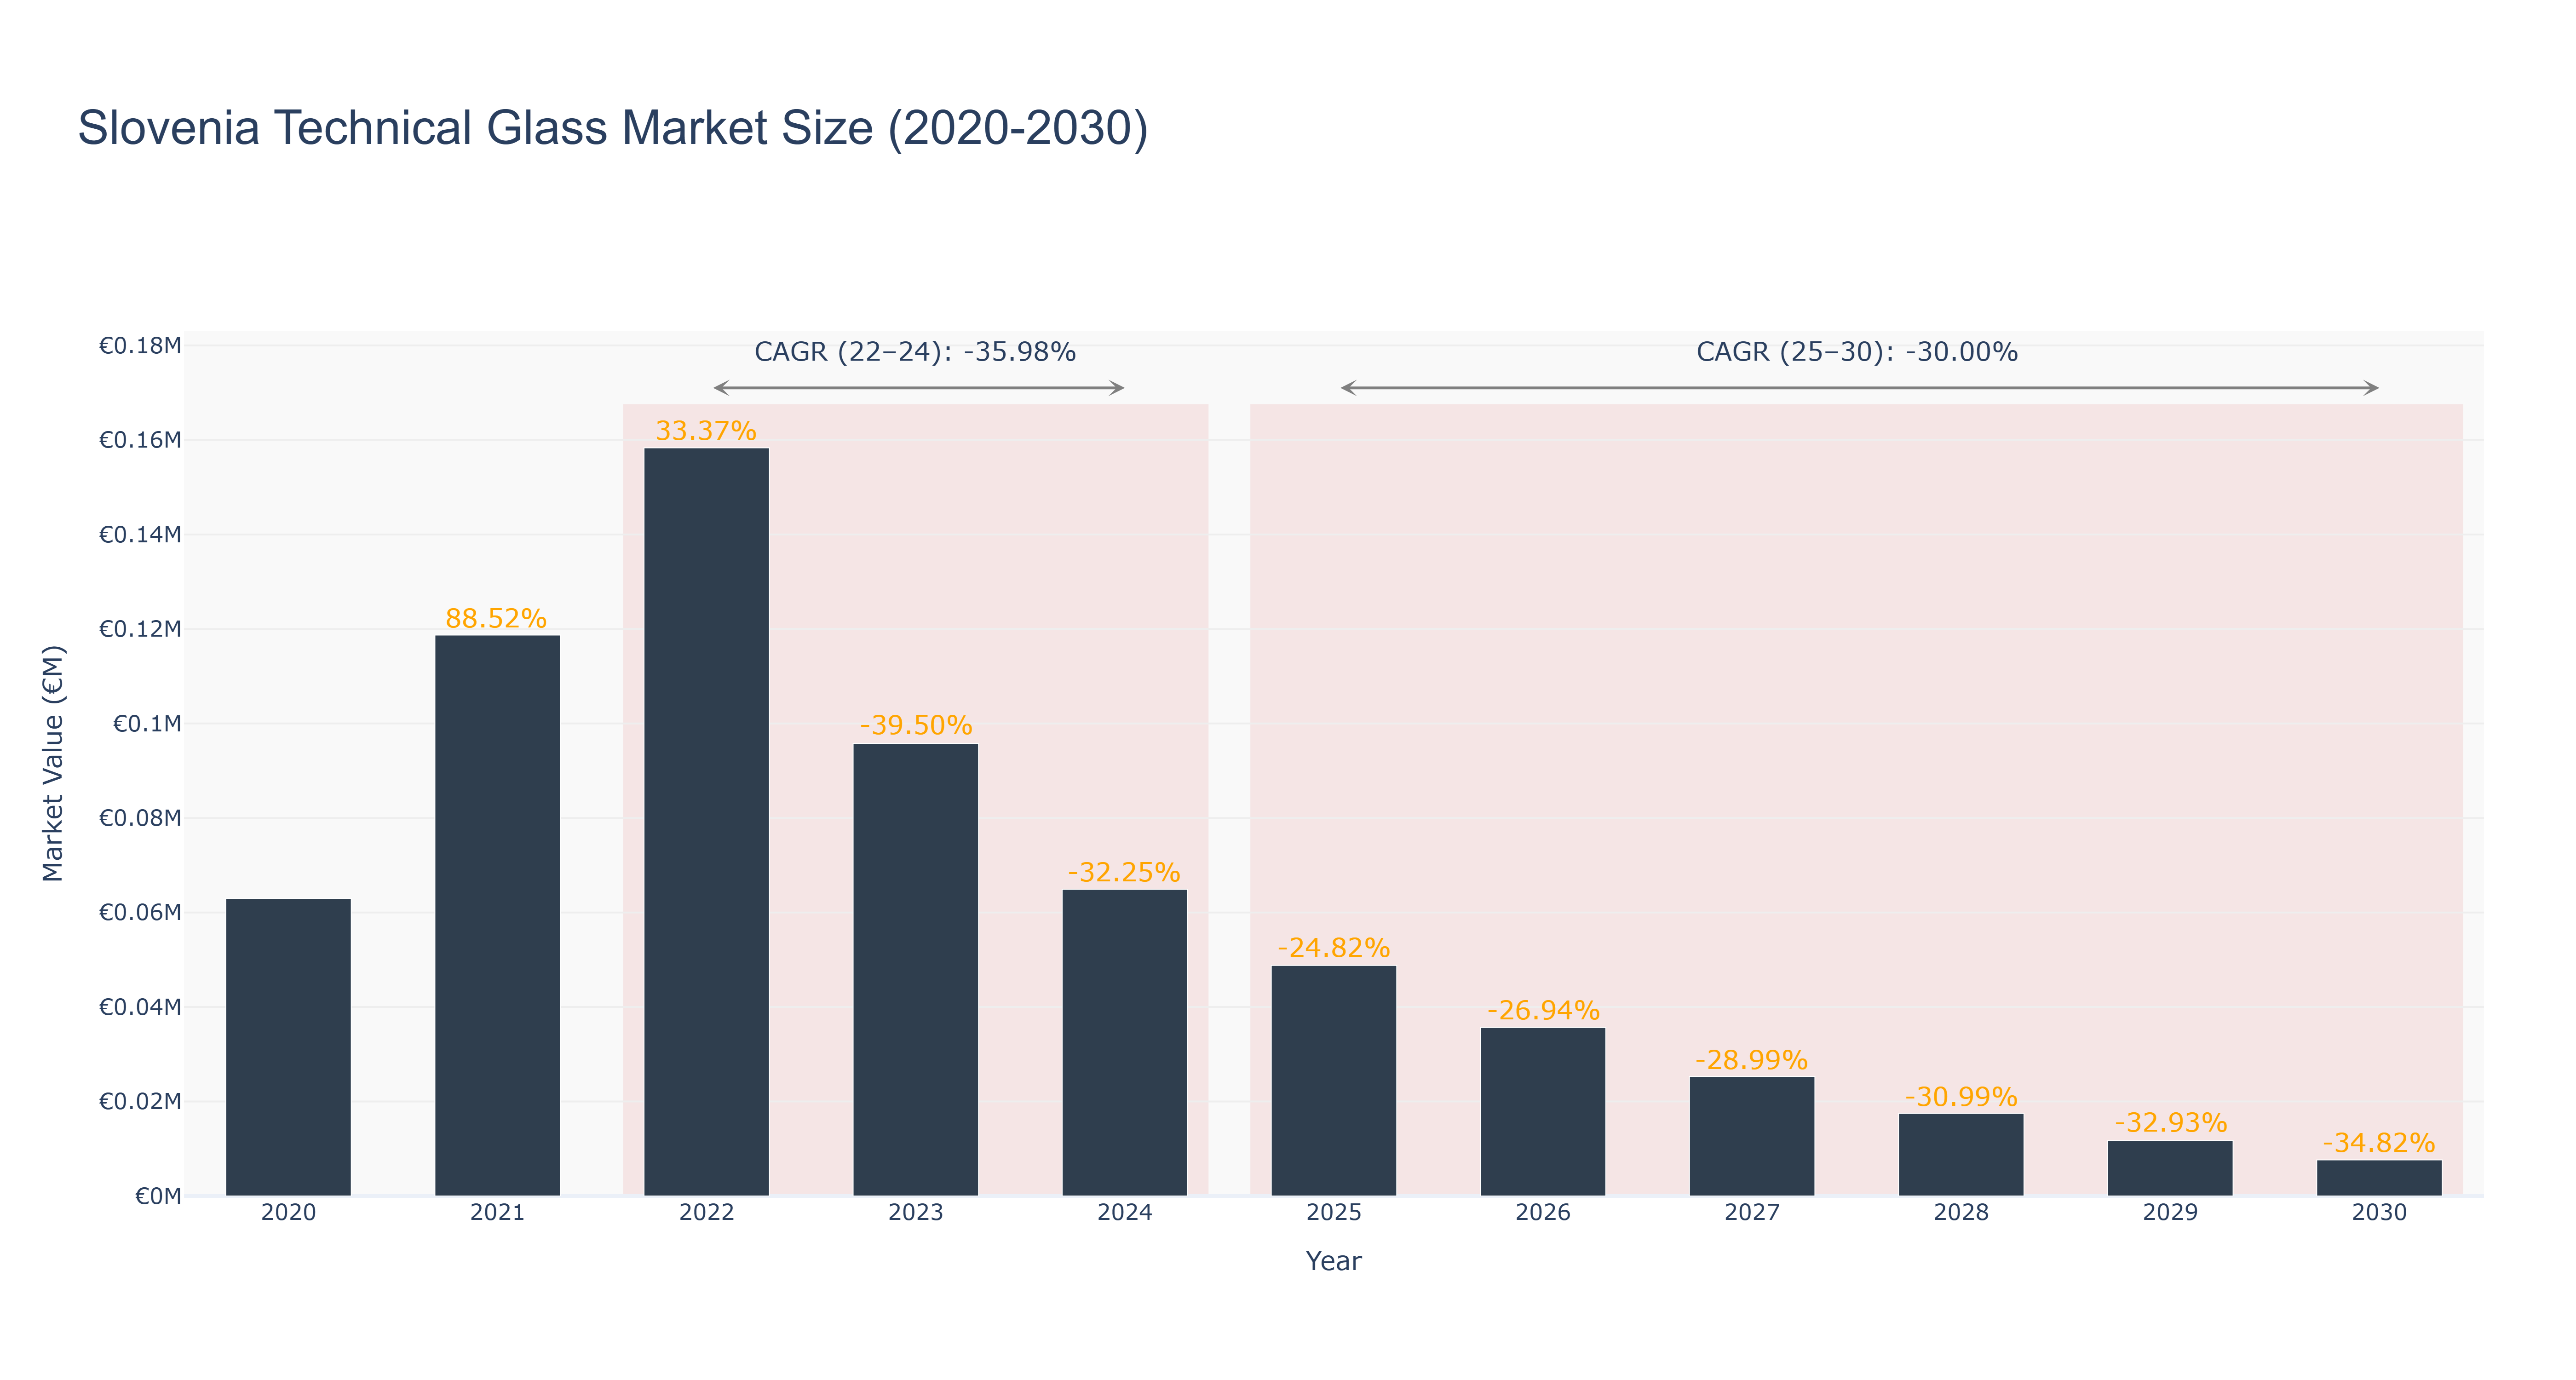
The Slovenia Technical Glass Market experienced a peak size of €0.16 million in 2022, followed by a decline to €0.05 million in 2025. The market is projected to further decrease to €0.01 million by 2030, with a CAGR of -30.0% from 2025 to 2030. The significant downturn in market size can be attributed to various factors such as economic slowdown, reduced construction activities, and shifting consumer preferences towards alternative materials. Despite the challenging market conditions, recent developments in sustainable glass technologies and upcoming infrastructure projects focusing on energy-efficient buildings are expected to drive future growth in the Slovenia Technical Glass Market. Industry drivers such as environmental sustainability and technological advancements will play a crucial role in shaping the market's trajectory in the coming years.
Slovenia Technical Glass Market: Production & Trade Performance (2019-2025)
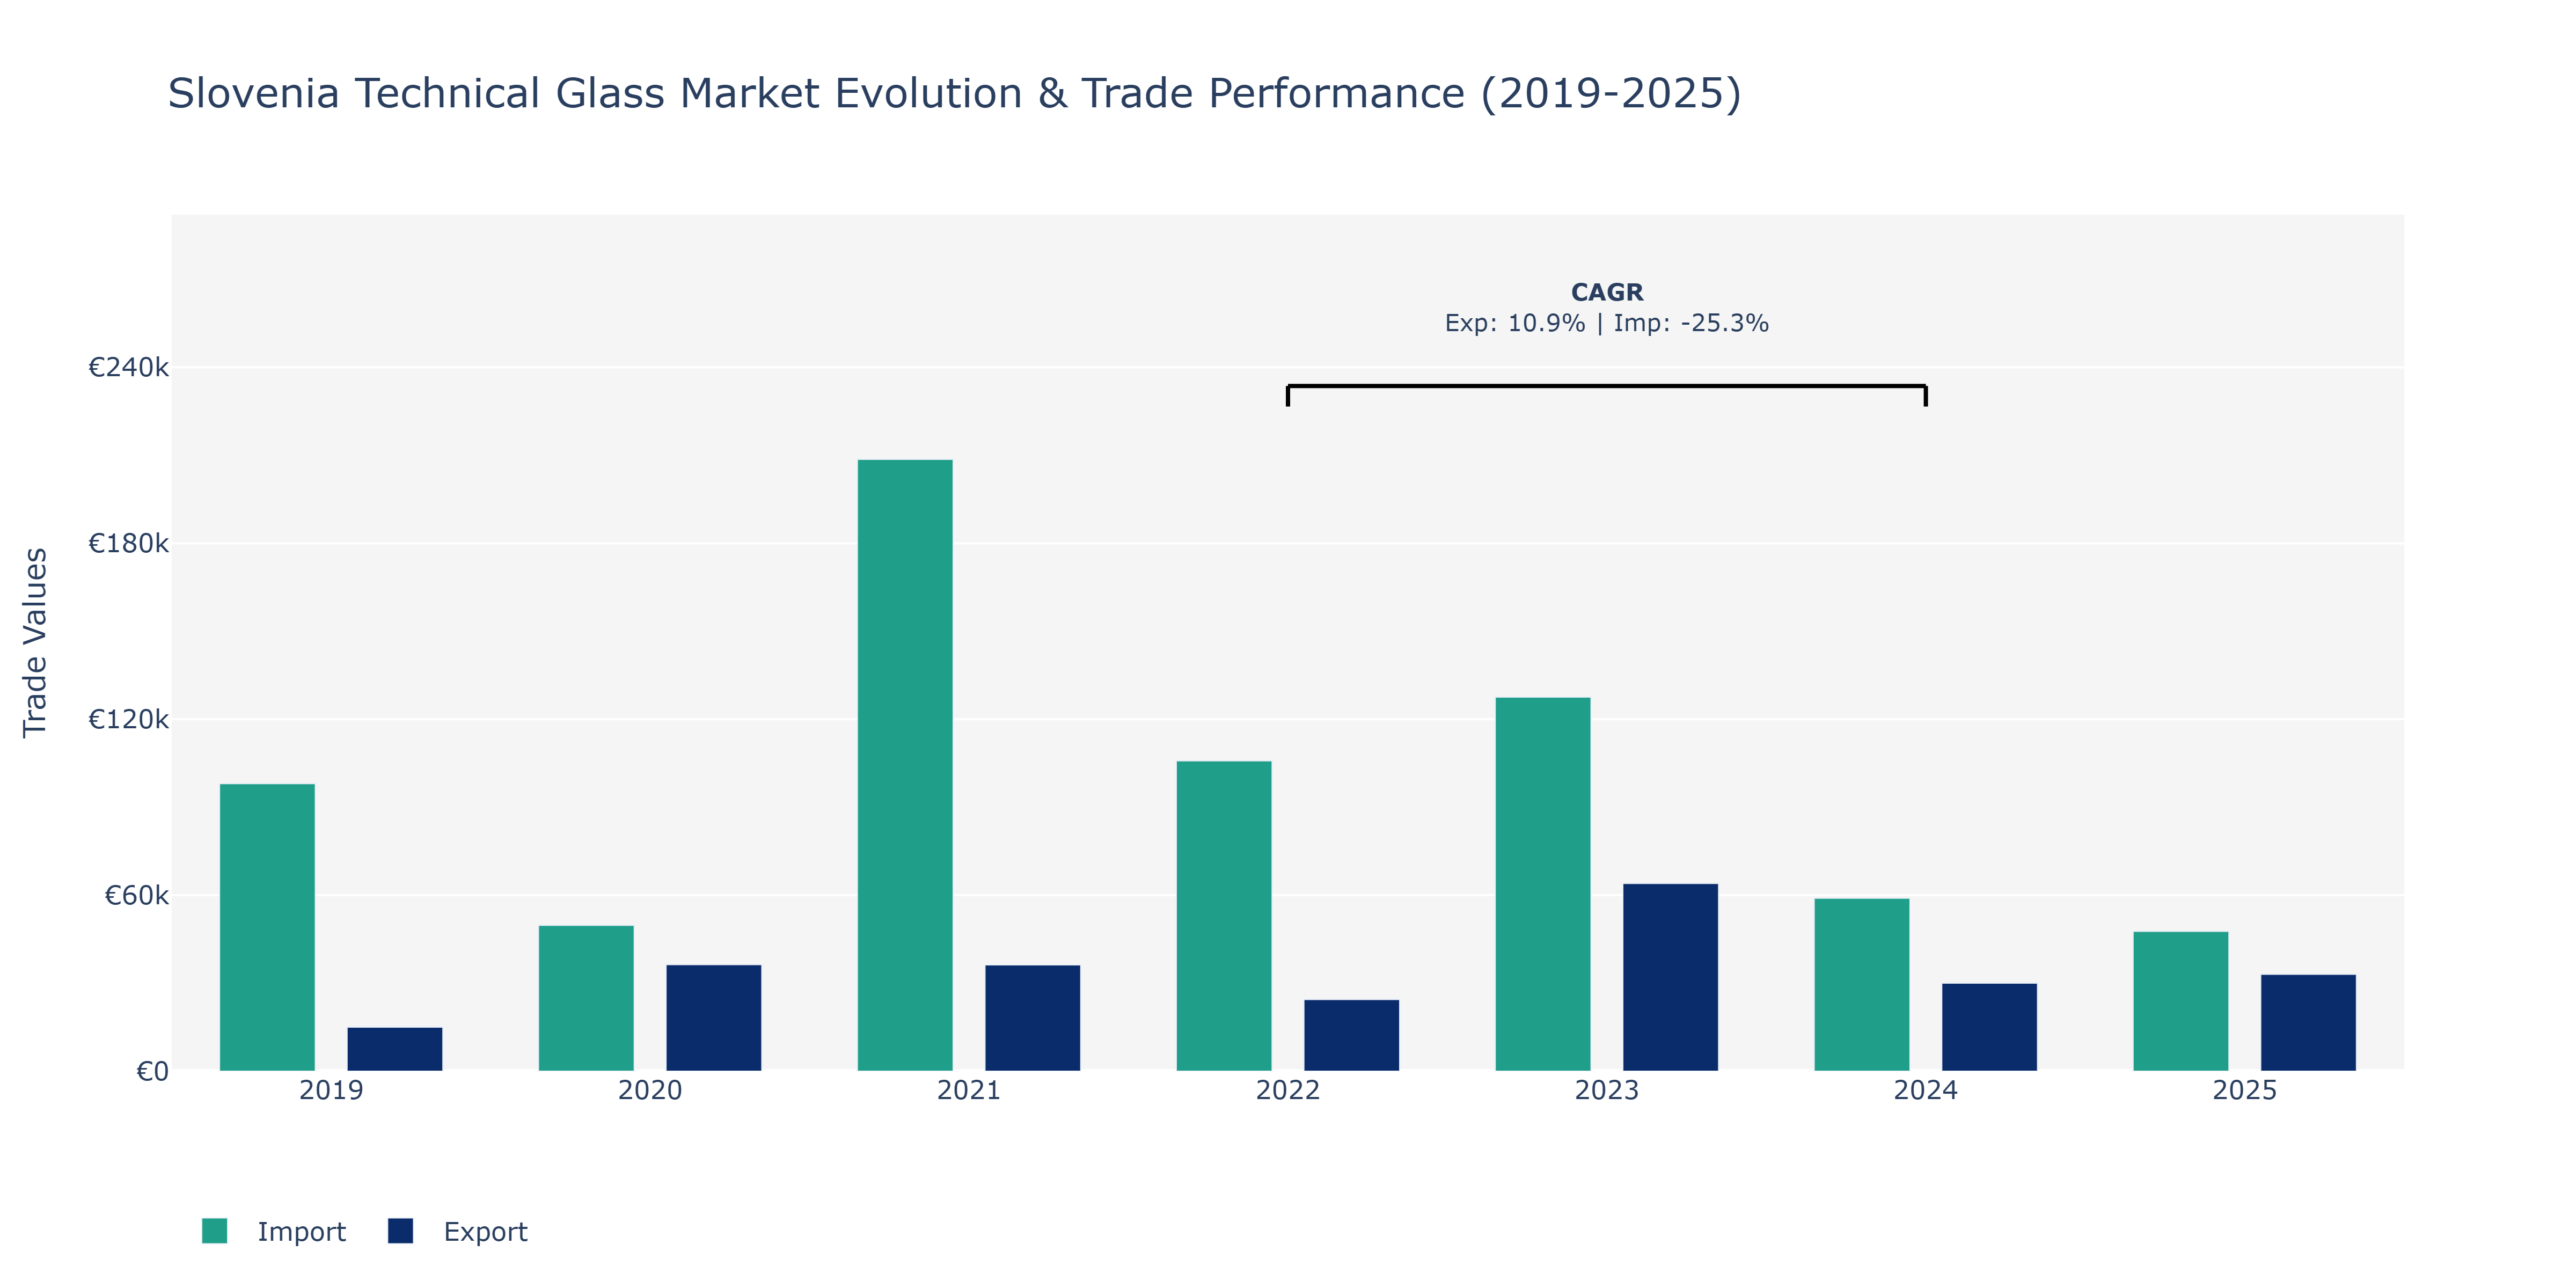
The Slovenia Technical Glass Market saw fluctuations in both Exports and Imports from 2019 to 2025. Exports started at €15.01 thousand in 2019, peaked at €64.01 thousand in 2023, and then decreased to €33.05 thousand in 2025. This decline could be attributed to changing demand patterns or competitive pressures within the global technical glass sector. Imports, on the other hand, began at €98.03 thousand in 2019, dropped to €47.69 thousand in 2025, showing a fluctuating trend. The significant peak in imports in 2021 at €208.62 thousand could be due to increased domestic infrastructure projects or a surge in local manufacturing demand for technical glass products. The subsequent decline might suggest stabilization in demand or changes in sourcing strategies by local businesses. Such movements in exports and imports indicate the market's sensitivity to economic conditions, technological advancements, and global trade dynamics, emphasizing the importance of adaptability for stakeholders in the Slovenia Technical Glass Market.
Key Highlights of the Report:
- Slovenia Technical Glass Market Outlook
- Market Size of Slovenia Technical Glass Market, 2025
- Forecast of Slovenia Technical Glass Market, 2032
- Historical Data and Forecast of Slovenia Technical Glass Revenues & Volume for the Period 2022-2032F
- Slovenia Technical Glass Market Trend Evolution
- Slovenia Technical Glass Market Drivers and Challenges
- Slovenia Technical Glass Price Trends
- Slovenia Technical Glass Porter's Five Forces
- Slovenia Technical Glass Industry Life Cycle
- Historical Data and Forecast of Slovenia Technical Glass Market Revenues & Volume By Product Type for the Period 2022-2032F
- Historical Data and Forecast of Slovenia Technical Glass Market Revenues & Volume By Borosilicate Glass for the Period 2022-2032F
- Historical Data and Forecast of Slovenia Technical Glass Market Revenues & Volume By Aluminosilicate Glass for the Period 2022-2032F
- Historical Data and Forecast of Slovenia Technical Glass Market Revenues & Volume By Fused Quartz for the Period 2022-2032F
- Historical Data and Forecast of Slovenia Technical Glass Market Revenues & Volume By Material Type for the Period 2022-2032F
- Historical Data and Forecast of Slovenia Technical Glass Market Revenues & Volume By SilicaBased for the Period 2022-2032F
- Historical Data and Forecast of Slovenia Technical Glass Market Revenues & Volume By MetalOxide Based for the Period 2022-2032F
- Historical Data and Forecast of Slovenia Technical Glass Market Revenues & Volume By Pure Silica for the Period 2022-2032F
- Historical Data and Forecast of Slovenia Technical Glass Market Revenues & Volume By Application for the Period 2022-2032F
- Historical Data and Forecast of Slovenia Technical Glass Market Revenues & Volume By Optical Lenses for the Period 2022-2032F
- Historical Data and Forecast of Slovenia Technical Glass Market Revenues & Volume By Display Screens for the Period 2022-2032F
- Historical Data and Forecast of Slovenia Technical Glass Market Revenues & Volume By Laboratory Equipment for the Period 2022-2032F
- Historical Data and Forecast of Slovenia Technical Glass Market Revenues & Volume By Property for the Period 2022-2032F
- Historical Data and Forecast of Slovenia Technical Glass Market Revenues & Volume By High Heat Resistance for the Period 2022-2032F
- Historical Data and Forecast of Slovenia Technical Glass Market Revenues & Volume By Scratch Resistance for the Period 2022-2032F
- Historical Data and Forecast of Slovenia Technical Glass Market Revenues & Volume By Chemical Stability for the Period 2022-2032F
- Historical Data and Forecast of Slovenia Technical Glass Market Revenues & Volume By End Use for the Period 2022-2032F
- Historical Data and Forecast of Slovenia Technical Glass Market Revenues & Volume By Electronics for the Period 2022-2032F
- Historical Data and Forecast of Slovenia Technical Glass Market Revenues & Volume By Automotive for the Period 2022-2032F
- Historical Data and Forecast of Slovenia Technical Glass Market Revenues & Volume By Healthcare for the Period 2022-2032F
- Slovenia Technical Glass Import Export Trade Statistics
- Market Opportunity Assessment By Product Type
- Market Opportunity Assessment By Material Type
- Market Opportunity Assessment By Application
- Market Opportunity Assessment By Property
- Market Opportunity Assessment By End Use
- Slovenia Technical Glass Top Companies Market Share
- Slovenia Technical Glass Competitive Benchmarking By Technical and Operational Parameters
- Slovenia Technical Glass Company Profiles
- Slovenia Technical Glass Key Strategic Recommendations
Frequently Asked Questions About the Market Study (FAQs):
6Wresearch actively monitors the Slovenia Technical Glass Market and publishes its comprehensive annual report, highlighting emerging trends, growth drivers, revenue analysis, and forecast outlook. Our insights help businesses to make data-backed strategic decisions with ongoing market dynamics. Our analysts track relevent industries related to the Slovenia Technical Glass Market, allowing our clients with actionable intelligence and reliable forecasts tailored to emerging regional needs.
Yes, we provide customisation as per your requirements. To learn more, feel free to contact us on sales@6wresearch.com
1 Executive Summary |
2 Introduction |
2.1 Key Highlights of the Report |
2.2 Report Description |
2.3 Market Scope & Segmentation |
2.4 Research Methodology |
2.5 Assumptions |
3 Slovenia Technical Glass Market Overview |
3.1 Slovenia Country Macro Economic Indicators |
3.2 Slovenia Technical Glass Market Revenues & Volume, 2022 & 2032F |
3.3 Slovenia Technical Glass Market - Industry Life Cycle |
3.4 Slovenia Technical Glass Market - Porter's Five Forces |
3.5 Slovenia Technical Glass Market Revenues & Volume Share, By Product Type, 2022 & 2032F |
3.6 Slovenia Technical Glass Market Revenues & Volume Share, By Material Type, 2022 & 2032F |
3.7 Slovenia Technical Glass Market Revenues & Volume Share, By Application, 2022 & 2032F |
3.8 Slovenia Technical Glass Market Revenues & Volume Share, By Property, 2022 & 2032F |
3.9 Slovenia Technical Glass Market Revenues & Volume Share, By End Use, 2022 & 2032F |
4 Slovenia Technical Glass Market Dynamics |
4.1 Impact Analysis |
4.2 Market Drivers |
4.2.1 Growing demand for energy-efficient buildings and infrastructure, leading to increased use of technical glass in construction projects. |
4.2.2 Advancements in the automotive industry, driving the demand for technical glass components in vehicles. |
4.2.3 Increasing adoption of smart technologies in various industries, creating opportunities for technical glass applications in sensors and displays. |
4.3 Market Restraints |
4.3.1 Fluctuating raw material prices impacting the cost of production for technical glass manufacturers. |
4.3.2 Intense competition in the market leading to pricing pressures and reduced profit margins. |
4.3.3 Government regulations and standards influencing the use of technical glass in certain applications. |
5 Slovenia Technical Glass Market Trends |
6 Slovenia Technical Glass Market, By Types |
6.1 Slovenia Technical Glass Market, By Product Type |
6.1.1 Overview and Analysis |
6.1.2 Slovenia Technical Glass Market Revenues & Volume, By Product Type, 2022 - 2032F |
6.1.3 Slovenia Technical Glass Market Revenues & Volume, By Borosilicate Glass, 2022 - 2032F |
6.1.4 Slovenia Technical Glass Market Revenues & Volume, By Aluminosilicate Glass, 2022 - 2032F |
6.1.5 Slovenia Technical Glass Market Revenues & Volume, By Fused Quartz, 2022 - 2032F |
6.2 Slovenia Technical Glass Market, By Material Type |
6.2.1 Overview and Analysis |
6.2.2 Slovenia Technical Glass Market Revenues & Volume, By SilicaBased, 2022 - 2032F |
6.2.3 Slovenia Technical Glass Market Revenues & Volume, By MetalOxide Based, 2022 - 2032F |
6.2.4 Slovenia Technical Glass Market Revenues & Volume, By Pure Silica, 2022 - 2032F |
6.3 Slovenia Technical Glass Market, By Application |
6.3.1 Overview and Analysis |
6.3.2 Slovenia Technical Glass Market Revenues & Volume, By Optical Lenses, 2022 - 2032F |
6.3.3 Slovenia Technical Glass Market Revenues & Volume, By Display Screens, 2022 - 2032F |
6.3.4 Slovenia Technical Glass Market Revenues & Volume, By Laboratory Equipment, 2022 - 2032F |
6.4 Slovenia Technical Glass Market, By Property |
6.4.1 Overview and Analysis |
6.4.2 Slovenia Technical Glass Market Revenues & Volume, By High Heat Resistance, 2022 - 2032F |
6.4.3 Slovenia Technical Glass Market Revenues & Volume, By Scratch Resistance, 2022 - 2032F |
6.4.4 Slovenia Technical Glass Market Revenues & Volume, By Chemical Stability, 2022 - 2032F |
6.5 Slovenia Technical Glass Market, By End Use |
6.5.1 Overview and Analysis |
6.5.2 Slovenia Technical Glass Market Revenues & Volume, By Electronics, 2022 - 2032F |
6.5.3 Slovenia Technical Glass Market Revenues & Volume, By Automotive, 2022 - 2032F |
6.5.4 Slovenia Technical Glass Market Revenues & Volume, By Healthcare, 2022 - 2032F |
7 Slovenia Technical Glass Market Import-Export Trade Statistics |
7.1 Slovenia Technical Glass Market Export to Major Countries |
7.2 Slovenia Technical Glass Market Imports from Major Countries |
8 Slovenia Technical Glass Market Key Performance Indicators |
8.1 Research and development expenditure to track innovation and technological advancements in technical glass products. |
8.2 Percentage of revenue derived from new markets or industries to gauge market diversification. |
8.3 Number of patents or intellectual property rights obtained to measure innovation and competitiveness in the market. |
9 Slovenia Technical Glass Market - Opportunity Assessment |
9.1 Slovenia Technical Glass Market Opportunity Assessment, By Product Type, 2022 & 2032F |
9.2 Slovenia Technical Glass Market Opportunity Assessment, By Material Type, 2022 & 2032F |
9.3 Slovenia Technical Glass Market Opportunity Assessment, By Application, 2022 & 2032F |
9.4 Slovenia Technical Glass Market Opportunity Assessment, By Property, 2022 & 2032F |
9.5 Slovenia Technical Glass Market Opportunity Assessment, By End Use, 2022 & 2032F |
10 Slovenia Technical Glass Market - Competitive Landscape |
10.1 Slovenia Technical Glass Market Revenue Share, By Companies, 2025 |
10.2 Slovenia Technical Glass Market Competitive Benchmarking, By Operating and Technical Parameters |
11 Company Profiles |
12 Recommendations |
13 Disclaimer |
Export potential assessment - trade Analytics for 2030
Export potential enables firms to identify high-growth global markets with greater confidence by combining advanced trade intelligence with a structured quantitative methodology. The framework analyzes emerging demand trends and country-level import patterns while integrating macroeconomic and trade datasets such as GDP and population forecasts, bilateral import–export flows, tariff structures, elasticity differentials between developed and developing economies, geographic distance, and import demand projections. Using weighted trade values from 2020–2024 as the base period to project country-to-country export potential for 2030, these inputs are operationalized through calculated drivers such as gravity model parameters, tariff impact factors, and projected GDP per-capita growth. Through an analysis of hidden potentials, demand hotspots, and market conditions that are most favorable to success, this method enables firms to focus on target countries, maximize returns, and global expansion with data, backed by accuracy.
By factoring in the projected importer demand gap that is currently unmet and could be potential opportunity, it identifies the potential for the Exporter (Country) among 190 countries, against the general trade analysis, which identifies the biggest importer or exporter.
To discover high-growth global markets and optimize your business strategy:
Click Here
Pricing
- Single User License$ 1,995
- Department License$ 2,400
- Site License$ 3,120
- Global License$ 3,795

Search
Thought Leadership and Analyst Meet


Our Clients
Latest Reports
- Canada Cloud CFD Market (2026-2032) | Size & Revenue, Industry, Growth, Competitive Landscape, Forecast, Segmentation, Value, Outlook, Trends, Share, Analysis, Companies
- Taiwan Food Delivery Platform Market (2026-2032) | Companies, Outlook, Analysis, Trends, Value, Revenue, Segmentation, Share, Forecast, Competitive Landscape, Growth, Size & Forecast
- United Kingdom (UK) Long-term Care Insurance Market (2026-2032) | Growth, Share, Consumer Insights, Drivers, Opportunities, Competition, Pricing Analysis, Segments, Restraints, Companies, Competitive, Value, Outlook, Size, Demand, Analysis, Challenges, Strategic Insights, Investment Trends, Revenue, Trends, Supply, Forecast
- United Kingdom (UK) Long Term Care Market (2026-2032) | Companies, Outlook, Analysis, Trends, Value, Revenue, Segmentation, Share, Forecast, Competitive Landscape, Growth, Size & Forecast
- Iraq Insulation and Waterproofing Market (2026-2032) | Outlook, Drivers, Growth, Size, Share, Industry, Revenue, Trends, Demand, Competitive, Strategic Insights, Opportunities, Segments, Companies, Challenges, Strategy, Consumer Insights, Analysis, Investment Trends, Value, Segmentation, Forecast, Restraints
- India Switchgear Market Outlook (2026-2032) | Size, Share, Trends, Growth, Revenue, Forecast, Analysis, Value, Outlook
- Pakistan Contraceptive Implants Market (2025-2031) | Demand, Growth, Size, Share, Industry, Pricing Analysis, Competitive, Strategic Insights, Strategy, Consumer Insights, Analysis, Investment Trends, Opportunities, Revenue, Segments, Value, Segmentation, Supply, Forecast, Restraints, Outlook, Competition, Drivers, Trends, Companies, Challenges
- Sri Lanka Packaging Market (2026-2032) | Outlook, Competition, Drivers, Trends, Demand, Pricing Analysis, Competitive, Strategic Insights, Companies, Challenges, Strategy, Consumer Insights, Analysis, Investment Trends, Opportunities, Growth, Size, Share, Industry, Revenue, Segments, Value, Segmentation, Supply, Forecast, Restraints
- India Kids Watches Market (2026-2032) | Strategy, Consumer Insights, Analysis, Investment Trends, Opportunities, Growth, Size, Share, Industry, Revenue, Segments, Value, Segmentation, Supply, Forecast, Restraints, Outlook, Competition, Drivers, Trends, Demand, Pricing Analysis, Competitive, Strategic Insights, Companies, Challenges
- Saudi Arabia Core Assurance Service Market (2025-2031) | Strategy, Consumer Insights, Analysis, Investment Trends, Opportunities, Growth, Size, Share, Industry, Revenue, Segments, Value, Segmentation, Supply, Forecast, Restraints, Outlook, Competition, Drivers, Trends, Demand, Pricing Analysis, Competitive, Strategic Insights, Companies, Challenges
Industry Events and Analyst Meet

India EV Show 2026

EV tech India Expo 2026

Auto Tech Asia 2026

Battery Tech India 2026

Smart Production Solutions Guangzhou 2026
Whitepaper
- Middle East & Africa Commercial Security Market Click here to view more.
- Middle East & Africa Fire Safety Systems & Equipment Market Click here to view more.
- GCC Drone Market Click here to view more.
- Middle East Lighting Fixture Market Click here to view more.
- GCC Physical & Perimeter Security Market Click here to view more.
6WResearch In News
- Doha a strategic location for EV manufacturing hub: IPA Qatar
- Demand for luxury TVs surging in the GCC, says Samsung
- Empowering Growth: The Thriving Journey of Bangladesh’s Cable Industry
- Demand for luxury TVs surging in the GCC, says Samsung
- Video call with a traditional healer? Once unthinkable, it’s now common in South Africa
- Intelligent Buildings To Smooth GCC’s Path To Net Zero