South Africa Power Cable Market (2026-2032) | Value, Growth, Companies, Analysis, Share, Industry, Forecast, Trends, Size & Revenue
Market Forecast By Installation Type (Overhead, Underground, Submarine), By Voltage (Low, Medium, High), By End Use (Residential, Commercial, Industrial, Utilities) And Competitive Landscape
| Product Code: ETC239388 | Publication Date: Aug 2022 | Updated Date: May 2026 | Product Type: Market Research Report | |
| Publisher: 6Wresearch | Author: Ravi Bhandari | No. of Pages: 75 | No. of Figures: 35 | No. of Tables: 20 |
South Africa Power Cable Market Growth Rate
According to 6Wresearch internal database and industry insights, the South Africa Power Cable Market is growing at a compound annual growth rate (CAGR) of 7.85% during the forecast period (2026-2032).
South Africa Power Cable Market Year-wise Growth Rate and Key Drivers
This graph highlights how the South Africa Power Cable Market has steadily grown over the past five years, supported by major growth factors.
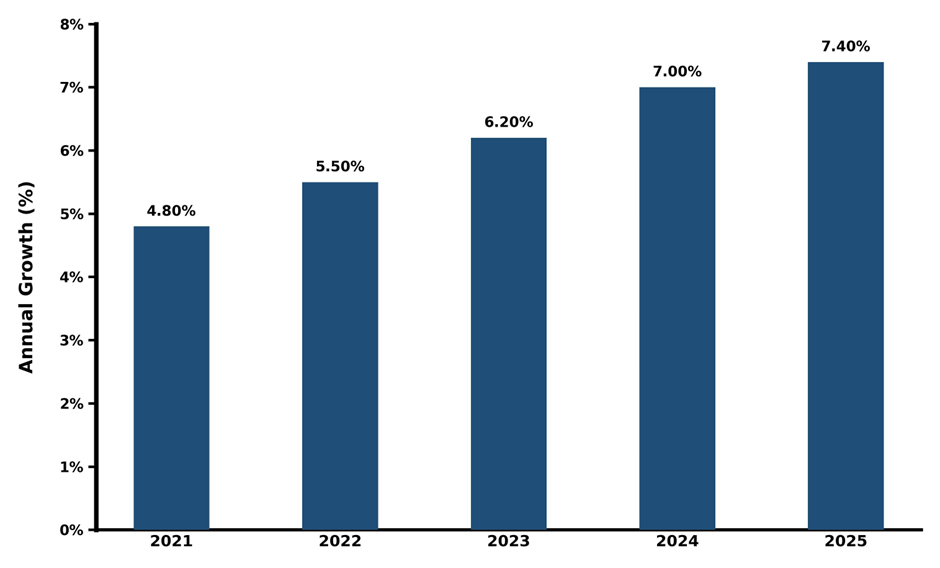
The table below presents the year‑wise growth rates along with the key drivers influencing the market
| Years | Est. Annual Growth in % | Growth Drivers |
| 2021 | 4.8% | Expansion of electricity transmission networks and grid upgrades |
| 2022 | 5.5% | Increasing investments in renewable energy projects |
| 2023 | 6.2% | Government focus on rural electrification programs |
| 2024 | 7% | Modernization of aging power infrastructure |
| 2025 | 7.4% | Growing demand from industrial and utility sectors |
Topics Covered in the South Africa Power Cable Market Report
South Africa Power Cable Market report thoroughly covers the market by installation type, voltage, and end use. The market report provides an unbiased and detailed analysis of ongoing market trends, opportunities/high growth areas, and market drivers, which would help stakeholders devise and align their market strategies according to the current and future market dynamics.
South Africa Power Cable Market Highlights
| Report Name |
South Africa Power Cable Market |
| Forecast period | 2026-2032 |
| CAGR | 7.85% |
| Market Size |
Utilities |
South Africa Power Cable Market Synopsis
The South Africa Power Cable Market is predicted to have a steady growth. The market is led by increasing investments in power framework, growth of renewable energy projects, and the modernization of existing electricity networks. Along with that, government programs to improve energy access and reliability, particularly in rural areas, are further encouraging market’s growth. Furthermore, the rising industrialization and urbanization are expanding the demand for efficient and durable power cable solutions across various sectors.
Evaluation of Growth Drivers in the South Africa Power Cable Market (2026-2032)
Below mentioned some growth drivers and their impact on market dynamics:
| Drivers | Primary Segments Affected | Why It Matters |
| Grid Expansion Projects | Installation Type (Overhead, Underground) | Improves power distribution by strengthening transmission and distribution networks |
| Renewable Energy Integration | Voltage (High, Medium) | Supports clean energy transmission by connecting renewable sources to the grid |
| Government Electrification Programs | End Use (Utilities, Residential) | Expands energy access by increasing electricity availability in rural and urban areas |
| Industrial Growth | End Use (Industrial) | Increases cable demand due to higher power consumption in industries |
| Urban Infrastructure Development | Installation Type (Underground) | Enhances reliability by reducing outages and improving network stability |
The South Africa Power Cable Market is projected to grow significantly, with a CAGR of 7.85% during the forecast period of 2026-2032. The market is growing due to ongoing investments in transmission and distribution networks, along with an increasing demand for electricity across residential, commercial, and industrial sectors. Also, the government-led electrification programs and renewable energy projects are playing a main role in expanding cable demand. Along with that, technological advancements in cable materials and insulation are improving efficiency and durability that encourages market’s expansion.
Evaluation of Restraints in the South Africa Power Cable Market
Below mentioned are some major restraints and their influence on market dynamics:
| Restraints | Primary Segments Affected | What This Means |
| High Raw Material Costs | All Segments | Raises overall project expenses due to rising prices of copper and aluminum |
| Infrastructure Limitations | Installation Type (Underground) | Delays project execution owing to complex installation requirements |
| Power Sector Financial Issues | End Use (Utilities) | Slows investments as utilities face budget and investing constraints |
| Technical Losses | Voltage Segments | Minimizes efficiency by causing energy losses during transmission |
| Regulatory Delays | All Segments | Hampers approvals due to lengthy compliance and policy procedures |
South Africa Power Cable Market Challenges
The South Africa Power Cable Market faces challenges such as high raw material costs, especially copper and aluminium, which impacts production expenses. In addition to, infrastructure limitations and slows down in project approvals restrict timely deployment of cable networks. Besides, the financial constraints within the power sector and utilities also affect investment capacity. Moreover, technical losses in the transmission and distribution systems reduce the overall efficiency, creating operational challenges for the market participants.
South Africa Power Cable Market Trends
Some major trends contributing to the South Africa Power Cable Market Growth are:
- Shift Toward Underground Cabling: Rising adoption of underground cables enhances security and minimizes transmission losses in urban areas.
- Renewable Energy Connectivity: The expanding demand for cables to connect to solar and wind projects and ensures more of an efficient power transmission and supports the transition towards clean energy sources.
- Smart Grid Development: This combination of intelligent grid systems is to improve monitoring, which also enhances energy efficiency, and enables real-time fault detection and load management.
Investment Opportunities in the South Africa Power Cable Market
Below mentioned are some investment opportunities in the South Africa Power Cable Industry:
- Smart Grid Infrastructure: The development of advanced grid systems offers long-term growth potential by enhancing efficiency and network reliability.
- Industrial Expansion: Rise in demand from the industrial sector is creating opportunities for high-capacity cable solutions to cater to the growth in power consumption.
- Renewable Energy Projects: By investing in cables for solar and wind farms provides a reliable power transmission network and leads the growth of clean energy capacity.
Top 5 Leading Players in the South Africa Power Cable Market
Here are some top companies contributing to South Africa Power Cable Market Share:
1. Aberdare Cables
| Company Name | Aberdare Cables |
|---|---|
| Established Year | 1946 |
| Headquarters | Pietermaritzburg, South Africa |
| Official Website | Click Here |
Aberdare Cables is a leading manufacturer of electrical cables in South Africa, offering a wide range of power cable solutions for industrial, commercial, and utility applications with a strong focus on quality and reliability.
2. CBI-electric African Cables
| Company Name | CBI-electric: African Cables |
|---|---|
| Established Year | 1949 |
| Headquarters | Johannesburg, South Africa |
| Official Website | Click Here |
CBI-electric provides innovative cable solutions, including medium and high-voltage cables, catering to the growing demand in infrastructure and energy sectors.
3. Defy Cables
| Company Name | Defy Cables |
|---|---|
| Established Year | 1960 |
| Headquarters | Johannesburg, South Africa |
| Official Website | - |
Defy Cables specializes in manufacturing durable and high-performance power cables, supporting residential and industrial electrification needs.
4. Zest WEG Group
| Company Name | Zest WEG Group |
|---|---|
| Established Year | 1982 |
| Headquarters | Johannesburg, South Africa |
| Official Website | Click Here |
Zest WEG Group offers comprehensive electrical solutions, including power cables, focusing on efficiency and sustainable energy systems.
5. Reunert Limited
| Company Name | Reunert Limited |
|---|---|
| Established Year | 1888 |
| Headquarters | Johannesburg, South Africa |
| Official Website | Click Here |
Reunert Limited operates through its subsidiaries to provide advanced cable and electrical solutions, supporting infrastructure development and power distribution networks.
Government Regulations Introduced in the South Africa Power Cable Market
According to South African government data, the development of the South Africa Power Cable Market is strongly influenced by regulations. The government has introduced programs such as the Integrated Resource Plan (IRP) and Renewable Energy Independent Power Producer Procurement Programme (REIPPPP), which encourage investments in energy infrastructure. In addition to, Eskom’s grid modernization projects and rural electrification programs aims to improve power distribution. Also, the regulatory standards for cable quality and safety ensure reliability and adherence, while strengthening the market framework.
Future Insights of the South Africa Power Cable Market
The upcoming years for the South Africa Power Cable Market appears to be favorable, with robust growth forecasts. The market is led by rising electricity demand, expansion of renewable energy projects, and modernization of grid infrastructure. Along with that, continued government support for electrification and energy efficiency programs will further expand market’s growth. Furthermore, the advancements in cable technology and increased investments in smart grid systems are expected to create new opportunities for industry players.
Market Segmentation Analysis
The report offers a comprehensive study of the subsequent market segments and their leading categories.
Overhead to Dominate the Market - By Installation Type
According to Mansi Ahuja, Senior Research Analyst at 6Wresearch, overhead cables dominate the segment owing to their cost-effectiveness and ease of installation, especially in broad transmission projects. These cables are globally used in rural electrification and long-distance power transmission, making them a preferred option for utilities aiming to expand grid coverage efficiently.
High Voltage to Dominate the Market – By Voltage
High voltage cables leads the segment as they are crucial for transmitting electricity over long distances with minimal losses. The expanding need for efficient power transmission from renewable energy plants and broad generation facilities is leading the demand for high voltage cable systems across the country.
Utilities to Dominate the Market – By End Use
The utilities segment dominates due to large-scale investments in power generation, transmission, and distribution infrastructure. Government-led electrification programs and the need to upgrade aging grid systems are significantly contributing to the dominance of utilities in the power cable market.
Key attractiveness of the report
- 10 Years Market Numbers.
- Historical Data Starting from 2022 to 2025.
- Base Year: 2025
- Forecast Data until 2032
- Key Performance Indicators Impacting the Market.
- Major Upcoming Developments and Projects.
Key Highlights of the Report:
- South Africa Power Cable Market Outlook
- Market Size of South Africa Power Cable Market, 2025
- Forecast of South Africa Power Cable Market, 2032
- Historical Data and Forecast of South Africa Power Cable Revenues & Volume for the Period 2022-2032
- South Africa Power Cable Market Trend Evolution
- South Africa Power Cable Market Drivers and Challenges
- South Africa Power Cable Price Trends
- South Africa Power Cable Porter's Five Forces
- South Africa Power Cable Industry Life Cycle
- Historical Data and Forecast of South Africa Power Cable Market Revenues & Volume By Installation Type for the Period 2022-2032
- Historical Data and Forecast of South Africa Power Cable Market Revenues & Volume By Overhead for the Period 2022-2032
- Historical Data and Forecast of South Africa Power Cable Market Revenues & Volume By Underground for the Period 2022-2032
- Historical Data and Forecast of South Africa Power Cable Market Revenues & Volume By Submarine for the Period 2022-2032
- Historical Data and Forecast of South Africa Power Cable Market Revenues & Volume By Voltage for the Period 2022-2032
- Historical Data and Forecast of South Africa Power Cable Market Revenues & Volume By Low for the Period 2022-2032
- Historical Data and Forecast of South Africa Power Cable Market Revenues & Volume By Medium for the Period 2022-2032
- Historical Data and Forecast of South Africa Power Cable Market Revenues & Volume By High for the Period 2022-2032
- Historical Data and Forecast of South Africa Power Cable Market Revenues & Volume By End Use for the Period 2022-2032
- Historical Data and Forecast of South Africa Power Cable Market Revenues & Volume By Residential for the Period 2022-2032
- Historical Data and Forecast of South Africa Power Cable Market Revenues & Volume By Commercial for the Period 2022-2032
- Historical Data and Forecast of South Africa Power Cable Market Revenues & Volume By Industrial for the Period 2022-2032
- Historical Data and Forecast of South Africa Power Cable Market Revenues & Volume By Utilities for the Period 2022-2032
- South Africa Power Cable Import Export Trade Statistics
- Market Opportunity Assessment By Installation Type
- Market Opportunity Assessment By Voltage
- Market Opportunity Assessment By End Use
- South Africa Power Cable Top Companies Market Share
- South Africa Power Cable Competitive Benchmarking By Technical and Operational Parameters
- South Africa Power Cable Company Profiles
- South Africa Power Cable Key Strategic Recommendations
Market covered
The report subsequently covers the market by following segments and subsegments.
By Installation Type
- Overhead
- Underground
- Submarine
By Voltage
- Low
- Medium
- High
By End Use
- Residential
- Commercial
- Industrial
- Utilities
South Africa Power Cable Market (2026-2032): FAQs
The South Africa Power Cable Market is projected to grow at a CAGR of 7.85% during the forecast period (2026-2032).
The key trends covers smart grid development, underground cabling adoption, and integration of renewable energy systems.
The growth is led by grid expansion, renewable energy projects, urban development, and industrial demand.
The major challenges includes high raw material costs, infrastructure limitations, regulatory delays, and financial constraints in the power sector.
6Wresearch actively monitors the South Africa Power Cable Market and publishes its comprehensive annual report, highlighting emerging trends, growth drivers, revenue analysis, and forecast outlook. Our insights help businesses to make data-backed strategic decisions with ongoing market dynamics. Our analysts track relevent industries related to the South Africa Power Cable Market, allowing our clients with actionable intelligence and reliable forecasts tailored to emerging regional needs.
Yes, we provide customisation as per your requirements. To learn more, feel free to contact us on sales@6wresearch.com
| 1 Executive Summary |
| 2 Introduction |
| 2.1 Key Highlights of the Report |
| 2.2 Report Description |
| 2.3 Market Scope & Segmentation |
| 2.4 Research Methodology |
| 2.5 Assumptions |
| 3 South Africa Power Cable Market Overview |
| 3.1 South Africa Power Cable Market Revenues & Volume, 2022 - 2032F |
| 3.2 South Africa Power Cable Market - Industry Life Cycle |
| 3.3 South Africa Power Cable Market - Porter's Five Forces |
| 3.4 South Africa Power Cable Market Revenues & Volume Share, By Installation Type, 2022 & 2032F |
| 3.5 South Africa Power Cable Market Revenues & Volume Share, By Voltage, 2022 & 2032F |
| 3.6 South Africa Power Cable Market Revenues & Volume Share, By End Use, 2022 & 2032F |
| 4 South Africa Power Cable Market Dynamics |
| 4.1 Impact Analysis |
| 4.2 Market Drivers |
| 4.2.1 Increasing urbanization and industrialization in South Africa leading to higher demand for power cables. |
| 4.2.2 Government initiatives to improve electricity access and infrastructure in the country. |
| 4.2.3 Growing investments in renewable energy projects driving the demand for power cables. |
| 4.2.4 Technological advancements in power cable manufacturing leading to more efficient and reliable products. |
| 4.3 Market Restraints |
| 4.3.1 Fluctuating prices of raw materials impacting the cost of production. |
| 4.3.2 Competition from alternative energy sources such as solar and wind power. |
| 4.3.3 Regulatory challenges and compliance requirements affecting the market. |
| 4.3.4 Economic instability and currency fluctuations impacting investments in infrastructure projects. |
| 5 South Africa Power Cable Market Trends |
| 6 South Africa Power Cable Market Segmentation |
| 6.1 South Africa Power Cable Market, By Installation Type |
| 6.1.1 Overview and Analysis |
| 6.1.2 South Africa Power Cable Market Revenues & Volume, By Installation Type, 2022 - 2032F |
| 6.1.3 South Africa Power Cable Market Revenues & Volume, By Overhead, 2022 - 2032F |
| 6.1.4 South Africa Power Cable Market Revenues & Volume, By Underground, 2022 - 2032F |
| 6.1.5 South Africa Power Cable Market Revenues & Volume, By Submarine, 2022 - 2032F |
| 6.2 South Africa Power Cable Market, By Voltage |
| 6.2.1 Overview and Analysis |
| 6.2.2 South Africa Power Cable Market Revenues & Volume, By Low, 2022 - 2032F |
| 6.2.3 South Africa Power Cable Market Revenues & Volume, By Medium, 2022 - 2032F |
| 6.2.4 South Africa Power Cable Market Revenues & Volume, By High, 2022 - 2032F |
| 6.3 South Africa Power Cable Market, By End Use |
| 6.3.1 Overview and Analysis |
| 6.3.2 South Africa Power Cable Market Revenues & Volume, By Residential, 2022 - 2032F |
| 6.3.3 South Africa Power Cable Market Revenues & Volume, By Commercial, 2022 - 2032F |
| 6.3.4 South Africa Power Cable Market Revenues & Volume, By Industrial, 2022 - 2032F |
| 6.3.5 South Africa Power Cable Market Revenues & Volume, By Utilities, 2022 - 2032F |
| 7 South Africa Power Cable Market Import-Export Trade Statistics |
| 7.1 South Africa Power Cable Market Export to Major Countries |
| 7.2 South Africa Power Cable Market Imports from Major Countries |
| 8 South Africa Power Cable Market Key Performance Indicators |
| 8.1 Average selling price of power cables in South Africa. |
| 8.2 Percentage of electricity generated from renewable sources in the country. |
| 8.3 Number of new infrastructure projects announced in the power sector. |
| 8.4 Innovation rate in power cable technology. |
| 8.5 Energy consumption patterns in key industries. |
| 9 South Africa Power Cable Market - Opportunity Assessment |
| 9.1 South Africa Power Cable Market Opportunity Assessment, By Installation Type, 2022 & 2032F |
| 9.2 South Africa Power Cable Market Opportunity Assessment, By Voltage, 2022 & 2032F |
| 9.3 South Africa Power Cable Market Opportunity Assessment, By End Use, 2022 & 2032F |
| 10 South Africa Power Cable Market - Competitive Landscape |
| 10.1 South Africa Power Cable Market Revenue Share, By Companies, 2025 |
| 10.2 South Africa Power Cable Market Competitive Benchmarking, By Operating and Technical Parameters |
| 11 Company Profiles |
| 12 Recommendations |
| 13 Disclaimer |
Global Go To Market Strategy - 2030
Export potential enables firms to identify high-growth global markets with greater confidence by combining advanced trade intelligence with a structured quantitative methodology. The framework analyzes emerging demand trends and country-level import patterns while integrating macroeconomic and trade datasets such as GDP and population forecasts, bilateral import–export flows, tariff structures, elasticity differentials between developed and developing economies, geographic distance, and import demand projections. Using weighted trade values from 2020–2024 as the base period to project country-to-country export potential for 2030, these inputs are operationalized through calculated drivers such as gravity model parameters, tariff impact factors, and projected GDP per-capita growth. Through an analysis of hidden potentials, demand hotspots, and market conditions that are most favorable to success, this method enables firms to focus on target countries, maximize returns, and global expansion with data, backed by accuracy.
By factoring in the projected importer demand gap that is currently unmet and could be potential opportunity, it identifies the potential for the Exporter (Country) among 190 countries, against the general trade analysis, which identifies the biggest importer or exporter.
To discover high-growth global markets and optimize your business strategy:
Click Here
Pricing
- Single User License$ 1,995
- Department License$ 2,400
- Site License$ 3,120
- Global License$ 3,795

Leadership Perspectives from Industry Events
Search
Thought Leadership and Analyst Meet


Our Clients
6WResearch In News
- India Air Conditioner Market Set for Strong Rebound in 2026 After Weather-Led Correction and GST-Driven Recovery: 6Wresearch
- ADAS in India: How Automatic Emergency Braking, Blind Spot Detection & Driver Monitoring are Transforming Road Safety
- Doha a strategic location for EV manufacturing hub: IPA Qatar
- Demand for luxury TVs surging in the GCC, says Samsung
- Empowering Growth: The Thriving Journey of Bangladesh’s Cable Industry
- Demand for luxury TVs surging in the GCC, says Samsung
Latest Reports
- Nicaragua RPG Gaming Market (2026-2032)
- New Zealand RPG Gaming Market (2026-2032)
- Netherlands RPG Gaming Market (2026-2032)
- Nauru RPG Gaming Market (2026-2032)
- Namibia RPG Gaming Market (2026-2032)
- Mozambique RPG Gaming Market (2026-2032)
- Montenegro RPG Gaming Market (2026-2032)
- Mongolia RPG Gaming Market (2026-2032)
- Monaco RPG Gaming Market (2026-2032)
- Micronesia RPG Gaming Market (2026-2032)
Industry Events and Analyst Meet

HIMTEX 2026

India Refining Summit 2026

India EV Show 2026

EV tech India Expo 2026

Auto Tech Asia 2026
Whitepaper
- Middle East & Africa Commercial Security Market Click here to view more.
- Middle East & Africa Fire Safety Systems & Equipment Market Click here to view more.
- GCC Drone Market Click here to view more.
- Middle East Lighting Fixture Market Click here to view more.
- GCC Physical & Perimeter Security Market Click here to view more.