Spain Quicklime Market (2026-2032) Outlook | Trends, Analysis, Forecast, Size, Growth, Share, Revenue, Companies, Industry & Value
Market Forecast By Types (High Calcium Quicklime, Magnesium Quicklime, Dolomitic Quicklime, Others), By Applications (Metallurgy, Building And Construction Materials, Water Treatment, Mining, Chemicals, Others) And Competitive Landscape
| Product Code: ETC343634 | Publication Date: Aug 2022 | Updated Date: Apr 2026 | Product Type: Market Research Report | |
| Publisher: 6Wresearch | Author: Ravi Bhandari | No. of Pages: 75 | No. of Figures: 35 | No. of Tables: 20 |
Spain Quicklime Market Size (2020-2030)
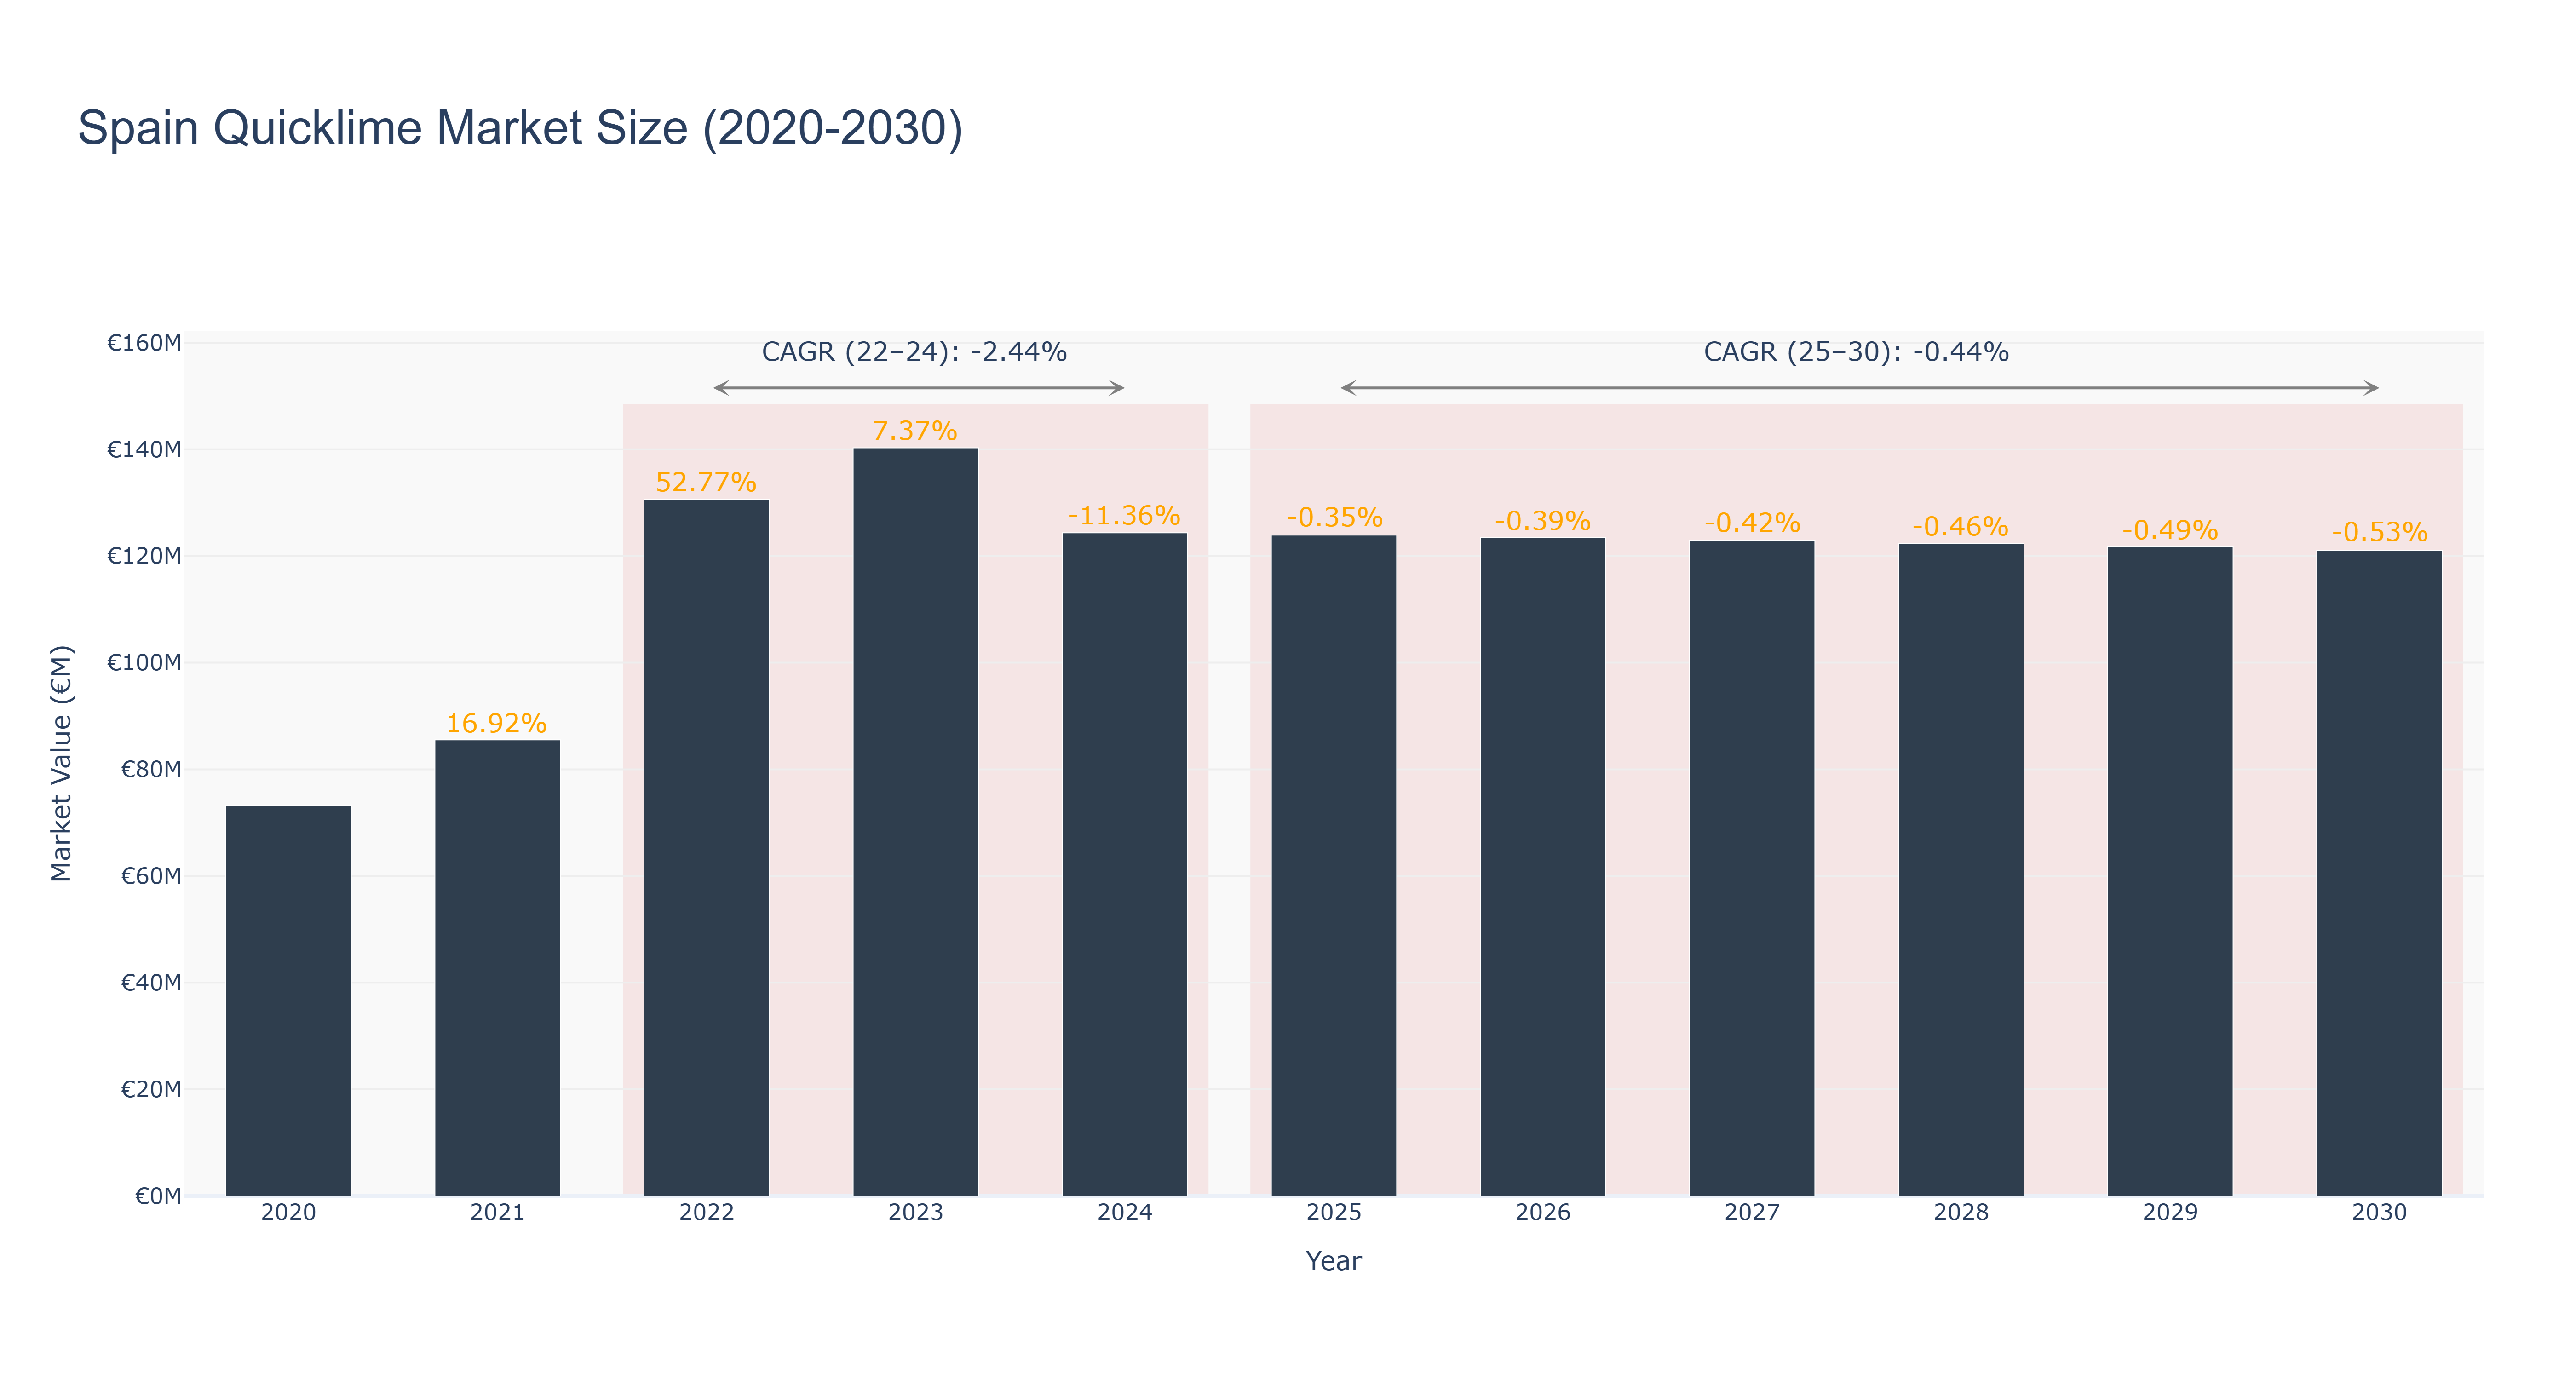
The Spain Quicklime Market reached its peak in 2023 with a market size of €140.29 million. From 2020 to 2024, the actual market size fluctuated, starting at €73.15 million in 2020, increasing to €140.29 million in 2023, and then decreasing to €124.36 million in 2024. The forecasted market size from 2025 to 2030 shows a continuous decline, with the market size expected to reach €121.10 million in 2030. The market experienced a sharp decline in 2024 due to economic slowdown and decreased demand, while the slight decreases in recent years can be attributed to market saturation and competition. Despite the declining trend, recent developments in sustainable quicklime production methods are expected to drive market growth in the future, catering to the increasing demand for eco-friendly construction materials.
Spain Quicklime Market: Production & Trade Performance (2019-2025)
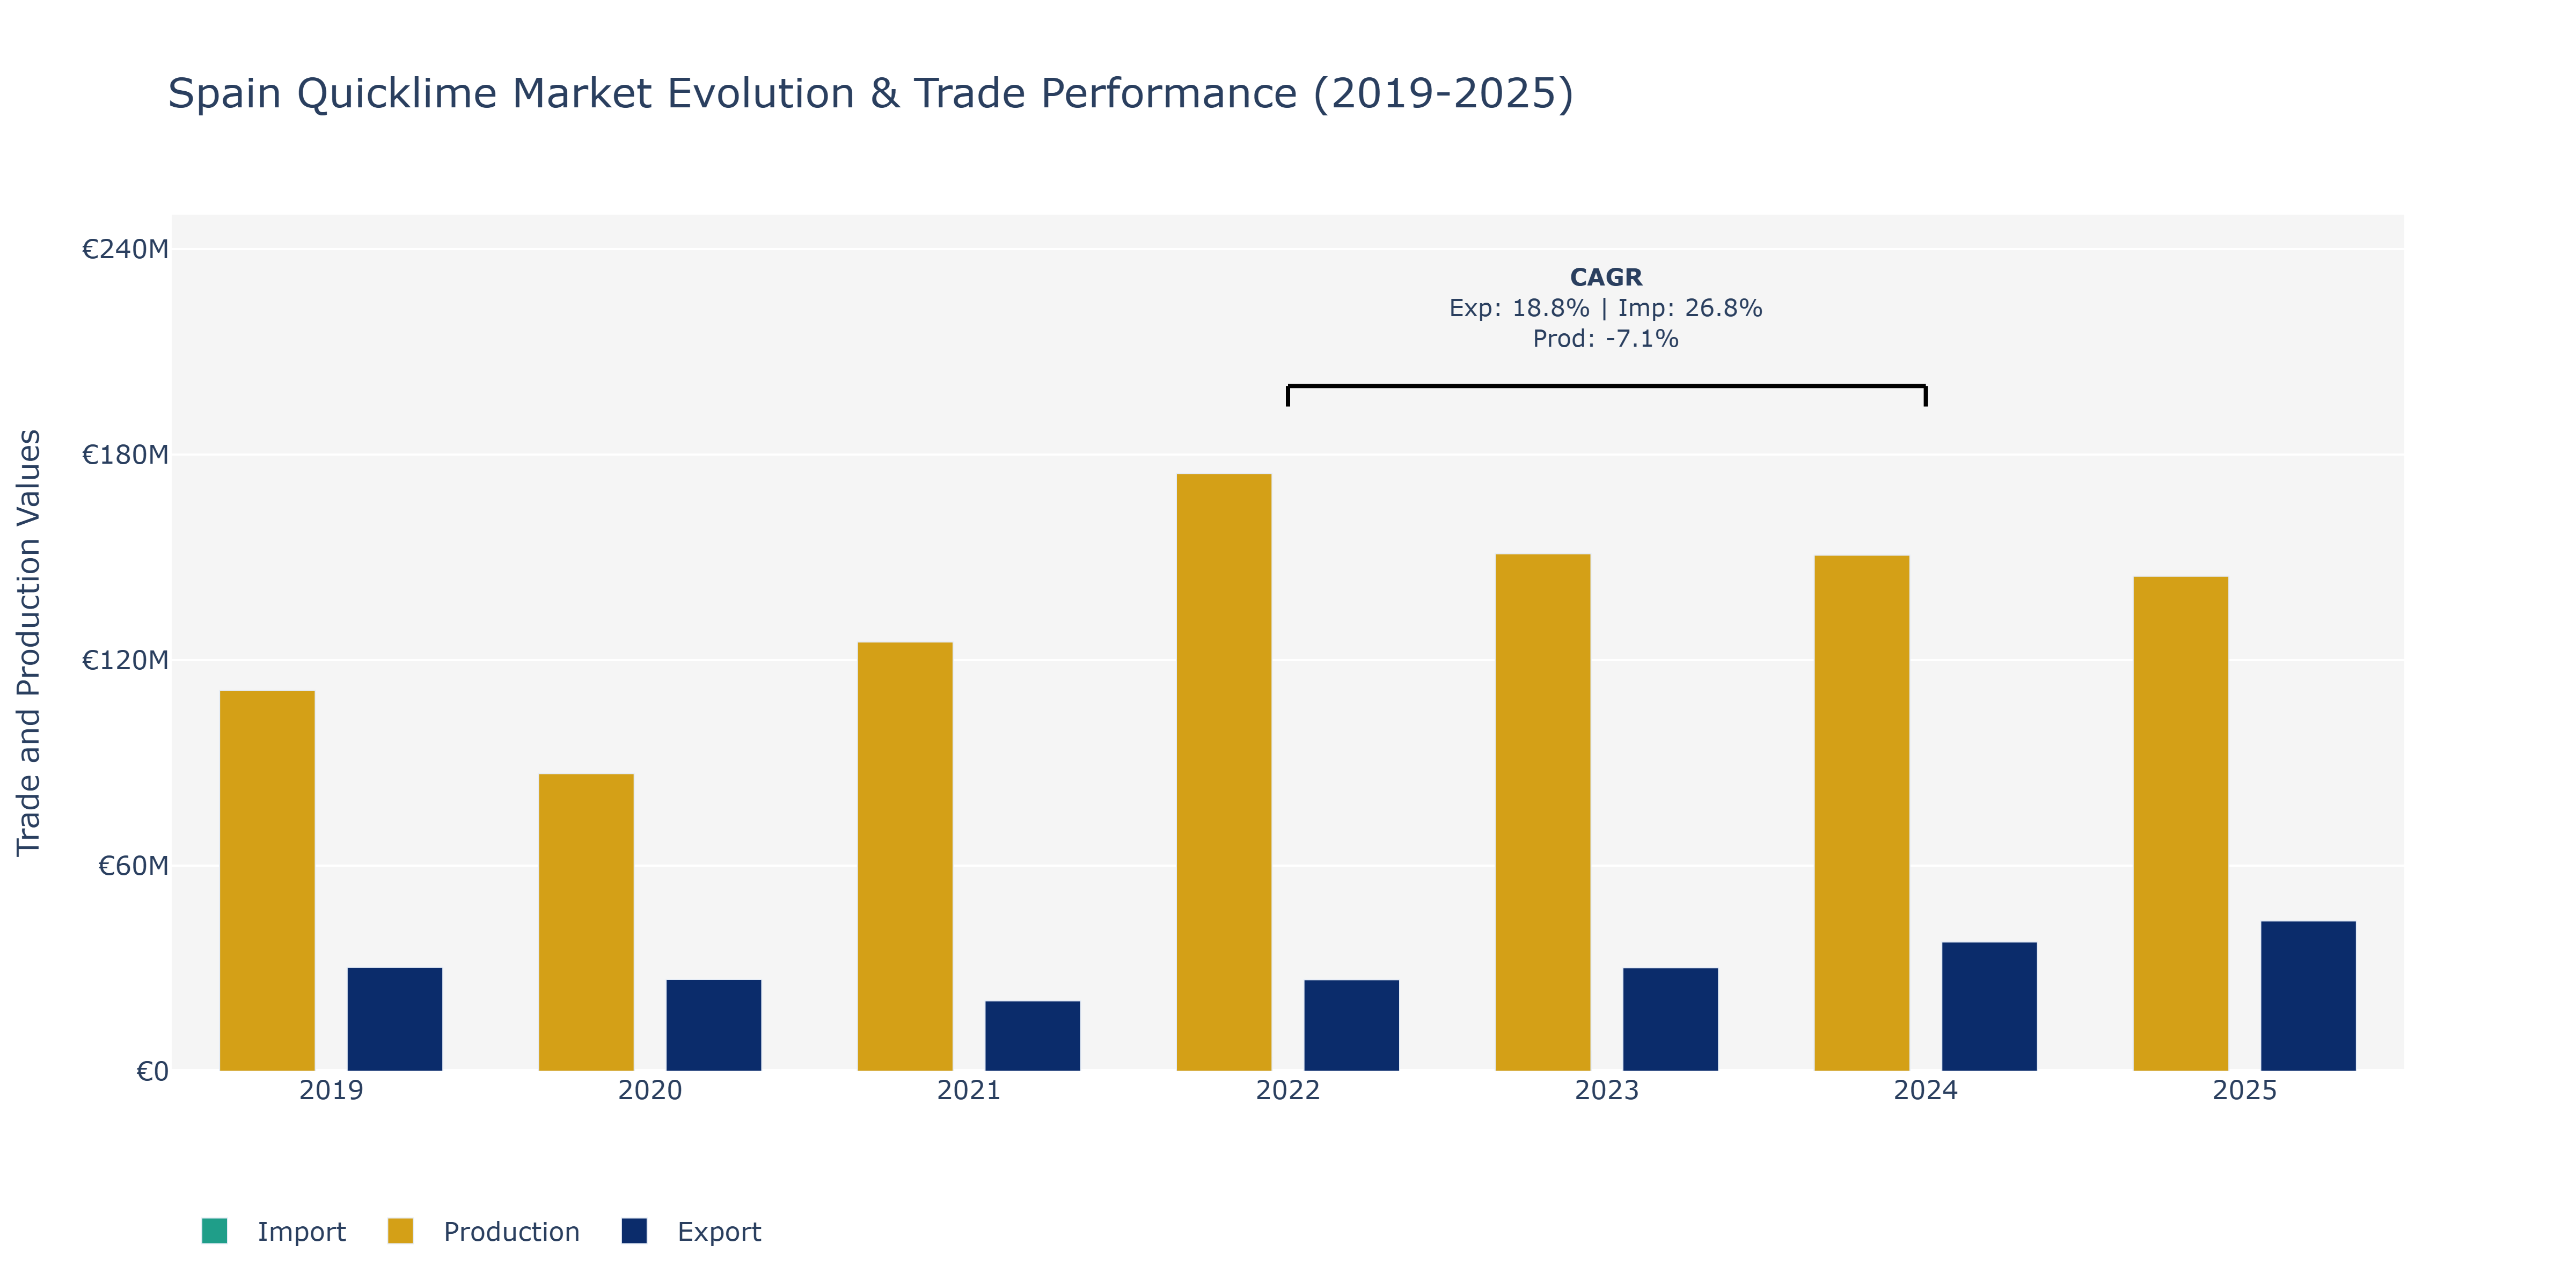
In the Spain Quicklime Market, exports fluctuated notably over the years, reaching a peak of €43.86 million in 2025 after a decline from 2019 to 2021. The peak could be attributed to increased demand from construction and industrial sectors as Spain recovered from economic downturns. Imports followed a similar pattern with an upward trend, peaking at €8.09 million in 2025, possibly due to the need for raw materials to support the expanding production capacity. Production, on the other hand, experienced a decline from 2019 to 2020 before stabilizing and then declining again through 2023, possibly due to supply chain disruptions and market uncertainties. The steady decline in production could be linked to environmental regulations pushing companies to adopt greener alternatives. These trends suggest a dynamic market influenced by economic conditions, industry demands, and regulatory pressures.
Key Highlights of the Report:
- Spain Quicklime Market Outlook
- Market Size of Spain Quicklime Market, 2025
- Forecast of Spain Quicklime Market, 2032
- Historical Data and Forecast of Spain Quicklime Revenues & Volume for the Period 2022-2032F
- Spain Quicklime Market Trend Evolution
- Spain Quicklime Market Drivers and Challenges
- Spain Quicklime Price Trends
- Spain Quicklime Porter's Five Forces
- Spain Quicklime Industry Life Cycle
- Historical Data and Forecast of Spain Quicklime Market Revenues & Volume By Types for the Period 2022-2032F
- Historical Data and Forecast of Spain Quicklime Market Revenues & Volume By High Calcium Quicklime for the Period 2022-2032F
- Historical Data and Forecast of Spain Quicklime Market Revenues & Volume By Magnesium Quicklime for the Period 2022-2032F
- Historical Data and Forecast of Spain Quicklime Market Revenues & Volume By Dolomitic Quicklime for the Period 2022-2032F
- Historical Data and Forecast of Spain Quicklime Market Revenues & Volume By Others for the Period 2022-2032F
- Historical Data and Forecast of Spain Quicklime Market Revenues & Volume By Applications for the Period 2022-2032F
- Historical Data and Forecast of Spain Quicklime Market Revenues & Volume By Metallurgy for the Period 2022-2032F
- Historical Data and Forecast of Spain Quicklime Market Revenues & Volume By Building And Construction Materials for the Period 2022-2032F
- Historical Data and Forecast of Spain Quicklime Market Revenues & Volume By Water Treatment for the Period 2022-2032F
- Historical Data and Forecast of Spain Quicklime Market Revenues & Volume By Mining for the Period 2022-2032F
- Historical Data and Forecast of Spain Quicklime Market Revenues & Volume By Chemicals for the Period 2022-2032F
- Historical Data and Forecast of Spain Quicklime Market Revenues & Volume By Others for the Period 2022-2032F
- Spain Quicklime Import Export Trade Statistics
- Market Opportunity Assessment By Types
- Market Opportunity Assessment By Applications
- Spain Quicklime Top Companies Market Share
- Spain Quicklime Competitive Benchmarking By Technical and Operational Parameters
- Spain Quicklime Company Profiles
- Spain Quicklime Key Strategic Recommendations
Frequently Asked Questions About the Market Study (FAQs):
6Wresearch actively monitors the Spain Quicklime Market and publishes its comprehensive annual report, highlighting emerging trends, growth drivers, revenue analysis, and forecast outlook. Our insights help businesses to make data-backed strategic decisions with ongoing market dynamics. Our analysts track relevent industries related to the Spain Quicklime Market, allowing our clients with actionable intelligence and reliable forecasts tailored to emerging regional needs.
Yes, we provide customisation as per your requirements. To learn more, feel free to contact us on sales@6wresearch.com
1 Executive Summary |
2 Introduction |
2.1 Key Highlights of the Report |
2.2 Report Description |
2.3 Market Scope & Segmentation |
2.4 Research Methodology |
2.5 Assumptions |
3 Spain Quicklime Market Overview |
3.1 Spain Country Macro Economic Indicators |
3.2 Spain Quicklime Market Revenues & Volume, 2022 & 2032F |
3.3 Spain Quicklime Market - Industry Life Cycle |
3.4 Spain Quicklime Market - Porter's Five Forces |
3.5 Spain Quicklime Market Revenues & Volume Share, By Types, 2022 & 2032F |
3.6 Spain Quicklime Market Revenues & Volume Share, By Applications, 2022 & 2032F |
4 Spain Quicklime Market Dynamics |
4.1 Impact Analysis |
4.2 Market Drivers |
4.2.1 Increasing construction activities in Spain leading to higher demand for quicklime |
4.2.2 Growing adoption of quicklime in environmental applications such as wastewater treatment and air pollution control |
4.2.3 Rise in steel production and metallurgical industries driving the demand for quicklime |
4.3 Market Restraints |
4.3.1 Fluctuating prices of raw materials impacting the production cost of quicklime |
4.3.2 Stringent environmental regulations affecting the production and usage of quicklime in certain industries |
5 Spain Quicklime Market Trends |
6 Spain Quicklime Market, By Types |
6.1 Spain Quicklime Market, By Types |
6.1.1 Overview and Analysis |
6.1.2 Spain Quicklime Market Revenues & Volume, By Types, 2022 - 2032F |
6.1.3 Spain Quicklime Market Revenues & Volume, By High Calcium Quicklime, 2022 - 2032F |
6.1.4 Spain Quicklime Market Revenues & Volume, By Magnesium Quicklime, 2022 - 2032F |
6.1.5 Spain Quicklime Market Revenues & Volume, By Dolomitic Quicklime, 2022 - 2032F |
6.1.6 Spain Quicklime Market Revenues & Volume, By Others, 2022 - 2032F |
6.2 Spain Quicklime Market, By Applications |
6.2.1 Overview and Analysis |
6.2.2 Spain Quicklime Market Revenues & Volume, By Metallurgy, 2022 - 2032F |
6.2.3 Spain Quicklime Market Revenues & Volume, By Building And Construction Materials, 2022 - 2032F |
6.2.4 Spain Quicklime Market Revenues & Volume, By Water Treatment, 2022 - 2032F |
6.2.5 Spain Quicklime Market Revenues & Volume, By Mining, 2022 - 2032F |
6.2.6 Spain Quicklime Market Revenues & Volume, By Chemicals, 2022 - 2032F |
6.2.7 Spain Quicklime Market Revenues & Volume, By Others, 2022 - 2032F |
7 Spain Quicklime Market Import-Export Trade Statistics |
7.1 Spain Quicklime Market Export to Major Countries |
7.2 Spain Quicklime Market Imports from Major Countries |
8 Spain Quicklime Market Key Performance Indicators |
8.1 Average selling price of quicklime in the market |
8.2 Percentage of quicklime used in environmental applications |
8.3 Growth rate of the construction industry in Spain |
8.4 Capacity utilization rate of quicklime production facilities |
8.5 Adoption rate of quicklime in alternative industries such as agriculture or mining |
9 Spain Quicklime Market - Opportunity Assessment |
9.1 Spain Quicklime Market Opportunity Assessment, By Types, 2022 & 2032F |
9.2 Spain Quicklime Market Opportunity Assessment, By Applications, 2022 & 2032F |
10 Spain Quicklime Market - Competitive Landscape |
10.1 Spain Quicklime Market Revenue Share, By Companies, 2025 |
10.2 Spain Quicklime Market Competitive Benchmarking, By Operating and Technical Parameters |
11 Company Profiles |
12 Recommendations |
13 Disclaimer |
Export potential assessment - trade Analytics for 2030
Export potential enables firms to identify high-growth global markets with greater confidence by combining advanced trade intelligence with a structured quantitative methodology. The framework analyzes emerging demand trends and country-level import patterns while integrating macroeconomic and trade datasets such as GDP and population forecasts, bilateral import–export flows, tariff structures, elasticity differentials between developed and developing economies, geographic distance, and import demand projections. Using weighted trade values from 2020–2024 as the base period to project country-to-country export potential for 2030, these inputs are operationalized through calculated drivers such as gravity model parameters, tariff impact factors, and projected GDP per-capita growth. Through an analysis of hidden potentials, demand hotspots, and market conditions that are most favorable to success, this method enables firms to focus on target countries, maximize returns, and global expansion with data, backed by accuracy.
By factoring in the projected importer demand gap that is currently unmet and could be potential opportunity, it identifies the potential for the Exporter (Country) among 190 countries, against the general trade analysis, which identifies the biggest importer or exporter.
To discover high-growth global markets and optimize your business strategy:
Click Here
Pricing
- Single User License$ 1,995
- Department License$ 2,400
- Site License$ 3,120
- Global License$ 3,795

Search
Thought Leadership and Analyst Meet


Our Clients
Latest Reports
- Philippines Polyhydroxybutyrate-co-Hydroxyvalerate Market (2026-2032) | Trends, Insights, Challenges, Restraints, Competition, Size, Value, Forecast, Pricing, Share, Outlook, Revenue, Investment Opportunities, Strategy, Drivers, Demand, Growth, segmentation, Analysis, Companies
- Peru Polyhydroxybutyrate-co-Hydroxyvalerate Market (2026-2032) | Growth, Demand, Challenges, Share, Trends, Analysis, Pricing, Investment Opportunities, Drivers, Value, Forecast, Competition, Size, Companies, Insights, Outlook, Restraints, segmentation, Revenue, Strategy
- Pakistan Polyhydroxybutyrate-co-Hydroxyvalerate Market (2026-2032) | Restraints, segmentation, Pricing, Forecast, Share, Strategy, Competition, Trends, Insights, Drivers, Challenges, Growth, Revenue, Outlook, Value, Investment Opportunities, Companies, Size, Analysis, Demand
- Oman Polyhydroxybutyrate-co-Hydroxyvalerate Market (2026-2032) | Drivers, segmentation, Insights, Competition, Pricing, Outlook, Size, Revenue, Challenges, Forecast, Analysis, Growth, Value, Share, Trends, Investment Opportunities, Strategy, Restraints, Companies, Demand
- Nigeria Polyhydroxybutyrate-co-Hydroxyvalerate Market (2026-2032) | Value, Investment Opportunities, Analysis, Revenue, Restraints, Pricing, Outlook, Competition, Demand, Growth, Forecast, Companies, Trends, Challenges, segmentation, Drivers, Insights, Share, Size, Strategy
- Nepal Polyhydroxybutyrate-co-Hydroxyvalerate Market (2026-2032) | Insights, Analysis, Drivers, Share, Revenue, Demand, segmentation, Investment Opportunities, Competition, Forecast, Growth, Pricing, Companies, Strategy, Trends, Restraints, Challenges, Outlook, Size, Value
- Myanmar Polyhydroxybutyrate-co-Hydroxyvalerate Market (2026-2032) | Outlook, Revenue, Strategy, Restraints, Drivers, segmentation, Share, Forecast, Competition, Insights, Growth, Pricing, Size, Demand, Value, Companies, Trends, Challenges, Investment Opportunities, Analysis
- Morocco Polyhydroxybutyrate-co-Hydroxyvalerate Market (2026-2032) | Outlook, Investment Opportunities, Restraints, Strategy, Forecast, Challenges, Drivers, Growth, Companies, segmentation, Trends, Size, Competition, Revenue, Demand, Insights, Share, Analysis, Value, Pricing
- Mexico Polyhydroxybutyrate-co-Hydroxyvalerate Market (2026-2032) | Size, Drivers, Outlook, Share, Strategy, Growth, Pricing, Challenges, Companies, Demand, Value, Investment Opportunities, Restraints, Trends, Forecast, segmentation, Analysis, Insights, Competition, Revenue
- Malaysia Polyhydroxybutyrate-co-Hydroxyvalerate Market (2026-2032) | Share, segmentation, Size, Companies, Analysis, Insights, Forecast, Value, Revenue, Drivers, Restraints, Challenges, Investment Opportunities, Trends, Competition, Strategy, Demand, Growth, Outlook, Pricing
Industry Events and Analyst Meet

HIMTEX 2026

India Refining Summit 2026

India EV Show 2026

EV tech India Expo 2026

Auto Tech Asia 2026
Whitepaper
- Middle East & Africa Commercial Security Market Click here to view more.
- Middle East & Africa Fire Safety Systems & Equipment Market Click here to view more.
- GCC Drone Market Click here to view more.
- Middle East Lighting Fixture Market Click here to view more.
- GCC Physical & Perimeter Security Market Click here to view more.
6WResearch In News
- Doha a strategic location for EV manufacturing hub: IPA Qatar
- Demand for luxury TVs surging in the GCC, says Samsung
- Empowering Growth: The Thriving Journey of Bangladesh’s Cable Industry
- Demand for luxury TVs surging in the GCC, says Samsung
- Video call with a traditional healer? Once unthinkable, it’s now common in South Africa
- Intelligent Buildings To Smooth GCC’s Path To Net Zero