Sri Lanka Bituminous Coal Market (2026-2032) Outlook | Value, Share, Analysis, Growth, Revenue, Industry, Trends, Companies, Size & Forecast
Market Forecast By Product Type (Gas Coal, Fat Coal, Lean Coal, Long Flame Coal, Other), By Applications (Electricity Industry, Chemical Industry, Cement Industry, Steel Industry, Other) And Competitive Landscape
| Product Code: ETC233731 | Publication Date: Aug 2022 | Updated Date: Mar 2026 | Product Type: Market Research Report | |
| Publisher: 6Wresearch | Author: Ravi Bhandari | No. of Pages: 75 | No. of Figures: 35 | No. of Tables: 20 |
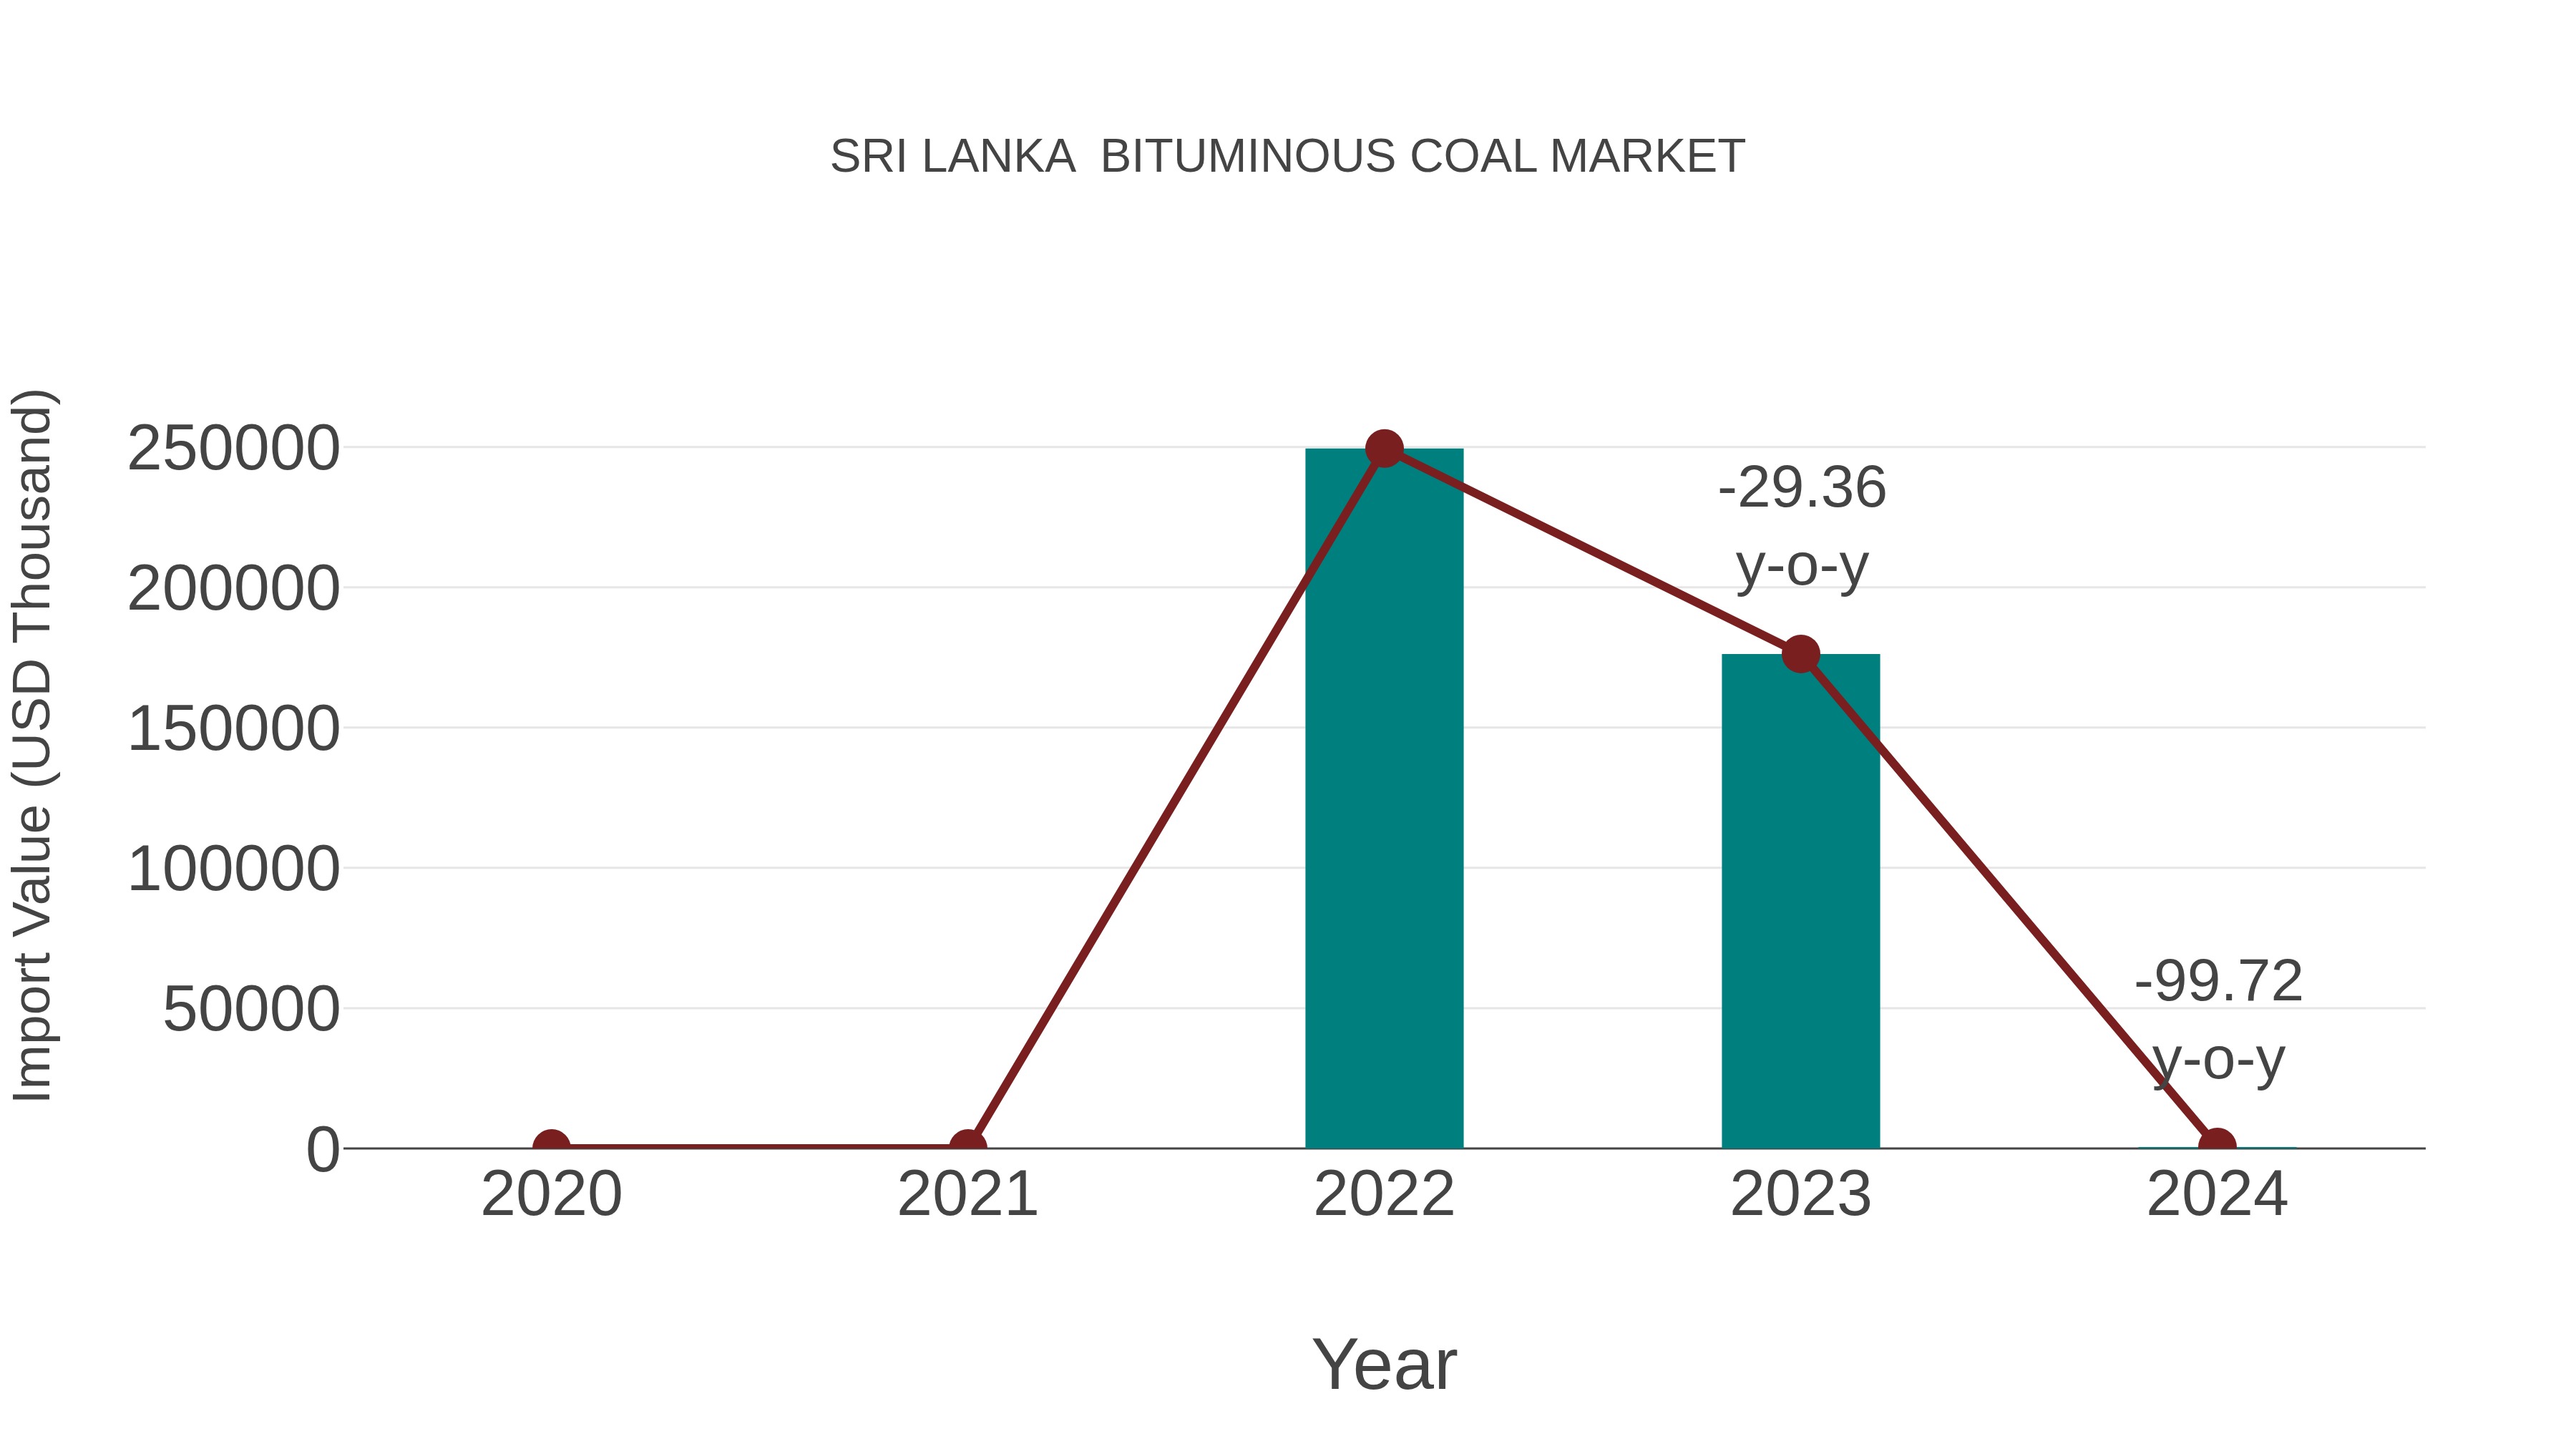
Sri Lanka Bituminous Coal Market: Import Trend Analysis
Sri Lanka import trend for bituminous coal market experienced a significant decline, with a growth rate of -99.72% from 2023 to 2024. The compound annual growth rate (CAGR) for 2020-2024 stood at -95.52%. This sharp decrease could be attributed to shifts in energy policies or a transition towards cleaner energy sources.
Sri Lanka Bituminous Coal Market Overview
The bituminous coal market in Sri Lanka is integral to the countrys energy sector. Despite a global move towards renewable energy, coal remains a significant source of energy for power generation in Sri Lanka. The market is influenced by international coal prices, import policies, and the ongoing debates about balancing energy needs with environmental concerns.
Drivers of the market
The bituminous coal market in Sri Lanka is primarily driven by the demand from the energy sector, where it is used as a major fuel source for electricity generation. The expanding industrial sector, particularly cement and steel production, also fuels the demand for bituminous coal. Additionally, the relatively lower cost of bituminous coal compared to other energy sources supports its continued use despite global shifts towards renewable energy.
Challenges of the market
The bituminous coal market in Sri Lanka faces environmental and regulatory pressures due to the high carbon emissions associated with coal combustion. There is increasing competition from cleaner energy sources such as natural gas, renewables, and hydroelectric power. Additionally, the countrys reliance on imported coal makes it vulnerable to global market fluctuations and supply chain disruptions, which can affect price stability and availability.
Government Policy of the market
The bituminous coal market in Sri Lanka is regulated by policies that balance energy needs with environmental concerns. The government imposes tariffs and taxes on coal imports to manage consumption and encourage the use of cleaner energy sources. Additionally, there are regulations to minimize the environmental impact of coal mining and combustion, including emissions standards and requirements for rehabilitation of mining sites.
Key Highlights of the Report:
- Sri Lanka Bituminous Coal Market Outlook
- Market Size of Sri Lanka Bituminous Coal Market, 2025
- Forecast of Sri Lanka Bituminous Coal Market, 2032
- Historical Data and Forecast of Sri Lanka Bituminous Coal Revenues & Volume for the Period 2022-2032F
- Sri Lanka Bituminous Coal Market Trend Evolution
- Sri Lanka Bituminous Coal Market Drivers and Challenges
- Sri Lanka Bituminous Coal Price Trends
- Sri Lanka Bituminous Coal Porter's Five Forces
- Sri Lanka Bituminous Coal Industry Life Cycle
- Historical Data and Forecast of Sri Lanka Bituminous Coal Market Revenues & Volume By Product Type for the Period 2022-2032F
- Historical Data and Forecast of Sri Lanka Bituminous Coal Market Revenues & Volume By Gas Coal for the Period 2022-2032F
- Historical Data and Forecast of Sri Lanka Bituminous Coal Market Revenues & Volume By Fat Coal for the Period 2022-2032F
- Historical Data and Forecast of Sri Lanka Bituminous Coal Market Revenues & Volume By Lean Coal for the Period 2022-2032F
- Historical Data and Forecast of Sri Lanka Bituminous Coal Market Revenues & Volume By Long Flame Coal for the Period 2022-2032F
- Historical Data and Forecast of Sri Lanka Bituminous Coal Market Revenues & Volume By Other for the Period 2022-2032F
- Historical Data and Forecast of Sri Lanka Bituminous Coal Market Revenues & Volume By Applications for the Period 2022-2032F
- Historical Data and Forecast of Sri Lanka Bituminous Coal Market Revenues & Volume By Electricity Industry for the Period 2022-2032F
- Historical Data and Forecast of Sri Lanka Bituminous Coal Market Revenues & Volume By Chemical Industry for the Period 2022-2032F
- Historical Data and Forecast of Sri Lanka Bituminous Coal Market Revenues & Volume By Cement Industry for the Period 2022-2032F
- Historical Data and Forecast of Sri Lanka Bituminous Coal Market Revenues & Volume By Steel Industry for the Period 2022-2032F
- Historical Data and Forecast of Sri Lanka Bituminous Coal Market Revenues & Volume By Other for the Period 2022-2032F
- Sri Lanka Bituminous Coal Import Export Trade Statistics
- Market Opportunity Assessment By Product Type
- Market Opportunity Assessment By Applications
- Sri Lanka Bituminous Coal Top Companies Market Share
- Sri Lanka Bituminous Coal Competitive Benchmarking By Technical and Operational Parameters
- Sri Lanka Bituminous Coal Company Profiles
- Sri Lanka Bituminous Coal Key Strategic Recommendations
Sri Lanka Bituminous Coal Market (2026-2032): FAQs
6Wresearch actively monitors the Sri Lanka Bituminous Coal Market and publishes its comprehensive annual report, highlighting emerging trends, growth drivers, revenue analysis, and forecast outlook. Our insights help businesses to make data-backed strategic decisions with ongoing market dynamics. Our analysts track relevent industries related to the Sri Lanka Bituminous Coal Market, allowing our clients with actionable intelligence and reliable forecasts tailored to emerging regional needs.
Yes, we provide customisation as per your requirements. To learn more, feel free to contact us on sales@6wresearch.com
1 Executive Summary |
2 Introduction |
2.1 Key Highlights of the Report |
2.2 Report Description |
2.3 Market Scope & Segmentation |
2.4 Research Methodology |
2.5 Assumptions |
3 Sri Lanka Bituminous Coal Market Overview |
3.1 Sri Lanka Country Macro Economic Indicators |
3.2 Sri Lanka Bituminous Coal Market Revenues & Volume, 2022 & 2032F |
3.3 Sri Lanka Bituminous Coal Market - Industry Life Cycle |
3.4 Sri Lanka Bituminous Coal Market - Porter's Five Forces |
3.5 Sri Lanka Bituminous Coal Market Revenues & Volume Share, By Product Type, 2022 & 2032F |
3.6 Sri Lanka Bituminous Coal Market Revenues & Volume Share, By Applications, 2022 & 2032F |
4 Sri Lanka Bituminous Coal Market Dynamics |
4.1 Impact Analysis |
4.2 Market Drivers |
4.2.1 Increasing industrialization in Sri Lanka leading to higher demand for bituminous coal |
4.2.2 Government initiatives to improve infrastructure and energy production |
4.2.3 Growth in the construction sector driving demand for bituminous coal |
4.3 Market Restraints |
4.3.1 Environmental concerns and regulations regarding coal usage |
4.3.2 Fluctuating international coal prices impacting local market stability |
5 Sri Lanka Bituminous Coal Market Trends |
6 Sri Lanka Bituminous Coal Market, By Types |
6.1 Sri Lanka Bituminous Coal Market, By Product Type |
6.1.1 Overview and Analysis |
6.1.2 Sri Lanka Bituminous Coal Market Revenues & Volume, By Product Type, 2022-2032F |
6.1.3 Sri Lanka Bituminous Coal Market Revenues & Volume, By Gas Coal, 2022-2032F |
6.1.4 Sri Lanka Bituminous Coal Market Revenues & Volume, By Fat Coal, 2022-2032F |
6.1.5 Sri Lanka Bituminous Coal Market Revenues & Volume, By Lean Coal, 2022-2032F |
6.1.6 Sri Lanka Bituminous Coal Market Revenues & Volume, By Long Flame Coal, 2022-2032F |
6.1.7 Sri Lanka Bituminous Coal Market Revenues & Volume, By Other, 2022-2032F |
6.2 Sri Lanka Bituminous Coal Market, By Applications |
6.2.1 Overview and Analysis |
6.2.2 Sri Lanka Bituminous Coal Market Revenues & Volume, By Electricity Industry, 2022-2032F |
6.2.3 Sri Lanka Bituminous Coal Market Revenues & Volume, By Chemical Industry, 2022-2032F |
6.2.4 Sri Lanka Bituminous Coal Market Revenues & Volume, By Cement Industry, 2022-2032F |
6.2.5 Sri Lanka Bituminous Coal Market Revenues & Volume, By Steel Industry, 2022-2032F |
6.2.6 Sri Lanka Bituminous Coal Market Revenues & Volume, By Other, 2022-2032F |
7 Sri Lanka Bituminous Coal Market Import-Export Trade Statistics |
7.1 Sri Lanka Bituminous Coal Market Export to Major Countries |
7.2 Sri Lanka Bituminous Coal Market Imports from Major Countries |
8 Sri Lanka Bituminous Coal Market Key Performance Indicators |
8.1 Average consumption of bituminous coal per capita in Sri Lanka |
8.2 Percentage of energy production in Sri Lanka coming from coal |
8.3 Number of infrastructure projects in Sri Lanka using bituminous coal as a fuel source |
9 Sri Lanka Bituminous Coal Market - Opportunity Assessment |
9.1 Sri Lanka Bituminous Coal Market Opportunity Assessment, By Product Type, 2022 & 2032F |
9.2 Sri Lanka Bituminous Coal Market Opportunity Assessment, By Applications, 2022 & 2032F |
10 Sri Lanka Bituminous Coal Market - Competitive Landscape |
10.1 Sri Lanka Bituminous Coal Market Revenue Share, By Companies, 2025 |
10.2 Sri Lanka Bituminous Coal Market Competitive Benchmarking, By Operating and Technical Parameters |
11 Company Profiles |
12 Recommendations |
13 Disclaimer |
Global Go To Market Strategy - 2030
Export potential enables firms to identify high-growth global markets with greater confidence by combining advanced trade intelligence with a structured quantitative methodology. The framework analyzes emerging demand trends and country-level import patterns while integrating macroeconomic and trade datasets such as GDP and population forecasts, bilateral import–export flows, tariff structures, elasticity differentials between developed and developing economies, geographic distance, and import demand projections. Using weighted trade values from 2020–2024 as the base period to project country-to-country export potential for 2030, these inputs are operationalized through calculated drivers such as gravity model parameters, tariff impact factors, and projected GDP per-capita growth. Through an analysis of hidden potentials, demand hotspots, and market conditions that are most favorable to success, this method enables firms to focus on target countries, maximize returns, and global expansion with data, backed by accuracy.
By factoring in the projected importer demand gap that is currently unmet and could be potential opportunity, it identifies the potential for the Exporter (Country) among 190 countries, against the general trade analysis, which identifies the biggest importer or exporter.
To discover high-growth global markets and optimize your business strategy:
Click Here
Pricing
- Single User License$ 1,995
- Department License$ 2,400
- Site License$ 3,120
- Global License$ 3,795

Leadership Perspectives from Industry Events
Search
Thought Leadership and Analyst Meet


Our Clients
6WResearch In News
- India Air Conditioner Market Set for Strong Rebound in 2026 After Weather-Led Correction and GST-Driven Recovery: 6Wresearch
- ADAS in India: How Automatic Emergency Braking, Blind Spot Detection & Driver Monitoring are Transforming Road Safety
- Doha a strategic location for EV manufacturing hub: IPA Qatar
- Demand for luxury TVs surging in the GCC, says Samsung
- Empowering Growth: The Thriving Journey of Bangladesh’s Cable Industry
- Demand for luxury TVs surging in the GCC, says Samsung
Latest Reports
- Poland Fire Protection Systems Market (2026-2032)
- Cape Verde Portable Hand-Thrown Extinguisher Market (2026-2032)
- Canada Portable Hand-Thrown Extinguisher Market (2026-2032)
- Cameroon Portable Hand-Thrown Extinguisher Market (2026-2032)
- Burundi Portable Hand-Thrown Extinguisher Market (2026-2032)
- Burkina Faso Portable Hand-Thrown Extinguisher Market (2026-2032)
- Bulgaria Portable Hand-Thrown Extinguisher Market (2026-2032)
- Brunei Portable Hand-Thrown Extinguisher Market (2026-2032)
- Botswana Portable Hand-Thrown Extinguisher Market (2026-2032)
- Bosnia and Herzegovina Portable Hand-Thrown Extinguisher Market (2026-2032)
Industry Events and Analyst Meet

HIMTEX 2026

India Refining Summit 2026

India EV Show 2026

EV tech India Expo 2026

Auto Tech Asia 2026
Whitepaper
- Middle East & Africa Commercial Security Market Click here to view more.
- Middle East & Africa Fire Safety Systems & Equipment Market Click here to view more.
- GCC Drone Market Click here to view more.
- Middle East Lighting Fixture Market Click here to view more.
- GCC Physical & Perimeter Security Market Click here to view more.