Sri Lanka Calcium Propionate Market (2026-2032) Outlook | Size, Revenue, Growth, Forecast, Analysis, Industry, Trends, Share, Value & Companies
Market Forecast By Application (Food Bakery Products, Dairy & Frozen Desserts, Meat, Fish & Seafood Products), By Form (Dry , Liquid) And Competitive Landscape
| Product Code: ETC4546112 | Publication Date: Jul 2023 | Updated Date: Mar 2026 | Product Type: Report | |
| Publisher: 6Wresearch | Author: Ravi Bhandari | No. of Pages: 85 | No. of Figures: 45 | No. of Tables: 25 |
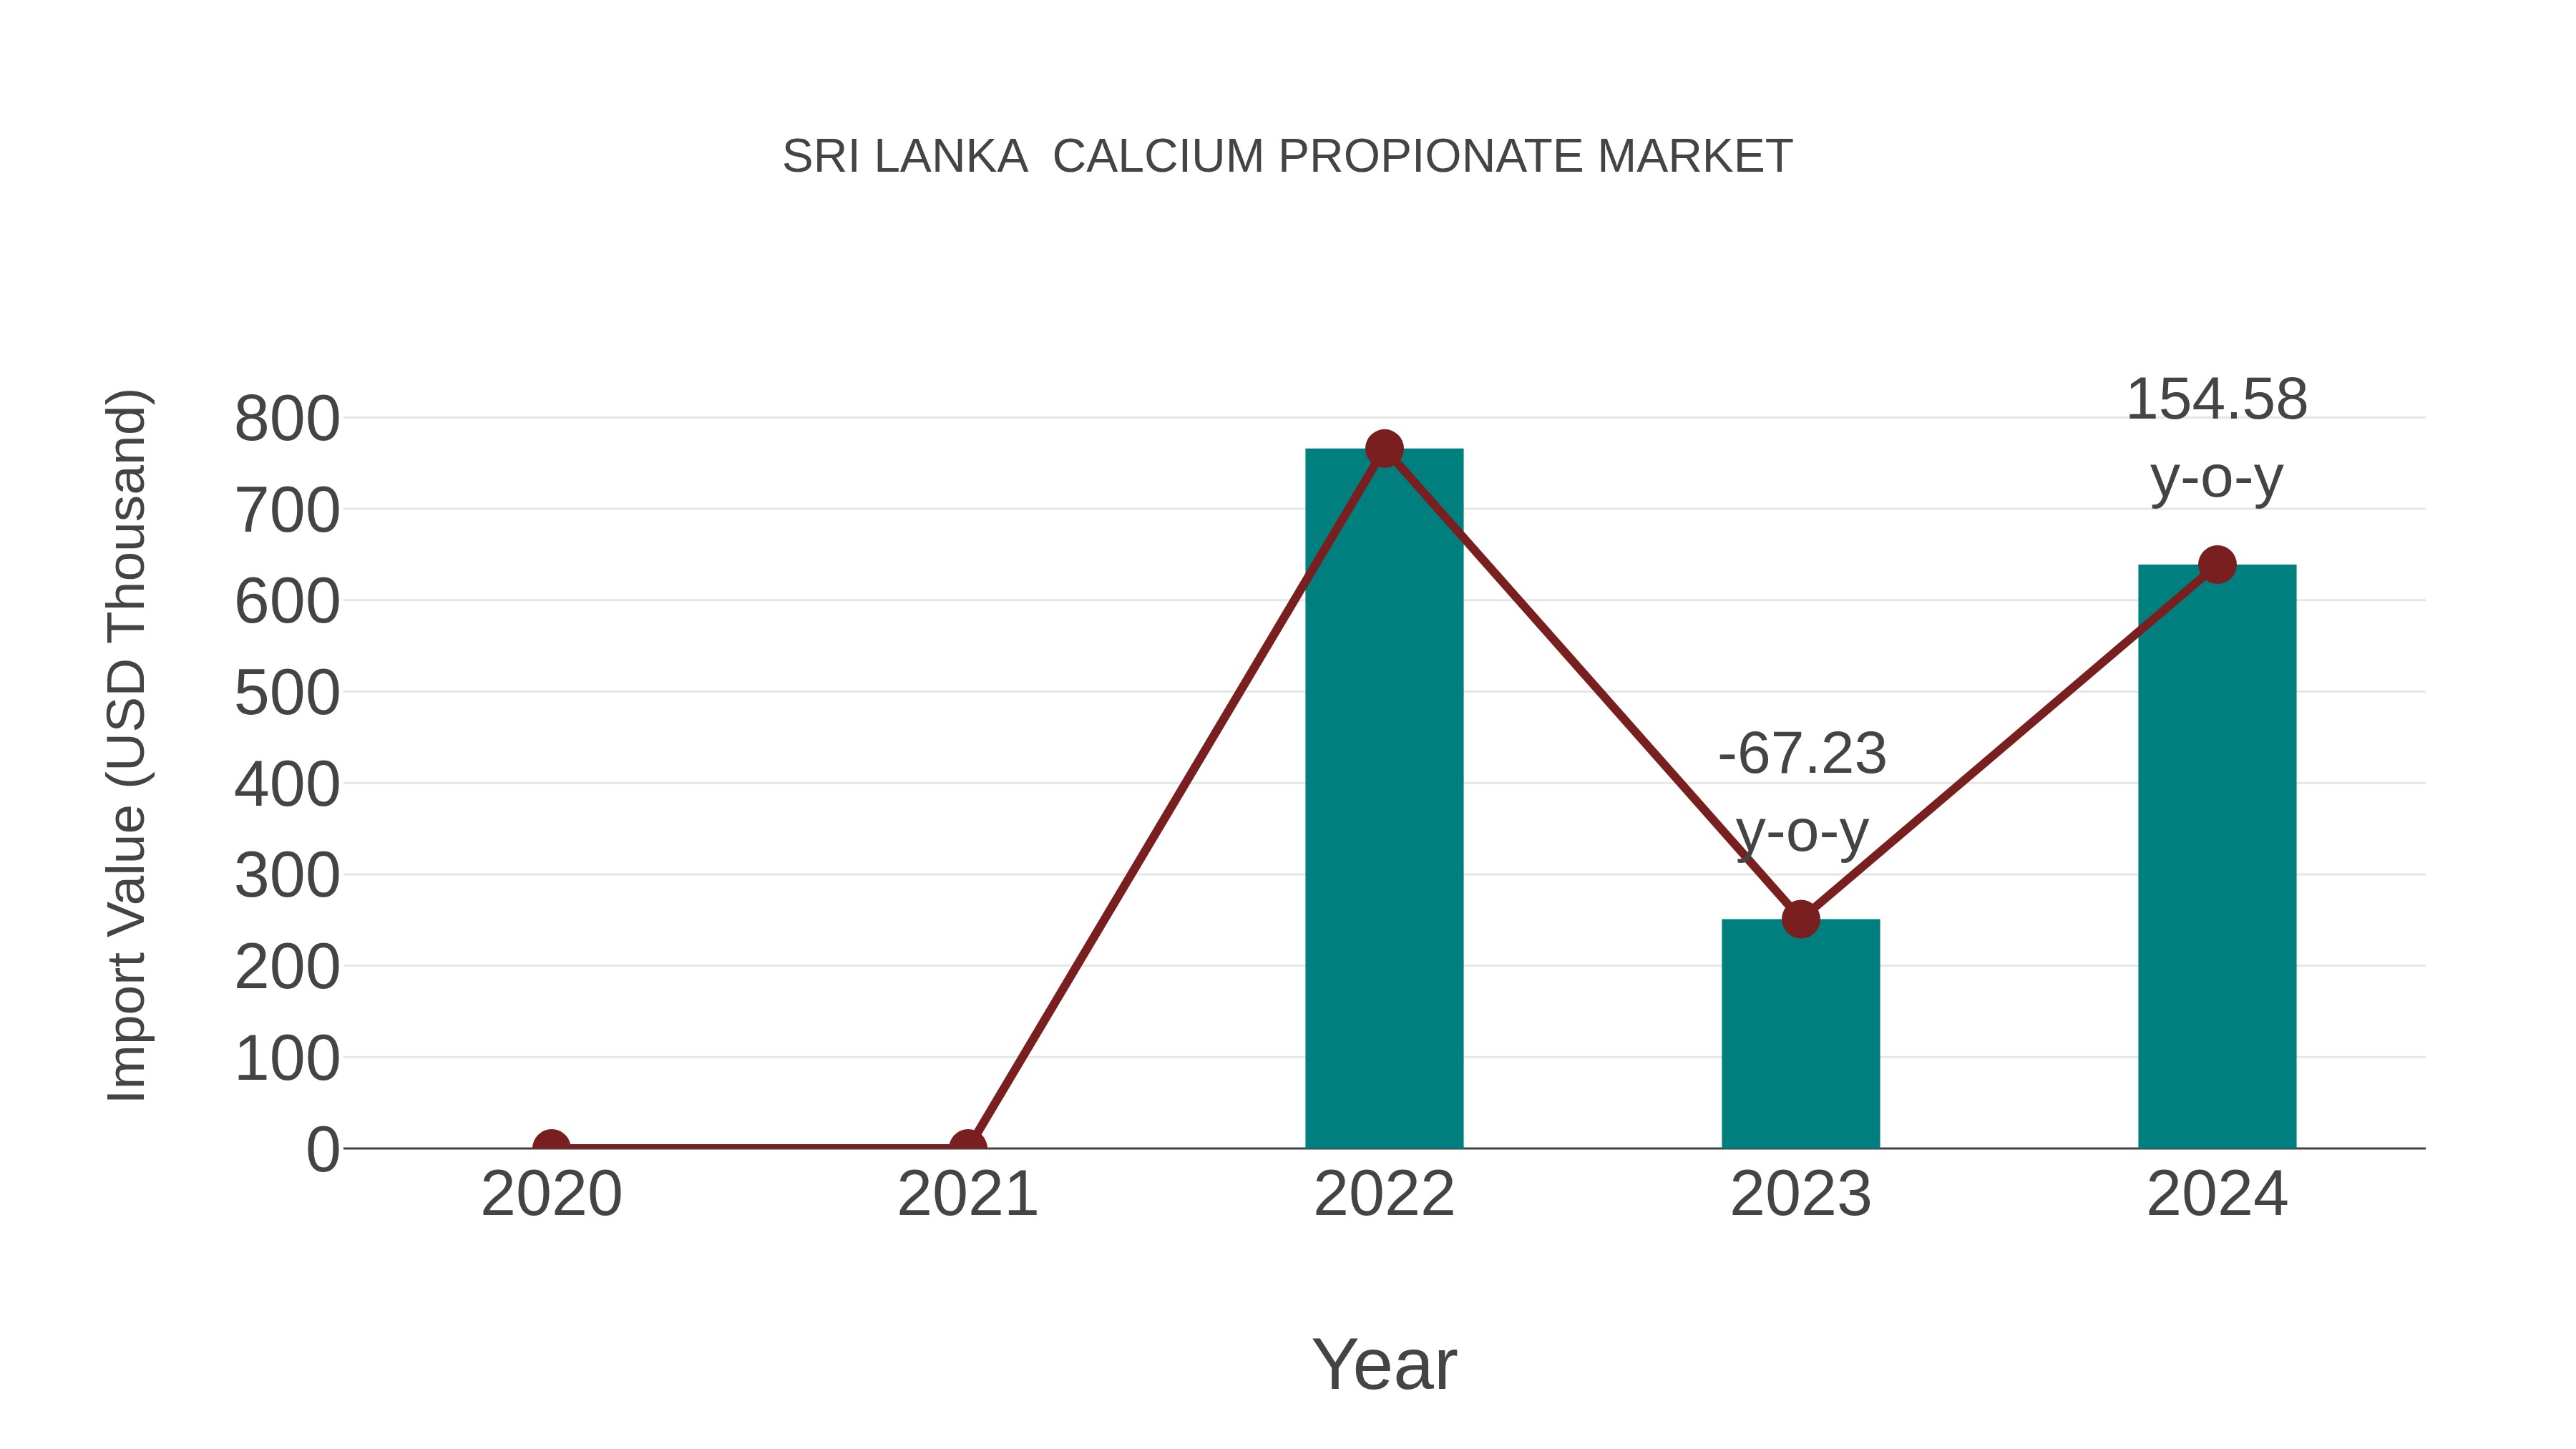
Sri Lanka Calcium Propionate Market: Import Trend Analysis
Sri Lanka import trend for calcium propionate saw significant growth from 2023 to 2024 at 154.58%, while the compound annual growth rate (CAGR) for 2020-2024 stood at -8.67%. This increase in imports can be attributed to evolving consumer preferences towards packaged and processed foods, driving demand for preservatives like calcium propionate.
Sri Lanka Calcium Propionate Market Overview
Sri Lanka calcium propionate market is growing, driven by its use as a preservative in the food industry. It is widely used in bakery products, dairy items, and other perishables to extend shelf life and prevent microbial growth. The increasing demand for convenience foods and the growing bakery sector are key factors propelling the market. Health concerns related to food safety are also boosting the use of calcium propionate as a preservative. Market participants are investing in research to develop more effective and safer preservatives to meet consumer demands and regulatory standards.
Drivers of the market
The Sri Lanka calcium propionate market is driven by its widespread use as a preservative in the food industry, particularly in bakery products, to extend shelf life and prevent mold growth. The increasing consumer preference for convenient and ready-to-eat foods boosts the demand for calcium propionate. Additionally, the growth of the dairy industry, where it is used to prevent spoilage in cheese and other dairy products, contributes to market expansion. The rising awareness of food safety and the implementation of stringent food preservation standards further drive market growth. Innovations in food preservation technologies and the development of natural preservatives also impact the market positively.
Challenges of the market
The calcium propionate market in Sri Lanka is challenged by rising health concerns and changing consumer preferences. As a food preservative, calcium propionate faces scrutiny over potential health effects, leading consumers to opt for natural or organic alternatives. This shift in consumer behavior reduces the demand for synthetic preservatives. Additionally, the market faces competition from other preservatives that may offer better cost-efficiency or preservative qualities.
Government Policy of the market
In the calcium propionate market, government regulations focus on food safety and preservation. The Ministry of Health sets guidelines for the permissible levels of calcium propionate in food products to prevent spoilage while ensuring consumer safety. Policies also encourage the development of the local food processing industry, providing incentives for the use of approved preservatives like calcium propionate. Import regulations ensure that all food additives meet national safety standards.
Key Highlights of the Report:
- Sri Lanka Calcium Propionate Market Outlook
- Market Size of Sri Lanka Calcium Propionate Market, 2025
- Forecast of Sri Lanka Calcium Propionate Market, 2032
- Historical Data and Forecast of Sri Lanka Calcium Propionate Revenues & Volume for the Period 2022-2032F
- Sri Lanka Calcium Propionate Market Trend Evolution
- Sri Lanka Calcium Propionate Market Drivers and Challenges
- Sri Lanka Calcium Propionate Price Trends
- Sri Lanka Calcium Propionate Porter's Five Forces
- Sri Lanka Calcium Propionate Industry Life Cycle
- Historical Data and Forecast of Sri Lanka Calcium Propionate Market Revenues & Volume By Application for the Period 2022-2032F
- Historical Data and Forecast of Sri Lanka Calcium Propionate Market Revenues & Volume By Food Bakery Products for the Period 2022-2032F
- Historical Data and Forecast of Sri Lanka Calcium Propionate Market Revenues & Volume By Dairy & Frozen Desserts for the Period 2022-2032F
- Historical Data and Forecast of Sri Lanka Calcium Propionate Market Revenues & Volume By Meat for the Period 2022-2032F
- Historical Data and Forecast of Sri Lanka Calcium Propionate Market Revenues & Volume By Fish & Seafood Products for the Period 2022-2032F
- Historical Data and Forecast of Sri Lanka Calcium Propionate Market Revenues & Volume By Form for the Period 2022-2032F
- Historical Data and Forecast of Sri Lanka Calcium Propionate Market Revenues & Volume By Dry for the Period 2022-2032F
- Historical Data and Forecast of Sri Lanka Calcium Propionate Market Revenues & Volume By Liquid for the Period 2022-2032F
- Sri Lanka Calcium Propionate Import Export Trade Statistics
- Market Opportunity Assessment By Application
- Market Opportunity Assessment By Form
- Sri Lanka Calcium Propionate Top Companies Market Share
- Sri Lanka Calcium Propionate Competitive Benchmarking By Technical and Operational Parameters
- Sri Lanka Calcium Propionate Company Profiles
- Sri Lanka Calcium Propionate Key Strategic Recommendations
Sri Lanka Calcium Propionate Market (2026-2032): FAQs
6Wresearch actively monitors the Sri Lanka Calcium Propionate Market and publishes its comprehensive annual report, highlighting emerging trends, growth drivers, revenue analysis, and forecast outlook. Our insights help businesses to make data-backed strategic decisions with ongoing market dynamics. Our analysts track relevent industries related to the Sri Lanka Calcium Propionate Market, allowing our clients with actionable intelligence and reliable forecasts tailored to emerging regional needs.
Yes, we provide customisation as per your requirements. To learn more, feel free to contact us on sales@6wresearch.com
1 Executive Summary |
2 Introduction |
2.1 Key Highlights of the Report |
2.2 Report Description |
2.3 Market Scope & Segmentation |
2.4 Research Methodology |
2.5 Assumptions |
3 Sri Lanka Calcium Propionate Market Overview |
3.1 Sri Lanka Country Macro Economic Indicators |
3.2 Sri Lanka Calcium Propionate Market Revenues & Volume, 2022 & 2032F |
3.3 Sri Lanka Calcium Propionate Market - Industry Life Cycle |
3.4 Sri Lanka Calcium Propionate Market - Porter's Five Forces |
3.5 Sri Lanka Calcium Propionate Market Revenues & Volume Share, By Application, 2022 & 2032F |
3.6 Sri Lanka Calcium Propionate Market Revenues & Volume Share, By Form, 2022 & 2032F |
4 Sri Lanka Calcium Propionate Market Dynamics |
4.1 Impact Analysis |
4.2 Market Drivers |
4.2.1 Increasing awareness about food safety and quality standards |
4.2.2 Growing demand for packaged and convenience foods |
4.2.3 Rising health consciousness among consumers |
4.3 Market Restraints |
4.3.1 Fluctuating prices of raw materials |
4.3.2 Stringent government regulations on food additives |
4.3.3 Limited availability of calcium propionate substitutes |
5 Sri Lanka Calcium Propionate Market Trends |
6 Sri Lanka Calcium Propionate Market, By Types |
6.1 Sri Lanka Calcium Propionate Market, By Application |
6.1.1 Overview and Analysis |
6.1.2 Sri Lanka Calcium Propionate Market Revenues & Volume, By Application, 2022-2032F |
6.1.3 Sri Lanka Calcium Propionate Market Revenues & Volume, By Food Bakery Products, 2022-2032F |
6.1.4 Sri Lanka Calcium Propionate Market Revenues & Volume, By Dairy & Frozen Desserts, 2022-2032F |
6.1.5 Sri Lanka Calcium Propionate Market Revenues & Volume, By Meat, 2022-2032F |
6.1.6 Sri Lanka Calcium Propionate Market Revenues & Volume, By Fish & Seafood Products, 2022-2032F |
6.2 Sri Lanka Calcium Propionate Market, By Form |
6.2.1 Overview and Analysis |
6.2.2 Sri Lanka Calcium Propionate Market Revenues & Volume, By Dry , 2022-2032F |
6.2.3 Sri Lanka Calcium Propionate Market Revenues & Volume, By Liquid, 2022-2032F |
7 Sri Lanka Calcium Propionate Market Import-Export Trade Statistics |
7.1 Sri Lanka Calcium Propionate Market Export to Major Countries |
7.2 Sri Lanka Calcium Propionate Market Imports from Major Countries |
8 Sri Lanka Calcium Propionate Market Key Performance Indicators |
8.1 Consumer acceptance and preference for calcium propionate in food products |
8.2 Number of food manufacturers incorporating calcium propionate in their product formulations |
8.3 Research and development investment in enhancing the effectiveness and applications of calcium propionate |
9 Sri Lanka Calcium Propionate Market - Opportunity Assessment |
9.1 Sri Lanka Calcium Propionate Market Opportunity Assessment, By Application, 2022 & 2032F |
9.2 Sri Lanka Calcium Propionate Market Opportunity Assessment, By Form, 2022 & 2032F |
10 Sri Lanka Calcium Propionate Market - Competitive Landscape |
10.1 Sri Lanka Calcium Propionate Market Revenue Share, By Companies, 2025 |
10.2 Sri Lanka Calcium Propionate Market Competitive Benchmarking, By Operating and Technical Parameters |
11 Company Profiles |
12 Recommendations |
13 Disclaimer |
Global Go To Market Strategy - 2030
Export potential enables firms to identify high-growth global markets with greater confidence by combining advanced trade intelligence with a structured quantitative methodology. The framework analyzes emerging demand trends and country-level import patterns while integrating macroeconomic and trade datasets such as GDP and population forecasts, bilateral import–export flows, tariff structures, elasticity differentials between developed and developing economies, geographic distance, and import demand projections. Using weighted trade values from 2020–2024 as the base period to project country-to-country export potential for 2030, these inputs are operationalized through calculated drivers such as gravity model parameters, tariff impact factors, and projected GDP per-capita growth. Through an analysis of hidden potentials, demand hotspots, and market conditions that are most favorable to success, this method enables firms to focus on target countries, maximize returns, and global expansion with data, backed by accuracy.
By factoring in the projected importer demand gap that is currently unmet and could be potential opportunity, it identifies the potential for the Exporter (Country) among 190 countries, against the general trade analysis, which identifies the biggest importer or exporter.
To discover high-growth global markets and optimize your business strategy:
Click Here
Pricing
- Single User License$ 1,995
- Department License$ 2,400
- Site License$ 3,120
- Global License$ 3,795

Leadership Perspectives from Industry Events
Search
Thought Leadership and Analyst Meet


Our Clients
6WResearch In News
- Doha a strategic location for EV manufacturing hub: IPA Qatar
- Demand for luxury TVs surging in the GCC, says Samsung
- Empowering Growth: The Thriving Journey of Bangladesh’s Cable Industry
- Demand for luxury TVs surging in the GCC, says Samsung
- Video call with a traditional healer? Once unthinkable, it’s now common in South Africa
- Intelligent Buildings To Smooth GCC’s Path To Net Zero
Latest Reports
- Taiwan Airport Wireless Infrastructure Market (2026-2032)
- Vietnam Airport Wireless Infrastructure Market (2026-2032)
- Thailand Airport Wireless Infrastructure Market (2026-2032)
- South Korea Airport Wireless Infrastructure Market (2026-2032)
- Romania Airport Wireless Infrastructure Market (2026-2032)
- Qatar Airport Wireless Infrastructure Market (2026-2032)
- Philippines Airport Wireless Infrastructure Market (2026-2032)
- Japan Airport Wireless Infrastructure Market (2026-2032)
- Taiwan Airport Winter Services Market (2026-2032)
- Vietnam Airport Winter Services Market (2026-2032)
Industry Events and Analyst Meet

HIMTEX 2026

India Refining Summit 2026

India EV Show 2026

EV tech India Expo 2026

Auto Tech Asia 2026
Whitepaper
- Middle East & Africa Commercial Security Market Click here to view more.
- Middle East & Africa Fire Safety Systems & Equipment Market Click here to view more.
- GCC Drone Market Click here to view more.
- Middle East Lighting Fixture Market Click here to view more.
- GCC Physical & Perimeter Security Market Click here to view more.