Sri Lanka Candy Market (2020-2026) | Forecast, Outlook, Trends, Share, Companies, Size, COVID-19 IMPACT, Growth, Value, Analysis, Revenue & Industry
Market Forecast By Product Type (Chocolate Candy, Non-Chocolate Candy), By Distribution (Supermarkets and Hypermarkets, Convenience Stores, Specalist Retailers, Online Retail, Others) And Competitive Landscape
| Product Code: ETC040152 | Publication Date: Jan 2021 | Updated Date: Feb 2026 | Product Type: Report | |
| Publisher: 6Wresearch | Author: Ravi Bhandari | No. of Pages: 70 | No. of Figures: 35 | No. of Tables: 5 |
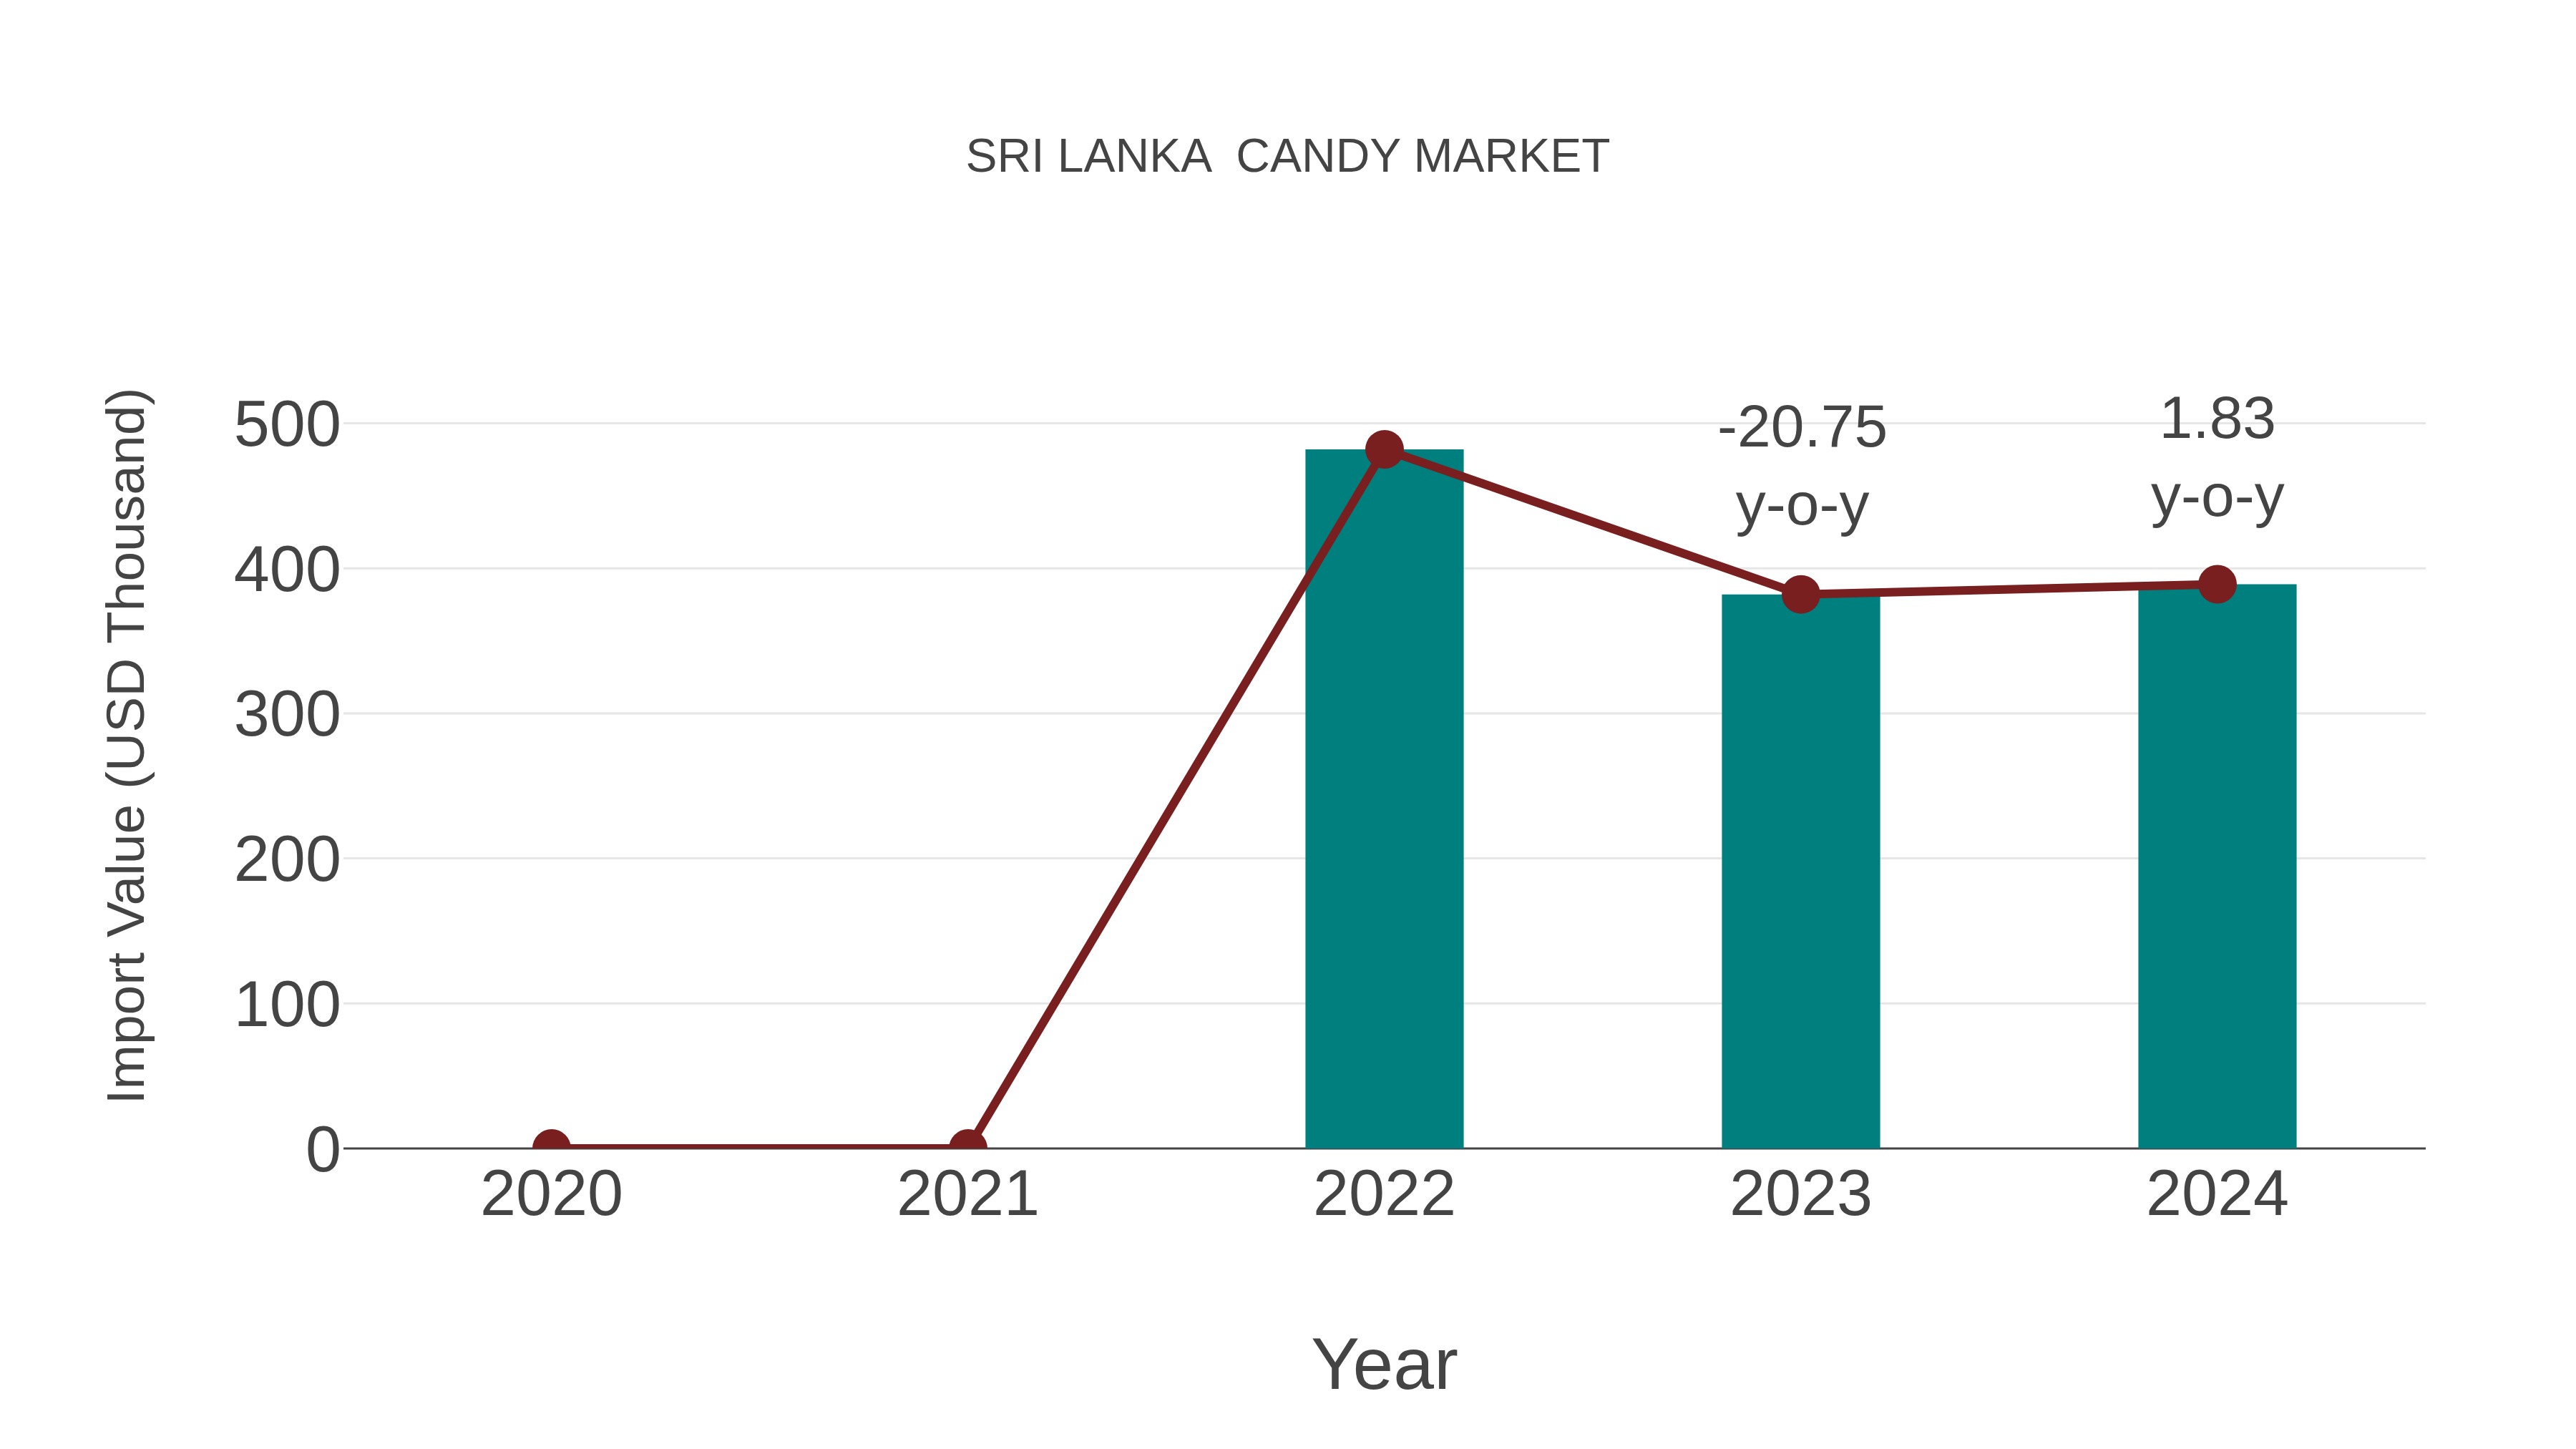
Sri Lanka Candy Market: Import Trend Analysis
Sri Lanka candy market saw a 1.83% import growth rate from 2023 to 2024, with a -10.16% CAGR from 2020 to 2024. This decline could be attributed to shifts in consumer preferences or changes in trade policies impacting imports.
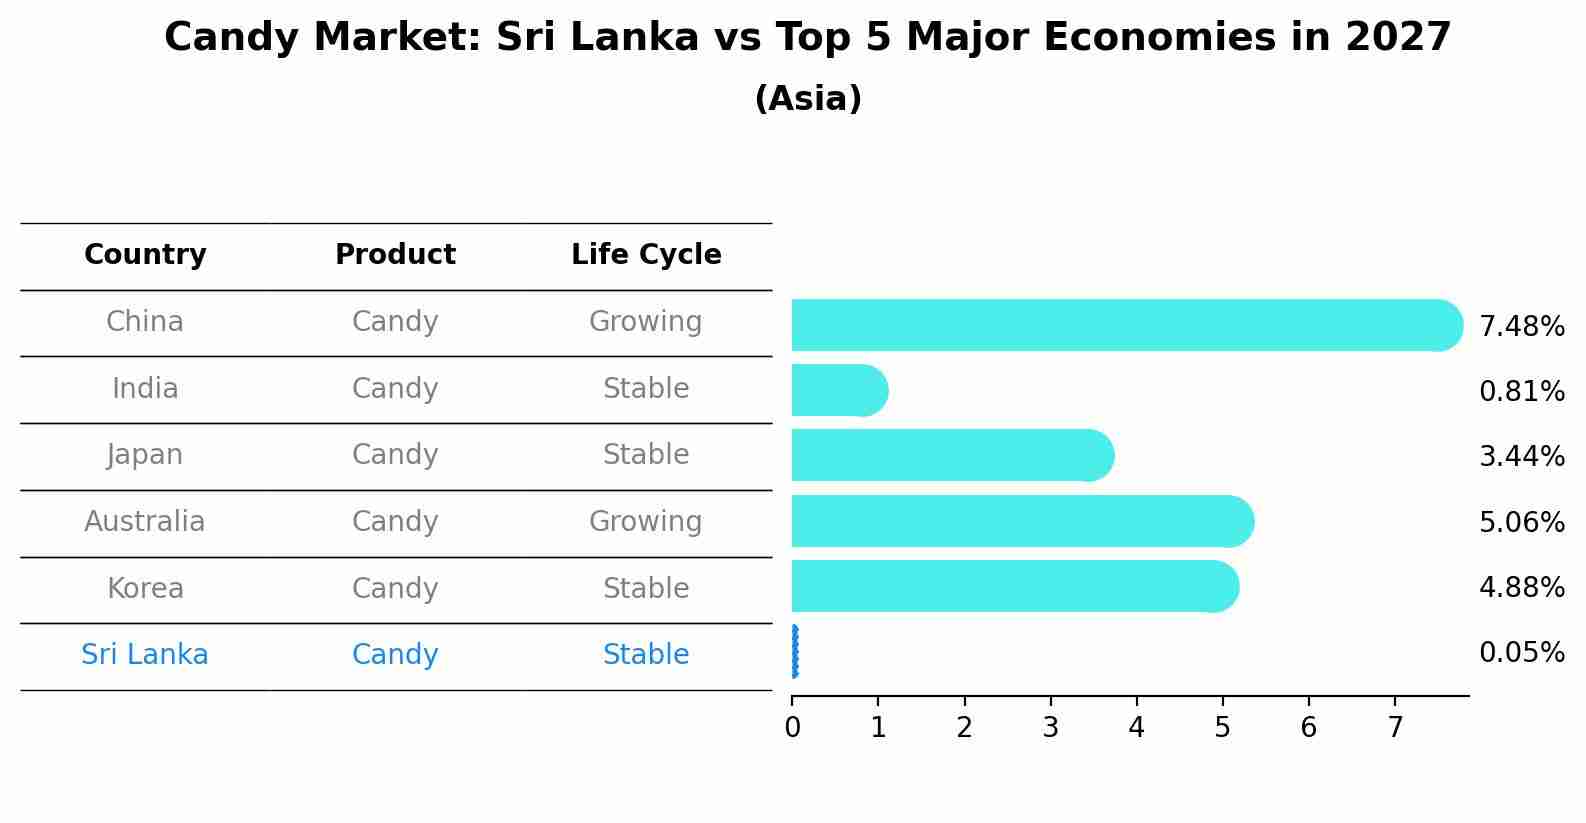
Candy Market: Sri Lanka vs Top 5 Major Economies in 2027 (Asia)
In the Asia region, the Candy market in Sri Lanka is projected to expand at a stable growth rate of 0.05% by 2027. The largest economy is China, followed by India, Japan, Australia and South Korea.
Sri Lanka Candy Market Overview
The candy market in Sri Lanka is characterized by a variety of local and imported confectionery products. Popular among both children and adults, candies are widely available through retail outlets and online platforms. The market dynamics are influenced by seasonal trends, cultural festivities, and consumer preferences for different flavors and textures.
Drivers of the market
The candy market in Sri Lanka is experiencing growth due to several factors, including increasing consumer spending on confectionery products and the growing influence of Western lifestyles and tastes. A younger demographic with a preference for sweet treats and the introduction of innovative flavors and healthier candy options also contribute to market expansion. Seasonal demand during festivals and celebrations further boosts sales. Additionally, effective marketing strategies and the availability of candies in various price ranges cater to a wide audience, driving the market forward.
Challenges of the market
The candy market in Sri Lanka grapples with health concerns among consumers who are increasingly wary of high sugar intake. This shift towards healthier lifestyles poses a significant challenge as manufacturers must adapt their products to meet changing preferences without compromising on taste. Additionally, the market is affected by economic factors such as rising production costs and the need to import certain ingredients, which can lead to higher retail prices. Competition from international brands that benefit from better economies of scale further complicates the landscape for local producers.
Government Policy of the market
The Sri Lankan candy market is regulated to ensure food safety and quality standards are met. The government has established stringent guidelines for manufacturers regarding the use of additives and preservatives, which are enforced by the Food Control Administration Unit. There are also policies to support local candy manufacturers through tax incentives and low-interest loans. Promotional campaigns are conducted to boost the consumption of locally produced candy, aiming to reduce dependence on imports. Additionally, efforts are made to modernize production facilities and enhance the competitiveness of the local candy industry.
Key Highlights of the Report:
- Sri Lanka Candy Market Outlook
- Market Size of Sri Lanka Candy Market, 2019
- Forecast of Sri Lanka Candy Market, 2026
- Historical Data and Forecast of Sri Lanka Candy Revenues & Volume for the Period 2016 - 2026
- Sri Lanka Candy Market Trend Evolution
- Sri Lanka Candy Market Drivers and Challenges
- Sri Lanka Candy Price Trends
- Sri Lanka Candy Porter's Five Forces
- Sri Lanka Candy Industry Life Cycle
- Historical Data and Forecast of Sri Lanka Candy Market Revenues & Volume By Product Type for the Period 2016 - 2026
- Historical Data and Forecast of Sri Lanka Candy Market Revenues & Volume By Chocolate Candy for the Period 2016 - 2026
- Historical Data and Forecast of Sri Lanka Candy Market Revenues & Volume By Non-Chocolate Candy for the Period 2016 - 2026
- Historical Data and Forecast of Sri Lanka Candy Market Revenues & Volume By Distribution for the Period 2016 - 2026
- Historical Data and Forecast of Sri Lanka Candy Market Revenues & Volume By Supermarkets and Hypermarkets for the Period 2016 - 2026
- Historical Data and Forecast of Sri Lanka Candy Market Revenues & Volume By Convenience Stores for the Period 2016 - 2026
- Historical Data and Forecast of Sri Lanka Candy Market Revenues & Volume By Specalist Retailers for the Period 2016 - 2026
- Historical Data and Forecast of Sri Lanka Candy Market Revenues & Volume By Online Retail for the Period 2016 - 2026
- Historical Data and Forecast of Sri Lanka Candy Market Revenues & Volume By Others for the Period 2016 - 2026
- Sri Lanka Candy Import Export Trade Statistics
- Market Opportunity Assessment By Product Type
- Market Opportunity Assessment By Distribution
- Sri Lanka Candy Top Companies Market Share
- Sri Lanka Candy Competitive Benchmarking By Technical and Operational Parameters
- Sri Lanka Candy Company Profiles
- Sri Lanka Candy Key Strategic Recommendations
Frequently Asked Questions About the Market Study (FAQs):
6Wresearch actively monitors the Sri Lanka Candy Market and publishes its comprehensive annual report, highlighting emerging trends, growth drivers, revenue analysis, and forecast outlook. Our insights help businesses to make data-backed strategic decisions with ongoing market dynamics. Our analysts track relevent industries related to the Sri Lanka Candy Market, allowing our clients with actionable intelligence and reliable forecasts tailored to emerging regional needs.
Yes, we provide customisation as per your requirements. To learn more, feel free to contact us on sales@6wresearch.com
1 Executive Summary |
2 Introduction |
2.1 Key Highlights of the Report |
2.2 Report Description |
2.3 Market Scope & Segmentation |
2.4 Research Methodology |
2.5 Assumptions |
3 Sri Lanka Candy Market Overview |
3.1 Sri Lanka Country Macro Economic Indicators |
3.2 Sri Lanka Candy Market Revenues & Volume, 2019 & 2026F |
3.3 Sri Lanka Candy Market - Industry Life Cycle |
3.4 Sri Lanka Candy Market - Porter's Five Forces |
3.5 Sri Lanka Candy Market Revenues & Volume Share, By Product Type, 2019 & 2026F |
3.6 Sri Lanka Candy Market Revenues & Volume Share, By Distribution, 2019 & 2026F |
4 Sri Lanka Candy Market Dynamics |
4.1 Impact Analysis |
4.2 Market Drivers |
4.3 Market Restraints |
5 Sri Lanka Candy Market Trends |
6 Sri Lanka Candy Market, By Types |
6.1 Sri Lanka Candy Market, By Product Type |
6.1.1 Overview and Analysis |
6.1.2 Sri Lanka Candy Market Revenues & Volume, By Product Type, 2016 - 2026F |
6.1.3 Sri Lanka Candy Market Revenues & Volume, By Chocolate Candy, 2016 - 2026F |
6.1.4 Sri Lanka Candy Market Revenues & Volume, By Non-Chocolate Candy, 2016 - 2026F |
6.2 Sri Lanka Candy Market, By Distribution |
6.2.1 Overview and Analysis |
6.2.2 Sri Lanka Candy Market Revenues & Volume, By Supermarkets and Hypermarkets, 2016 - 2026F |
6.2.3 Sri Lanka Candy Market Revenues & Volume, By Convenience Stores, 2016 - 2026F |
6.2.4 Sri Lanka Candy Market Revenues & Volume, By Specalist Retailers, 2016 - 2026F |
6.2.5 Sri Lanka Candy Market Revenues & Volume, By Online Retail, 2016 - 2026F |
6.2.6 Sri Lanka Candy Market Revenues & Volume, By Others, 2016 - 2026F |
7 Sri Lanka Candy Market Import-Export Trade Statistics |
7.1 Sri Lanka Candy Market Export to Major Countries |
7.2 Sri Lanka Candy Market Imports from Major Countries |
8 Sri Lanka Candy Market Key Performance Indicators |
9 Sri Lanka Candy Market - Opportunity Assessment |
9.1 Sri Lanka Candy Market Opportunity Assessment, By Product Type, 2019 & 2026F |
9.2 Sri Lanka Candy Market Opportunity Assessment, By Distribution, 2019 & 2026F |
10 Sri Lanka Candy Market - Competitive Landscape |
10.1 Sri Lanka Candy Market Revenue Share, By Companies, 2019 |
10.2 Sri Lanka Candy Market Competitive Benchmarking, By Operating and Technical Parameters |
11 Company Profiles |
12 Recommendations |
13 Disclaimer |
Export potential assessment - trade Analytics for 2030
Export potential enables firms to identify high-growth global markets with greater confidence by combining advanced trade intelligence with a structured quantitative methodology. The framework analyzes emerging demand trends and country-level import patterns while integrating macroeconomic and trade datasets such as GDP and population forecasts, bilateral import–export flows, tariff structures, elasticity differentials between developed and developing economies, geographic distance, and import demand projections. Using weighted trade values from 2020–2024 as the base period to project country-to-country export potential for 2030, these inputs are operationalized through calculated drivers such as gravity model parameters, tariff impact factors, and projected GDP per-capita growth. Through an analysis of hidden potentials, demand hotspots, and market conditions that are most favorable to success, this method enables firms to focus on target countries, maximize returns, and global expansion with data, backed by accuracy.
By factoring in the projected importer demand gap that is currently unmet and could be potential opportunity, it identifies the potential for the Exporter (Country) among 190 countries, against the general trade analysis, which identifies the biggest importer or exporter.
To discover high-growth global markets and optimize your business strategy:
Click Here
Pricing
- Single User License$ 1,995
- Department License$ 2,400
- Site License$ 3,120
- Global License$ 3,795

Search
Thought Leadership and Analyst Meet


Our Clients
Latest Reports
- Taiwan Food Delivery Platform Market (2026-2032) | Companies, Outlook, Analysis, Trends, Value, Revenue, Segmentation, Share, Forecast, Competitive Landscape, Growth, Size & Forecast
- United Kingdom (UK) Long-term Care Insurance Market (2026-2032) | Growth, Share, Consumer Insights, Drivers, Opportunities, Competition, Pricing Analysis, Segments, Restraints, Companies, Competitive, Value, Outlook, Size, Demand, Analysis, Challenges, Strategic Insights, Investment Trends, Revenue, Trends, Supply, Forecast
- United Kingdom (UK) Long Term Care Market (2026-2032) | Companies, Outlook, Analysis, Trends, Value, Revenue, Segmentation, Share, Forecast, Competitive Landscape, Growth, Size & Forecast
- Iraq Insulation and Waterproofing Market (2026-2032) | Outlook, Drivers, Growth, Size, Share, Industry, Revenue, Trends, Demand, Competitive, Strategic Insights, Opportunities, Segments, Companies, Challenges, Strategy, Consumer Insights, Analysis, Investment Trends, Value, Segmentation, Forecast, Restraints
- India Switchgear Market Outlook (2026-2032) | Size, Share, Trends, Growth, Revenue, Forecast, Analysis, Value, Outlook
- Pakistan Contraceptive Implants Market (2025-2031) | Demand, Growth, Size, Share, Industry, Pricing Analysis, Competitive, Strategic Insights, Strategy, Consumer Insights, Analysis, Investment Trends, Opportunities, Revenue, Segments, Value, Segmentation, Supply, Forecast, Restraints, Outlook, Competition, Drivers, Trends, Companies, Challenges
- Sri Lanka Packaging Market (2026-2032) | Outlook, Competition, Drivers, Trends, Demand, Pricing Analysis, Competitive, Strategic Insights, Companies, Challenges, Strategy, Consumer Insights, Analysis, Investment Trends, Opportunities, Growth, Size, Share, Industry, Revenue, Segments, Value, Segmentation, Supply, Forecast, Restraints
- India Kids Watches Market (2026-2032) | Strategy, Consumer Insights, Analysis, Investment Trends, Opportunities, Growth, Size, Share, Industry, Revenue, Segments, Value, Segmentation, Supply, Forecast, Restraints, Outlook, Competition, Drivers, Trends, Demand, Pricing Analysis, Competitive, Strategic Insights, Companies, Challenges
- Saudi Arabia Core Assurance Service Market (2025-2031) | Strategy, Consumer Insights, Analysis, Investment Trends, Opportunities, Growth, Size, Share, Industry, Revenue, Segments, Value, Segmentation, Supply, Forecast, Restraints, Outlook, Competition, Drivers, Trends, Demand, Pricing Analysis, Competitive, Strategic Insights, Companies, Challenges
- Romania Uninterruptible Power Supply (UPS) Market (2026-2032) | Industry, Analysis, Revenue, Size, Forecast, Outlook, Value, Trends, Share, Growth & Companies
Industry Events and Analyst Meet

India EV Show 2026

EV tech India Expo 2026

Auto Tech Asia 2026

Battery Tech India 2026

Smart Production Solutions Guangzhou 2026
Whitepaper
- Middle East & Africa Commercial Security Market Click here to view more.
- Middle East & Africa Fire Safety Systems & Equipment Market Click here to view more.
- GCC Drone Market Click here to view more.
- Middle East Lighting Fixture Market Click here to view more.
- GCC Physical & Perimeter Security Market Click here to view more.
6WResearch In News
- Doha a strategic location for EV manufacturing hub: IPA Qatar
- Demand for luxury TVs surging in the GCC, says Samsung
- Empowering Growth: The Thriving Journey of Bangladesh’s Cable Industry
- Demand for luxury TVs surging in the GCC, says Samsung
- Video call with a traditional healer? Once unthinkable, it’s now common in South Africa
- Intelligent Buildings To Smooth GCC’s Path To Net Zero