Sri Lanka Chemical Packaging Market (2026-2032) | Analysis, Growth, Revenue, Companies, Industry, Trends, Value, Forecast, Size, Outlook & Share
Market Forecast By Product Types (Sacks, Drums, FIBC, Other), By Applications (Pharmaceutical Factory, Laboratory, Chemical Plant, Others) And Competitive Landscape
| Product Code: ETC006891 | Publication Date: Sep 2020 | Updated Date: Jun 2026 | Product Type: Report | |
| Publisher: 6Wresearch | Author: Ravi Bhandari | No. of Pages: 70 | No. of Figures: 35 | No. of Tables: 5 |
Sri Lanka Chemical Packaging Market Summary
The sri lanka chemical packaging market was estimated at USD 311 Million in 2025 and is projected to reach USD 438 Million by 2032, growing at a CAGR of 5.6% from 2026 to 2032.
Sri Lanka Chemical Packaging Market Growth Rate Analysis (2021-2032)
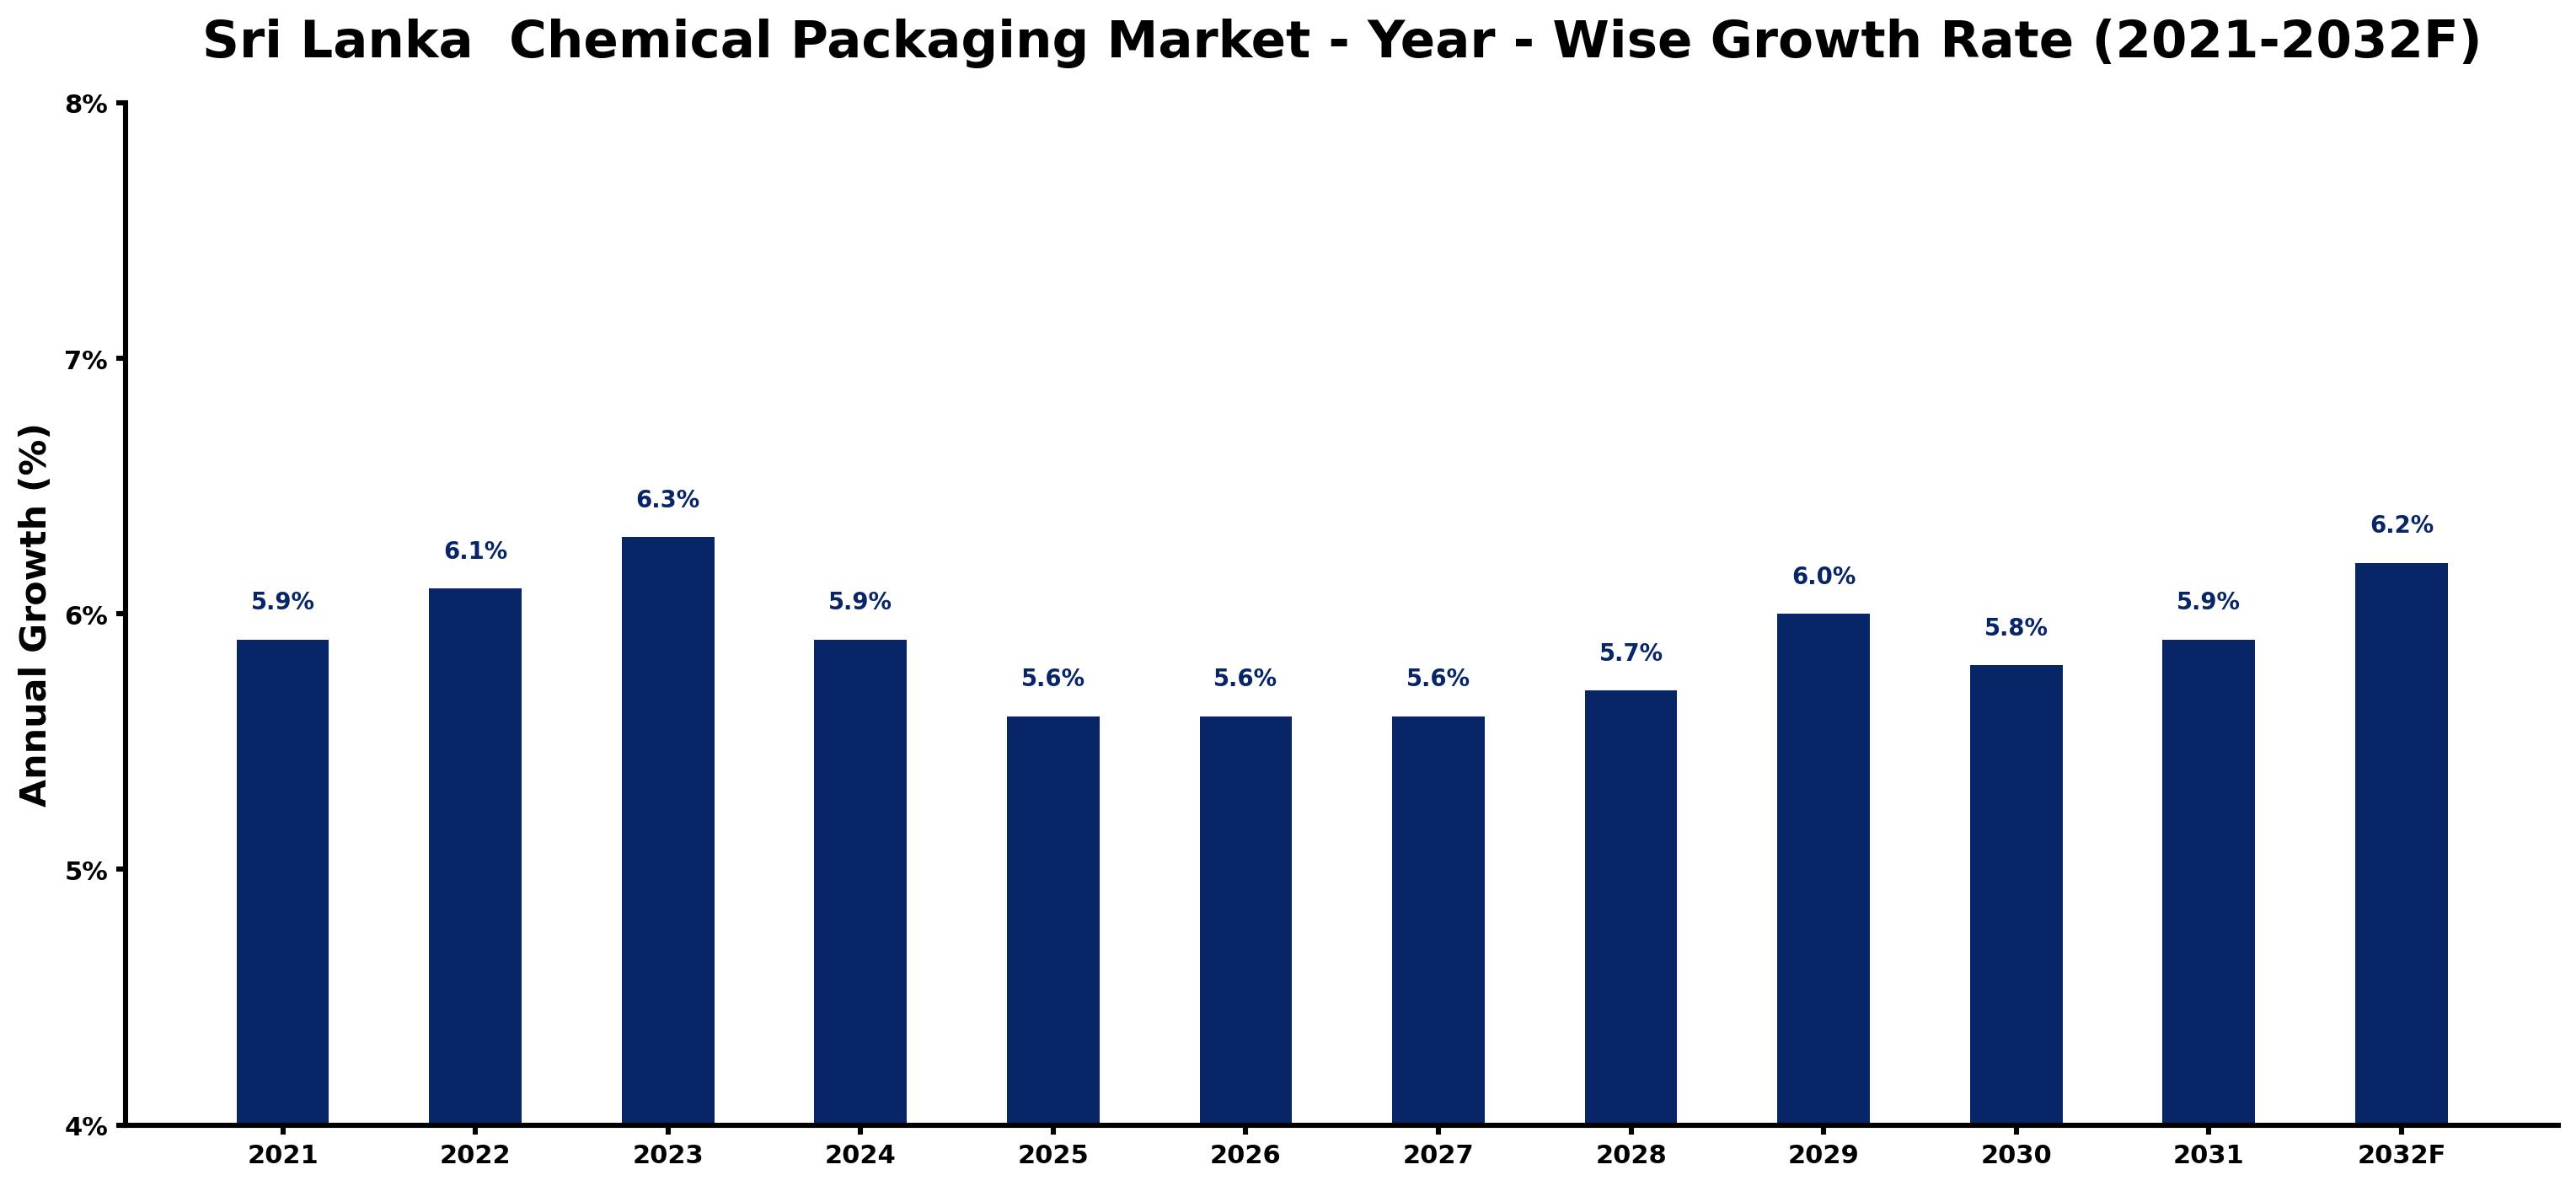
The Sri Lanka chemical packaging market is poised for steady growth, reflecting increases of 5.9% in 2021, rising to 6.3% in 2023, before stabilizing around 5.7% to 6.2% through 2032. This growth is primarily driven by escalating consumer demand for eco-friendly and innovative packaging solutions, aligning with global sustainability trends. Investments in local manufacturing capabilities and infrastructure advancements have bolstered the sector's efficiency. However, slight fluctuations, such as the dip to 5.6% in 2025-2027, can be attributed to regulatory shifts and cost pressures. The ever-evolving landscape of technology also necessitates continued adaptation, ensuring that the market remains competitive within a rapidly changing environment.
Sri Lanka Chemical Packaging Market Year-wise Growth Rate and Key Drivers
This graph highlights how the Sri Lanka Chemical Packaging Market has steadily grown over the past five years, supported by major growth factors.
The table below presents the year wise growth rates along with the key drivers influencing the market
| Year | Growth Rate | Major Drivers |
| 2021 | 5.9% | Post-COVID recovery sparked renewed interest in sustainable packaging alternatives across industries. |
| 2022 | 6.1% | Growing awareness around environmental concerns shaped consumer preferences for eco-friendly materials. |
| 2023 | 6.3% | Investment in local manufacturing facilities began reducing dependency on imported packaging solutions. |
| 2024 | 5.9% | Expansion in the chemical sector increased the demand for specialized packaging materials significantly. |
| 2025 | 5.6% | Emerging e-commerce platforms required innovative packaging solutions to enhance customer experience. |
| 2026 | 5.6% | Local brands began adopting advanced printing technologies to improve product visibility on shelves. |
| 2027 | 5.6% | The tourism industry's rebound led to increased demand for biodegradable packaging in retail. |
| 2028 | 5.7% | Emerging regulations on plastic usage stimulated research into biodegradable and compostable packages. |
| 2029 | 6.0% | Collaboration between local startups and global firms fostered innovation in packaging materials development. |
| 2030 | 5.8% | Focus on supply chain optimization drove investments in durable and lightweight packaging options. |
| 2031 | 5.9% | Consumer preference shifted towards reusable packaging solutions, creating new market opportunities. |
| 2032 | 6.2% | Investment in automation technologies began enhancing efficiency within local chemical packaging manufacturers. |
Note - Market size estimations and growth projections presented in this report are based on 6Wresearch's advanced forecasting approach, validated with industry datasets as of June 2026.
Sri Lanka Chemical Packaging Market Synopsis
The Sri Lanka Chemical Packaging Market is projected to reach 5.6% and witness significant growth during the forecast period (2026-2032). This market is characterized by a dynamic shift towards sustainable practices and enhanced safety measures in the handling and storage of chemical products. As the chemical sector experiences substantial expansion, the demand for innovative and compliant packaging solutions that protect against leaks and contamination while adhering to environmental standards continues to rise.
Sri Lanka Chemical Packaging Market Growth Drivers
A key driver influencing the Sri Lanka Chemical Packaging Market is the increasing demand for reliable packaging solutions across various sectors. The following factors are contributing to this growth:
- Rising regulatory pressures necessitate compliance with stringent packaging standards, focusing on safety and environmental concerns. The chemical industry is adapting rapidly to these requirements, enhancing product protection against potential hazards.
- The expansion of sectors such as pharmaceuticals, agriculture, and manufacturing creates a robust demand for specialized packaging solutions. Each sector requires tailored approaches to meet its unique requirements, driving innovation in design and materials.
- Consumer awareness regarding environmental sustainability is prompting manufacturers to prioritize eco-friendly packaging options. As a result, there is a growing inclination towards recyclable and biodegradable materials in chemical packaging.
- Technological advancements in packaging machinery and materials are enhancing the efficiency of production processes. This evolution supports manufacturers in creating innovative packaging solutions that improve logistics and reduce costs.
- The increasing prevalence of global trade necessitates that Sri Lankan manufacturers adopt international best practices in chemical packaging. Adhering to global standards ensures competitiveness in the export market.
Sri Lanka Chemical Packaging Market Challenges and Restraints
Despite promising growth, the Sri Lanka Chemical Packaging Market faces several challenges that could impede its progress. Key challenges include:
- Stringent regulatory frameworks require constant adaptation to new standards, placing pressure on local manufacturers to ensure compliance while managing costs effectively.
- The dual challenge of developing packaging materials that are both durable and environmentally friendly complicates R&D efforts. This leads to increased costs and time in the innovation cycle.
- Supply chain disruptions have been exacerbated by global events, affecting the availability of raw materials and increasing production costs for manufacturers in the chemical packaging domain.
- Consumer preferences are evolving, and manufacturers must stay ahead by offering sustainable packaging solutions, which requires significant investment in new technologies and processes.
- Intense competition within the market challenges manufacturers to differentiate their products, putting pressure on margins and necessitating innovative marketing strategies.
Sri Lanka Chemical Packaging Market Government Investment and Initiatives
The trajectory of the Sri Lanka Chemical Packaging Market is significantly shaped by government policies and initiatives aimed at enhancing safety and sustainability. The government has introduced several regulations focused on the following:
- Promoting the use of recyclable materials in chemical packaging to reduce environmental impact. This policy encourages local manufacturers to invest in sustainable practices.
- Establishing safety standards for packaging materials to ensure that they meet international compliance, thereby facilitating Sri Lankan products' entry into global markets.
- Providing support and incentives for research and development in innovative packaging solutions that prioritize sustainability and efficiency.
- Encouraging public-private partnerships to enhance infrastructural capabilities in the chemical sector, supporting the development of state-of-the-art packaging facilities.
- Facilitating training and skill development programs for the workforce, ensuring that manufacturers are equipped with the necessary skills to innovate in chemical packaging.
Sri Lanka Chemical Packaging Market Latest Developments (May 2025 - June 2026)
Recent developments in the Sri Lanka Chemical Packaging Market indicate a proactive shift towards integrating sustainable practices and enhancing compliance mechanisms. Ongoing trends include:
- Increased collaboration between manufacturers and research institutions aimed at developing advanced materials that meet both safety and environmental criteria.
- The launch of government initiatives focusing on reducing plastic waste in chemical packaging, resulting in heightened awareness and action within the manufacturing community.
- A noticeable uptick in investments towards automation and smart technologies in packaging processes, enhancing efficiency and reducing human error.
- Growing participation in international trade exhibitions, allowing Sri Lankan manufacturers to showcase innovative packaging solutions and expand their market reach.
- Emerging partnerships between local firms and international counterparts for knowledge transfer, particularly in the areas of sustainable packaging practices and regulatory compliance.
Sri Lanka Chemical Packaging Market - Key Attractiveness of the Report
- 10 Years of Market Numbers
- Historical Data Starting from 2022 to 2025
- Base Year: 2025
- Forecast Data until 2032
- Key Performance Indicators Impacting the Market
- Major Upcoming Developments and Projects
Key Highlights of the Report:
- Sri Lanka Chemical Packaging Market Outlook
- Market Size of Sri Lanka Chemical Packaging Market, 2025
- Forecast of Sri Lanka Chemical Packaging Market, 2032
- Historical Data and Forecast of Sri Lanka Chemical Packaging Revenues & Volume for the Period 2022-2032F
- Sri Lanka Chemical Packaging Market Trend Evolution
- Sri Lanka Chemical Packaging Market Drivers and Challenges
- Sri Lanka Chemical Packaging Price Trends
- Sri Lanka Chemical Packaging Porter's Five Forces
- Sri Lanka Chemical Packaging Industry Life Cycle
- Historical Data and Forecast of Sri Lanka Chemical Packaging Market Revenues & Volume By Product Types for the Period 2022-2032F
- Historical Data and Forecast of Sri Lanka Chemical Packaging Market Revenues & Volume By Sacks for the Period 2022-2032F
- Historical Data and Forecast of Sri Lanka Chemical Packaging Market Revenues & Volume By Drums for the Period 2022-2032F
- Historical Data and Forecast of Sri Lanka Chemical Packaging Market Revenues & Volume By FIBC for the Period 2022-2032F
- Historical Data and Forecast of Sri Lanka Chemical Packaging Market Revenues & Volume By Other for the Period 2022-2032F
- Historical Data and Forecast of Sri Lanka Chemical Packaging Market Revenues & Volume By Applications for the Period 2022-2032F
- Historical Data and Forecast of Sri Lanka Chemical Packaging Market Revenues & Volume By Pharmaceutical Factory? for the Period 2022-2032F
- Historical Data and Forecast of Sri Lanka Chemical Packaging Market Revenues & Volume By Laboratory for the Period 2022-2032F
- Historical Data and Forecast of Sri Lanka Chemical Packaging Market Revenues & Volume By Chemical Plant? for the Period 2022-2032F
- Historical Data and Forecast of Sri Lanka Chemical Packaging Market Revenues & Volume By Others for the Period 2022-2032F
- Sri Lanka Chemical Packaging Import Export Trade Statistics
- Market Opportunity Assessment By Product Types
- Market Opportunity Assessment By Applications
- Sri Lanka Chemical Packaging Top Companies Market Share
- Sri Lanka Chemical Packaging Competitive Benchmarking By Technical and Operational Parameters
- Sri Lanka Chemical Packaging Company Profiles
- Sri Lanka Chemical Packaging Key Strategic Recommendations
Frequently Asked Questions About the Market Study (FAQs):
The growth is driven by rising regulatory standards, increased demand from various industries, and a shift towards sustainable packaging materials.
Key challenges include stringent regulations, environmental concerns over packaging materials, and rising production costs due to supply chain disruptions.
The government supports the market through regulations promoting eco-friendly materials, safety standards, and investments in innovation.
Recent trends include increased collaboration for sustainable packaging solutions, automation in manufacturing processes, and participation in international trade events to showcase innovations.
6Wresearch actively monitors the Sri Lanka Chemical Packaging Market and publishes its comprehensive annual report, highlighting emerging trends, growth drivers, revenue analysis, and forecast outlook. Our insights help businesses to make data-backed strategic decisions with ongoing market dynamics. Our analysts track relevent industries related to the Sri Lanka Chemical Packaging Market, allowing our clients with actionable intelligence and reliable forecasts tailored to emerging regional needs.
Yes, we provide customisation as per your requirements. To learn more, feel free to contact us on sales@6wresearch.com
1 Executive Summary |
2 Introduction |
2.1 Key Highlights of the Report |
2.2 Report Description |
2.3 Market Scope & Segmentation |
2.4 Research Methodology |
2.5 Assumptions |
3 Sri Lanka Chemical Packaging Market Overview |
3.1 Sri Lanka Country Macro Economic Indicators |
3.2 Sri Lanka Chemical Packaging Market Revenues & Volume, 2022 & 2032F |
3.3 Sri Lanka Chemical Packaging Market - Industry Life Cycle |
3.4 Sri Lanka Chemical Packaging Market - Porter's Five Forces |
3.5 Sri Lanka Chemical Packaging Market Revenues & Volume Share, By Product Types, 2022 & 2032F |
3.6 Sri Lanka Chemical Packaging Market Revenues & Volume Share, By Applications, 2022 & 2032F |
4 Sri Lanka Chemical Packaging Market Dynamics |
4.1 Impact Analysis |
4.2 Market Drivers |
4.3 Market Restraints |
5 Sri Lanka Chemical Packaging Market Trends |
6 Sri Lanka Chemical Packaging Market, By Types |
6.1 Sri Lanka Chemical Packaging Market, By Product Types |
6.1.1 Overview and Analysis |
6.1.2 Sri Lanka Chemical Packaging Market Revenues & Volume, By Product Types, 2022-2032F |
6.1.3 Sri Lanka Chemical Packaging Market Revenues & Volume, By Sacks, 2022-2032F |
6.1.4 Sri Lanka Chemical Packaging Market Revenues & Volume, By Drums, 2022-2032F |
6.1.5 Sri Lanka Chemical Packaging Market Revenues & Volume, By FIBC, 2022-2032F |
6.1.6 Sri Lanka Chemical Packaging Market Revenues & Volume, By Other, 2022-2032F |
6.2 Sri Lanka Chemical Packaging Market, By Applications |
6.2.1 Overview and Analysis |
6.2.2 Sri Lanka Chemical Packaging Market Revenues & Volume, By Pharmaceutical Factory , 2022-2032F |
6.2.3 Sri Lanka Chemical Packaging Market Revenues & Volume, By Laboratory, 2022-2032F |
6.2.4 Sri Lanka Chemical Packaging Market Revenues & Volume, By Chemical Plant , 2022-2032F |
6.2.5 Sri Lanka Chemical Packaging Market Revenues & Volume, By Others, 2022-2032F |
7 Sri Lanka Chemical Packaging Market Import-Export Trade Statistics |
7.1 Sri Lanka Chemical Packaging Market Export to Major Countries |
7.2 Sri Lanka Chemical Packaging Market Imports from Major Countries |
8 Sri Lanka Chemical Packaging Market Key Performance Indicators |
9 Sri Lanka Chemical Packaging Market - Opportunity Assessment |
9.1 Sri Lanka Chemical Packaging Market Opportunity Assessment, By Product Types, 2022 & 2032F |
9.2 Sri Lanka Chemical Packaging Market Opportunity Assessment, By Applications, 2022 & 2032F |
10 Sri Lanka Chemical Packaging Market - Competitive Landscape |
10.1 Sri Lanka Chemical Packaging Market Revenue Share, By Companies, 2025 |
10.2 Sri Lanka Chemical Packaging Market Competitive Benchmarking, By Operating and Technical Parameters |
11 Company Profiles |
12 Recommendations |
13 Disclaimer |
Global Go To Market Strategy - 2030
Export potential enables firms to identify high-growth global markets with greater confidence by combining advanced trade intelligence with a structured quantitative methodology. The framework analyzes emerging demand trends and country-level import patterns while integrating macroeconomic and trade datasets such as GDP and population forecasts, bilateral import–export flows, tariff structures, elasticity differentials between developed and developing economies, geographic distance, and import demand projections. Using weighted trade values from 2020–2024 as the base period to project country-to-country export potential for 2030, these inputs are operationalized through calculated drivers such as gravity model parameters, tariff impact factors, and projected GDP per-capita growth. Through an analysis of hidden potentials, demand hotspots, and market conditions that are most favorable to success, this method enables firms to focus on target countries, maximize returns, and global expansion with data, backed by accuracy.
By factoring in the projected importer demand gap that is currently unmet and could be potential opportunity, it identifies the potential for the Exporter (Country) among 190 countries, against the general trade analysis, which identifies the biggest importer or exporter.
To discover high-growth global markets and optimize your business strategy:
Click Here
Pricing
- Single User License$ 1,995
- Department License$ 2,400
- Site License$ 3,120
- Global License$ 3,795

Leadership Perspectives from Industry Events
Search
Thought Leadership and Analyst Meet


Our Clients
6WResearch In News
- India Air Conditioner Market Set for Strong Rebound in 2026 After Weather-Led Correction and GST-Driven Recovery: 6Wresearch
- ADAS in India: How Automatic Emergency Braking, Blind Spot Detection & Driver Monitoring are Transforming Road Safety
- Doha a strategic location for EV manufacturing hub: IPA Qatar
- Demand for luxury TVs surging in the GCC, says Samsung
- Empowering Growth: The Thriving Journey of Bangladesh’s Cable Industry
- Demand for luxury TVs surging in the GCC, says Samsung
Latest Reports
- Nicaragua RPG Gaming Market (2026-2032)
- New Zealand RPG Gaming Market (2026-2032)
- Netherlands RPG Gaming Market (2026-2032)
- Nauru RPG Gaming Market (2026-2032)
- Namibia RPG Gaming Market (2026-2032)
- Mozambique RPG Gaming Market (2026-2032)
- Montenegro RPG Gaming Market (2026-2032)
- Mongolia RPG Gaming Market (2026-2032)
- Monaco RPG Gaming Market (2026-2032)
- Micronesia RPG Gaming Market (2026-2032)
Industry Events and Analyst Meet

HIMTEX 2026

India Refining Summit 2026

India EV Show 2026

EV tech India Expo 2026

Auto Tech Asia 2026
Whitepaper
- Middle East & Africa Commercial Security Market Click here to view more.
- Middle East & Africa Fire Safety Systems & Equipment Market Click here to view more.
- GCC Drone Market Click here to view more.
- Middle East Lighting Fixture Market Click here to view more.
- GCC Physical & Perimeter Security Market Click here to view more.