Sri Lanka Detergents Market (2026-2032) Outlook | Share, Revenue, Forecast, Value, Companies, Industry, Growth, Size, Trends & Analysis
Market Forecast By Type (Anionic Detergents, Cationic Detergents, Non-ionic Detergents, Zwitterionic (Amphoteric) Detergents), By Application (Laundry Cleaning Products, Household Cleaning Products, Dishwashing Products, Fuel Additives, Biological Reagent, Other Applications) And Competitive Landscape
| Product Code: ETC220591 | Publication Date: Aug 2022 | Updated Date: Mar 2026 | Product Type: Market Research Report | |
| Publisher: 6Wresearch | Author: Ravi Bhandari | No. of Pages: 75 | No. of Figures: 35 | No. of Tables: 20 |
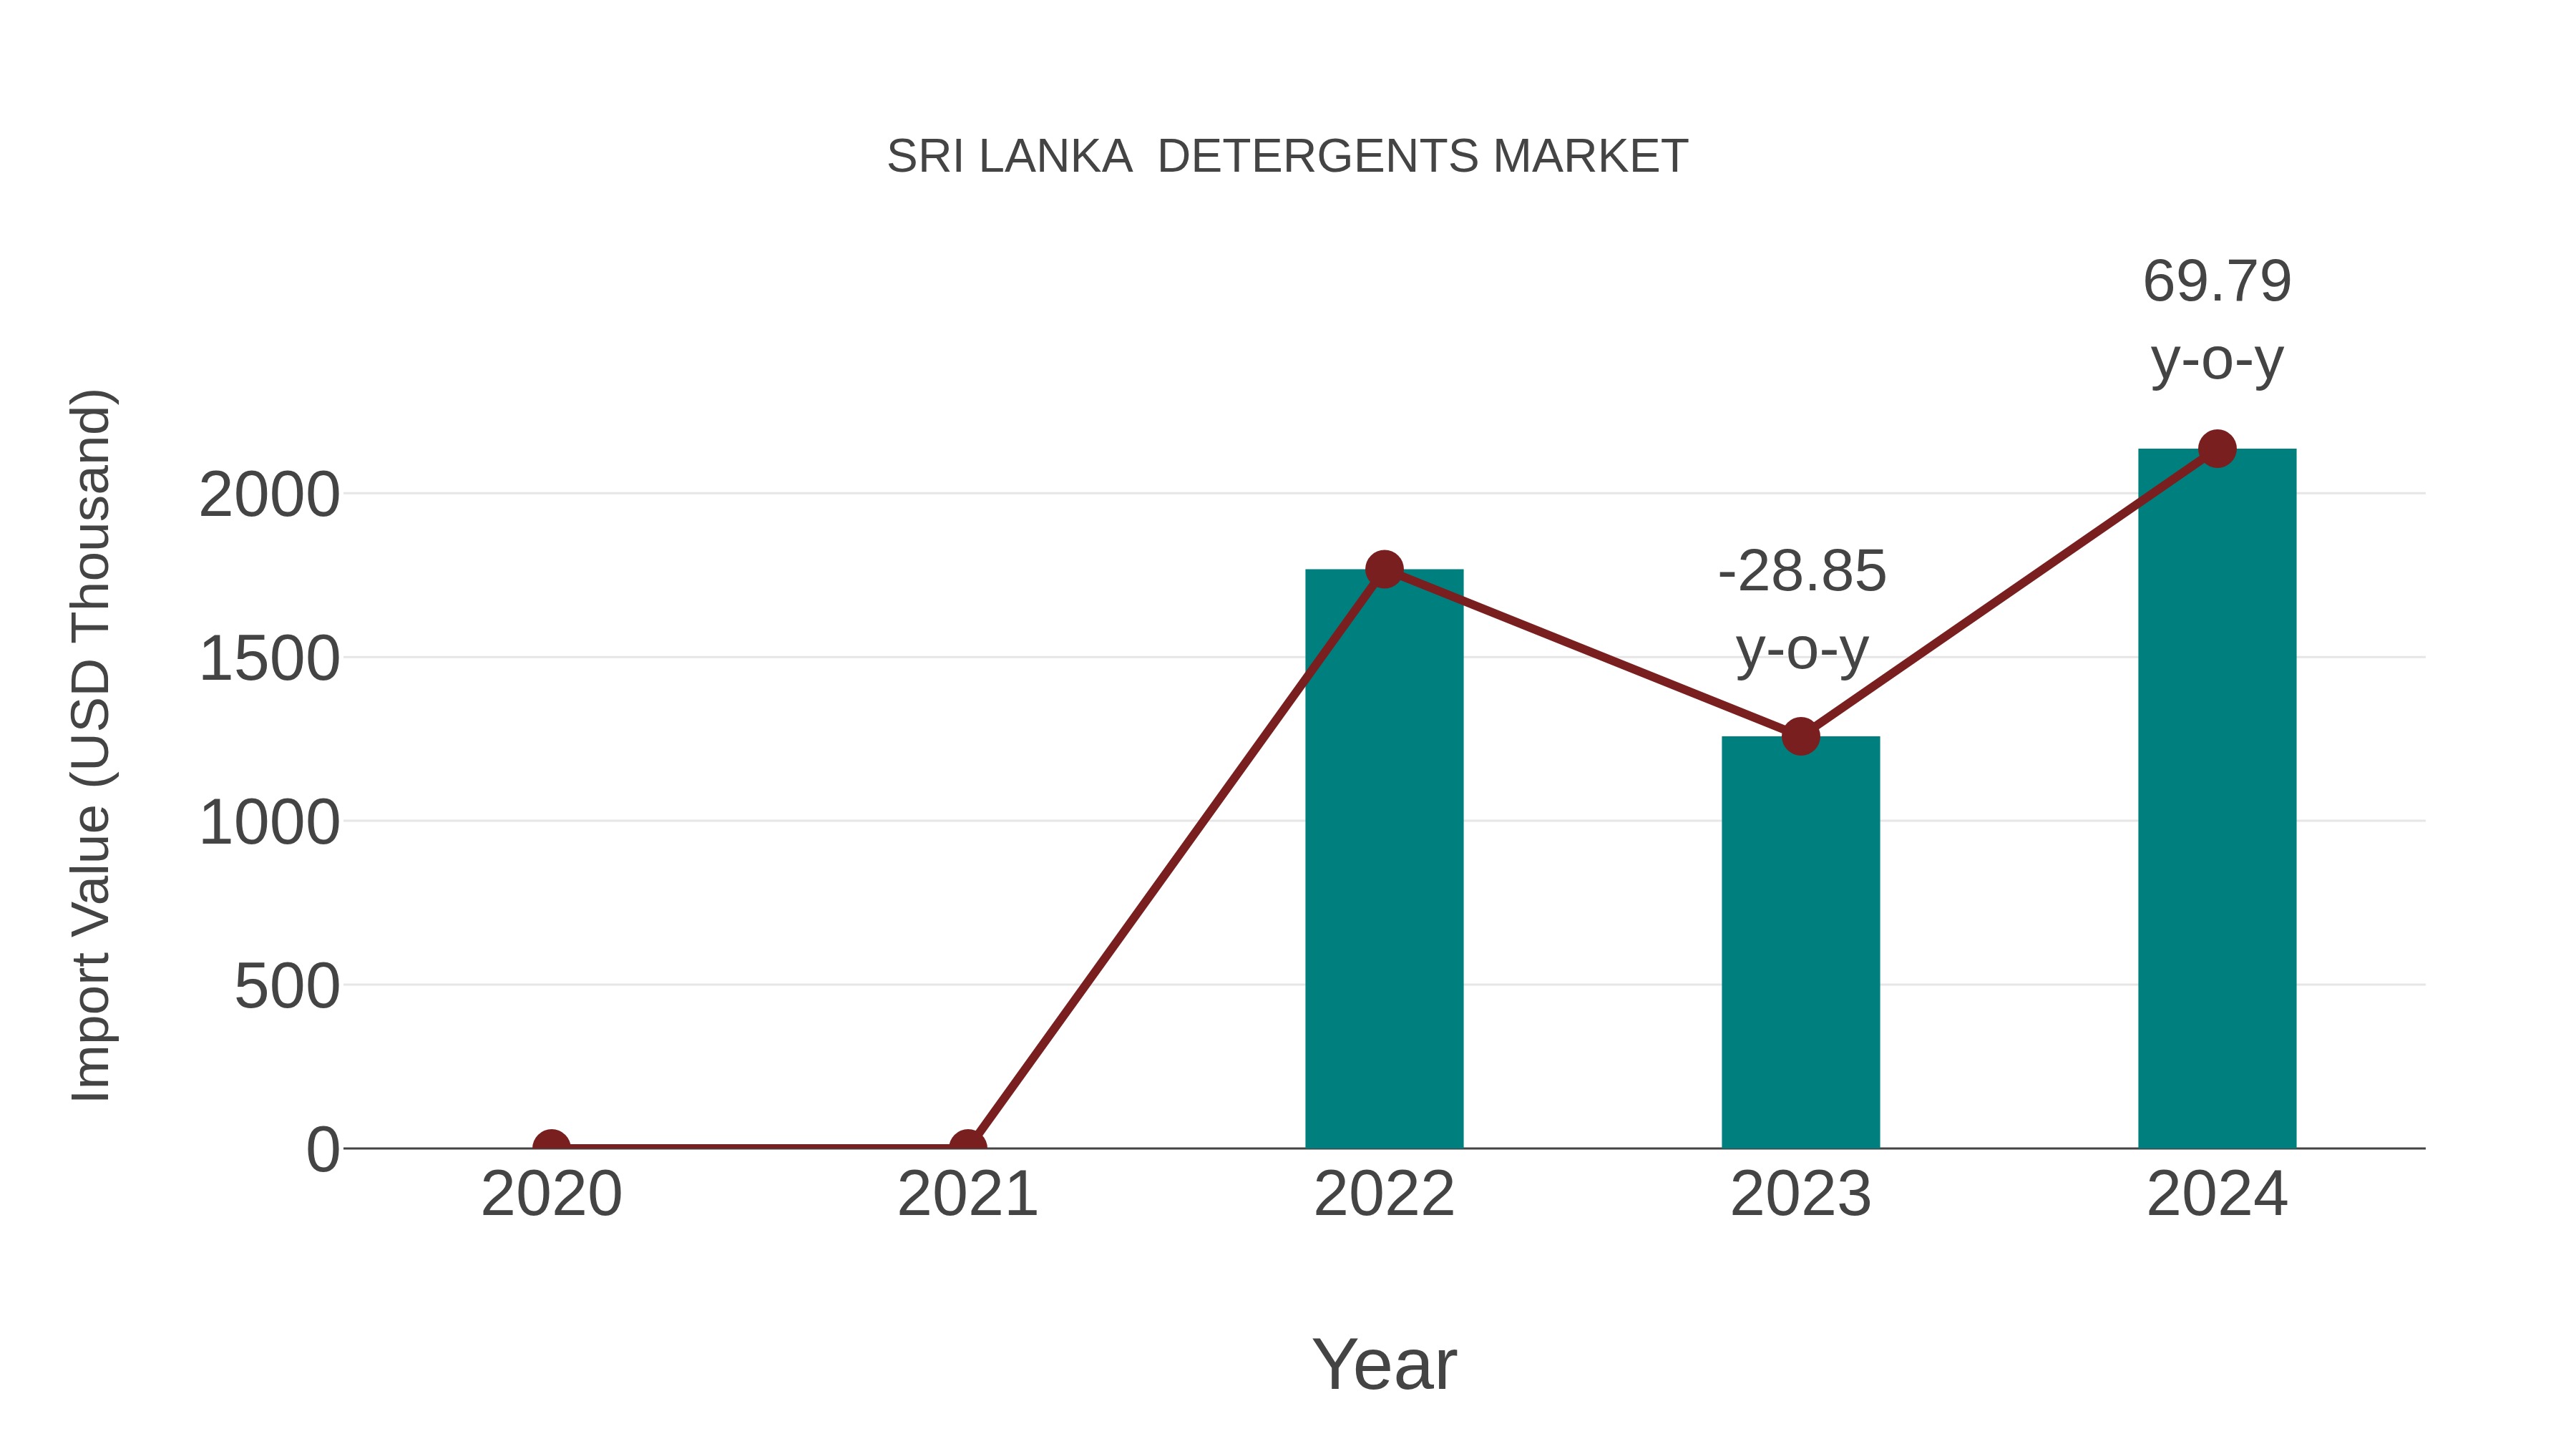
Sri Lanka Detergents Market: Import Trend Analysis
Sri Lanka detergent market saw a significant import growth trend, with a growth rate of 69.79% from 2023 to 2024. The compound annual growth rate (CAGR) for 2020-2024 stood at 9.92%. This surge in imports could be attributed to increasing consumer demand for cleaning products and improved trade relations.
Sri Lanka Detergents Market Overview
The detergents market in Sri Lanka is expanding due to increasing urbanization and a growing middle class. Consumers are becoming more conscious about hygiene and cleanliness, leading to higher demand for various detergent products. Innovations in detergent formulations, such as eco-friendly and skin-sensitive options, are also driving market growth.
Drivers of the market
The Sri Lanka detergents market is driven by urbanization, increasing disposable incomes, and changing consumer lifestyles. As more households move towards modern conveniences and higher standards of cleanliness, there is a growing demand for detergent products that are effective, eco-friendly, and cater to specific cleaning needs.
Challenges of the market
The detergents market in Sri Lanka encounters challenges related to raw material costs, environmental regulations, and consumer preferences. Manufacturers face pressure to innovate and develop environmentally friendly formulations while maintaining affordability and efficacy. Moreover, ensuring consistent quality and availability of raw materials poses logistical challenges, impacting market competitiveness and product differentiation strategies.
Government Policy of the market
Government policies governing the detergents market in Sri Lanka focus on environmental sustainability and consumer safety. Regulations under the National Environmental Act and the Consumer Affairs Authority (CAA) ensure that detergents comply with biodegradability standards and labeling requirements. The CAA monitors pricing practices to prevent unfair trade practices and promote affordability. Policies encourage research into eco-friendly detergent formulations and support local manufacturing to reduce dependency on imports.
Key Highlights of the Report:
- Sri Lanka Detergents Market Outlook
- Market Size of Sri Lanka Detergents Market, 2025
- Forecast of Sri Lanka Detergents Market, 2032
- Historical Data and Forecast of Sri Lanka Detergents Revenues & Volume for the Period 2022-2032F
- Sri Lanka Detergents Market Trend Evolution
- Sri Lanka Detergents Market Drivers and Challenges
- Sri Lanka Detergents Price Trends
- Sri Lanka Detergents Porter's Five Forces
- Sri Lanka Detergents Industry Life Cycle
- Historical Data and Forecast of Sri Lanka Detergents Market Revenues & Volume By Type for the Period 2022-2032F
- Historical Data and Forecast of Sri Lanka Detergents Market Revenues & Volume By Anionic Detergents for the Period 2022-2032F
- Historical Data and Forecast of Sri Lanka Detergents Market Revenues & Volume By Cationic Detergents for the Period 2022-2032F
- Historical Data and Forecast of Sri Lanka Detergents Market Revenues & Volume By Non-ionic Detergents for the Period 2022-2032F
- Historical Data and Forecast of Sri Lanka Detergents Market Revenues & Volume By Zwitterionic (Amphoteric) Detergents for the Period 2022-2032F
- Historical Data and Forecast of Sri Lanka Detergents Market Revenues & Volume By Application for the Period 2022-2032F
- Historical Data and Forecast of Sri Lanka Detergents Market Revenues & Volume By Laundry Cleaning Products for the Period 2022-2032F
- Historical Data and Forecast of Sri Lanka Detergents Market Revenues & Volume By Household Cleaning Products for the Period 2022-2032F
- Historical Data and Forecast of Sri Lanka Detergents Market Revenues & Volume By Dishwashing Products for the Period 2022-2032F
- Historical Data and Forecast of Sri Lanka Detergents Market Revenues & Volume By Fuel Additives for the Period 2022-2032F
- Historical Data and Forecast of Sri Lanka Detergents Market Revenues & Volume By Biological Reagent for the Period 2022-2032F
- Historical Data and Forecast of Sri Lanka Detergents Market Revenues & Volume By Other Applications for the Period 2022-2032F
- Sri Lanka Detergents Import Export Trade Statistics
- Market Opportunity Assessment By Type
- Market Opportunity Assessment By Application
- Sri Lanka Detergents Top Companies Market Share
- Sri Lanka Detergents Competitive Benchmarking By Technical and Operational Parameters
- Sri Lanka Detergents Company Profiles
- Sri Lanka Detergents Key Strategic Recommendations
Sri Lanka Detergents Market (2026-2032): FAQs
6Wresearch actively monitors the Sri Lanka Detergents Market and publishes its comprehensive annual report, highlighting emerging trends, growth drivers, revenue analysis, and forecast outlook. Our insights help businesses to make data-backed strategic decisions with ongoing market dynamics. Our analysts track relevent industries related to the Sri Lanka Detergents Market, allowing our clients with actionable intelligence and reliable forecasts tailored to emerging regional needs.
Yes, we provide customisation as per your requirements. To learn more, feel free to contact us on sales@6wresearch.com
1 Executive Summary |
2 Introduction |
2.1 Key Highlights of the Report |
2.2 Report Description |
2.3 Market Scope & Segmentation |
2.4 Research Methodology |
2.5 Assumptions |
3 Sri Lanka Detergents Market Overview |
3.1 Sri Lanka Country Macro Economic Indicators |
3.2 Sri Lanka Detergents Market Revenues & Volume, 2022 & 2032F |
3.3 Sri Lanka Detergents Market - Industry Life Cycle |
3.4 Sri Lanka Detergents Market - Porter's Five Forces |
3.5 Sri Lanka Detergents Market Revenues & Volume Share, By Type, 2022 & 2032F |
3.6 Sri Lanka Detergents Market Revenues & Volume Share, By Application, 2022 & 2032F |
4 Sri Lanka Detergents Market Dynamics |
4.1 Impact Analysis |
4.2 Market Drivers |
4.2.1 Increasing awareness about hygiene and cleanliness |
4.2.2 Growing urbanization leading to higher demand for convenience products |
4.2.3 Rising disposable income levels in Sri Lanka |
4.3 Market Restraints |
4.3.1 Intense competition among detergent brands |
4.3.2 Fluctuating raw material prices impacting production costs |
4.3.3 Environmental concerns leading to demand for eco-friendly alternatives |
5 Sri Lanka Detergents Market Trends |
6 Sri Lanka Detergents Market, By Types |
6.1 Sri Lanka Detergents Market, By Type |
6.1.1 Overview and Analysis |
6.1.2 Sri Lanka Detergents Market Revenues & Volume, By Type, 2022-2032F |
6.1.3 Sri Lanka Detergents Market Revenues & Volume, By Anionic Detergents, 2022-2032F |
6.1.4 Sri Lanka Detergents Market Revenues & Volume, By Cationic Detergents, 2022-2032F |
6.1.5 Sri Lanka Detergents Market Revenues & Volume, By Non-ionic Detergents, 2022-2032F |
6.1.6 Sri Lanka Detergents Market Revenues & Volume, By Zwitterionic (Amphoteric) Detergents, 2022-2032F |
6.2 Sri Lanka Detergents Market, By Application |
6.2.1 Overview and Analysis |
6.2.2 Sri Lanka Detergents Market Revenues & Volume, By Laundry Cleaning Products, 2022-2032F |
6.2.3 Sri Lanka Detergents Market Revenues & Volume, By Household Cleaning Products, 2022-2032F |
6.2.4 Sri Lanka Detergents Market Revenues & Volume, By Dishwashing Products, 2022-2032F |
6.2.5 Sri Lanka Detergents Market Revenues & Volume, By Fuel Additives, 2022-2032F |
6.2.6 Sri Lanka Detergents Market Revenues & Volume, By Biological Reagent, 2022-2032F |
6.2.7 Sri Lanka Detergents Market Revenues & Volume, By Other Applications, 2022-2032F |
7 Sri Lanka Detergents Market Import-Export Trade Statistics |
7.1 Sri Lanka Detergents Market Export to Major Countries |
7.2 Sri Lanka Detergents Market Imports from Major Countries |
8 Sri Lanka Detergents Market Key Performance Indicators |
8.1 Household penetration rate of detergent products |
8.2 Consumer perception and satisfaction with detergent brands |
8.3 Adoption rate of innovative detergent formulations |
8.4 Retail distribution expansion in rural areas |
8.5 Recycling rate of detergent packaging materials |
9 Sri Lanka Detergents Market - Opportunity Assessment |
9.1 Sri Lanka Detergents Market Opportunity Assessment, By Type, 2022 & 2032F |
9.2 Sri Lanka Detergents Market Opportunity Assessment, By Application, 2022 & 2032F |
10 Sri Lanka Detergents Market - Competitive Landscape |
10.1 Sri Lanka Detergents Market Revenue Share, By Companies, 2025 |
10.2 Sri Lanka Detergents Market Competitive Benchmarking, By Operating and Technical Parameters |
11 Company Profiles |
12 Recommendations |
13 Disclaimer |
Global Go To Market Strategy - 2030
Export potential enables firms to identify high-growth global markets with greater confidence by combining advanced trade intelligence with a structured quantitative methodology. The framework analyzes emerging demand trends and country-level import patterns while integrating macroeconomic and trade datasets such as GDP and population forecasts, bilateral import–export flows, tariff structures, elasticity differentials between developed and developing economies, geographic distance, and import demand projections. Using weighted trade values from 2020–2024 as the base period to project country-to-country export potential for 2030, these inputs are operationalized through calculated drivers such as gravity model parameters, tariff impact factors, and projected GDP per-capita growth. Through an analysis of hidden potentials, demand hotspots, and market conditions that are most favorable to success, this method enables firms to focus on target countries, maximize returns, and global expansion with data, backed by accuracy.
By factoring in the projected importer demand gap that is currently unmet and could be potential opportunity, it identifies the potential for the Exporter (Country) among 190 countries, against the general trade analysis, which identifies the biggest importer or exporter.
To discover high-growth global markets and optimize your business strategy:
Click Here
Pricing
- Single User License$ 1,995
- Department License$ 2,400
- Site License$ 3,120
- Global License$ 3,795

Leadership Perspectives from Industry Events
Search
Thought Leadership and Analyst Meet


Our Clients
6WResearch In News
- India Air Conditioner Market Set for Strong Rebound in 2026 After Weather-Led Correction and GST-Driven Recovery: 6Wresearch
- ADAS in India: How Automatic Emergency Braking, Blind Spot Detection & Driver Monitoring are Transforming Road Safety
- Doha a strategic location for EV manufacturing hub: IPA Qatar
- Demand for luxury TVs surging in the GCC, says Samsung
- Empowering Growth: The Thriving Journey of Bangladesh’s Cable Industry
- Demand for luxury TVs surging in the GCC, says Samsung
Latest Reports
- Nicaragua RPG Gaming Market (2026-2032)
- New Zealand RPG Gaming Market (2026-2032)
- Netherlands RPG Gaming Market (2026-2032)
- Nauru RPG Gaming Market (2026-2032)
- Namibia RPG Gaming Market (2026-2032)
- Mozambique RPG Gaming Market (2026-2032)
- Montenegro RPG Gaming Market (2026-2032)
- Mongolia RPG Gaming Market (2026-2032)
- Monaco RPG Gaming Market (2026-2032)
- Micronesia RPG Gaming Market (2026-2032)
Industry Events and Analyst Meet

HIMTEX 2026

India Refining Summit 2026

India EV Show 2026

EV tech India Expo 2026

Auto Tech Asia 2026
Whitepaper
- Middle East & Africa Commercial Security Market Click here to view more.
- Middle East & Africa Fire Safety Systems & Equipment Market Click here to view more.
- GCC Drone Market Click here to view more.
- Middle East Lighting Fixture Market Click here to view more.
- GCC Physical & Perimeter Security Market Click here to view more.