Sri Lanka Transport Packaging Market (2026-2032) | Revenue, Industry, Trends, Size, Companies, Forecast, Value, Growth, Analysis, Share & Outlook
Market Forecast By Material Type (Plastic, Polyethylene (PE), Polypropylene (PP), Polyethylene Terephthalate (PET), Paper & Paperboard, Metal, Wood, Others), By Packaging Types (Cartons, Wooden crates, Containers, Corrugated boxes, Barrels, IBCs, Strapping, Others), By End-users (Agriculture, Automotive, Building & Construction, Chemicals & Pharmaceuticals, Food & Beverages, Metallurgical, Electrical & Electronics, Others) And Competitive Landscape
| Product Code: ETC006651 | Publication Date: Sep 2020 | Updated Date: Jun 2026 | Product Type: Report | |
| Publisher: 6Wresearch | Author: Ravi Bhandari | No. of Pages: 70 | No. of Figures: 35 | No. of Tables: 5 |
Sri Lanka Transport Packaging Market Summary
The sri lanka transport packaging market was estimated at USD 1119 Million in 2025 and is projected to reach USD 1618 Million by 2032, growing at a CAGR of 6.1% from 2026 to 2032.
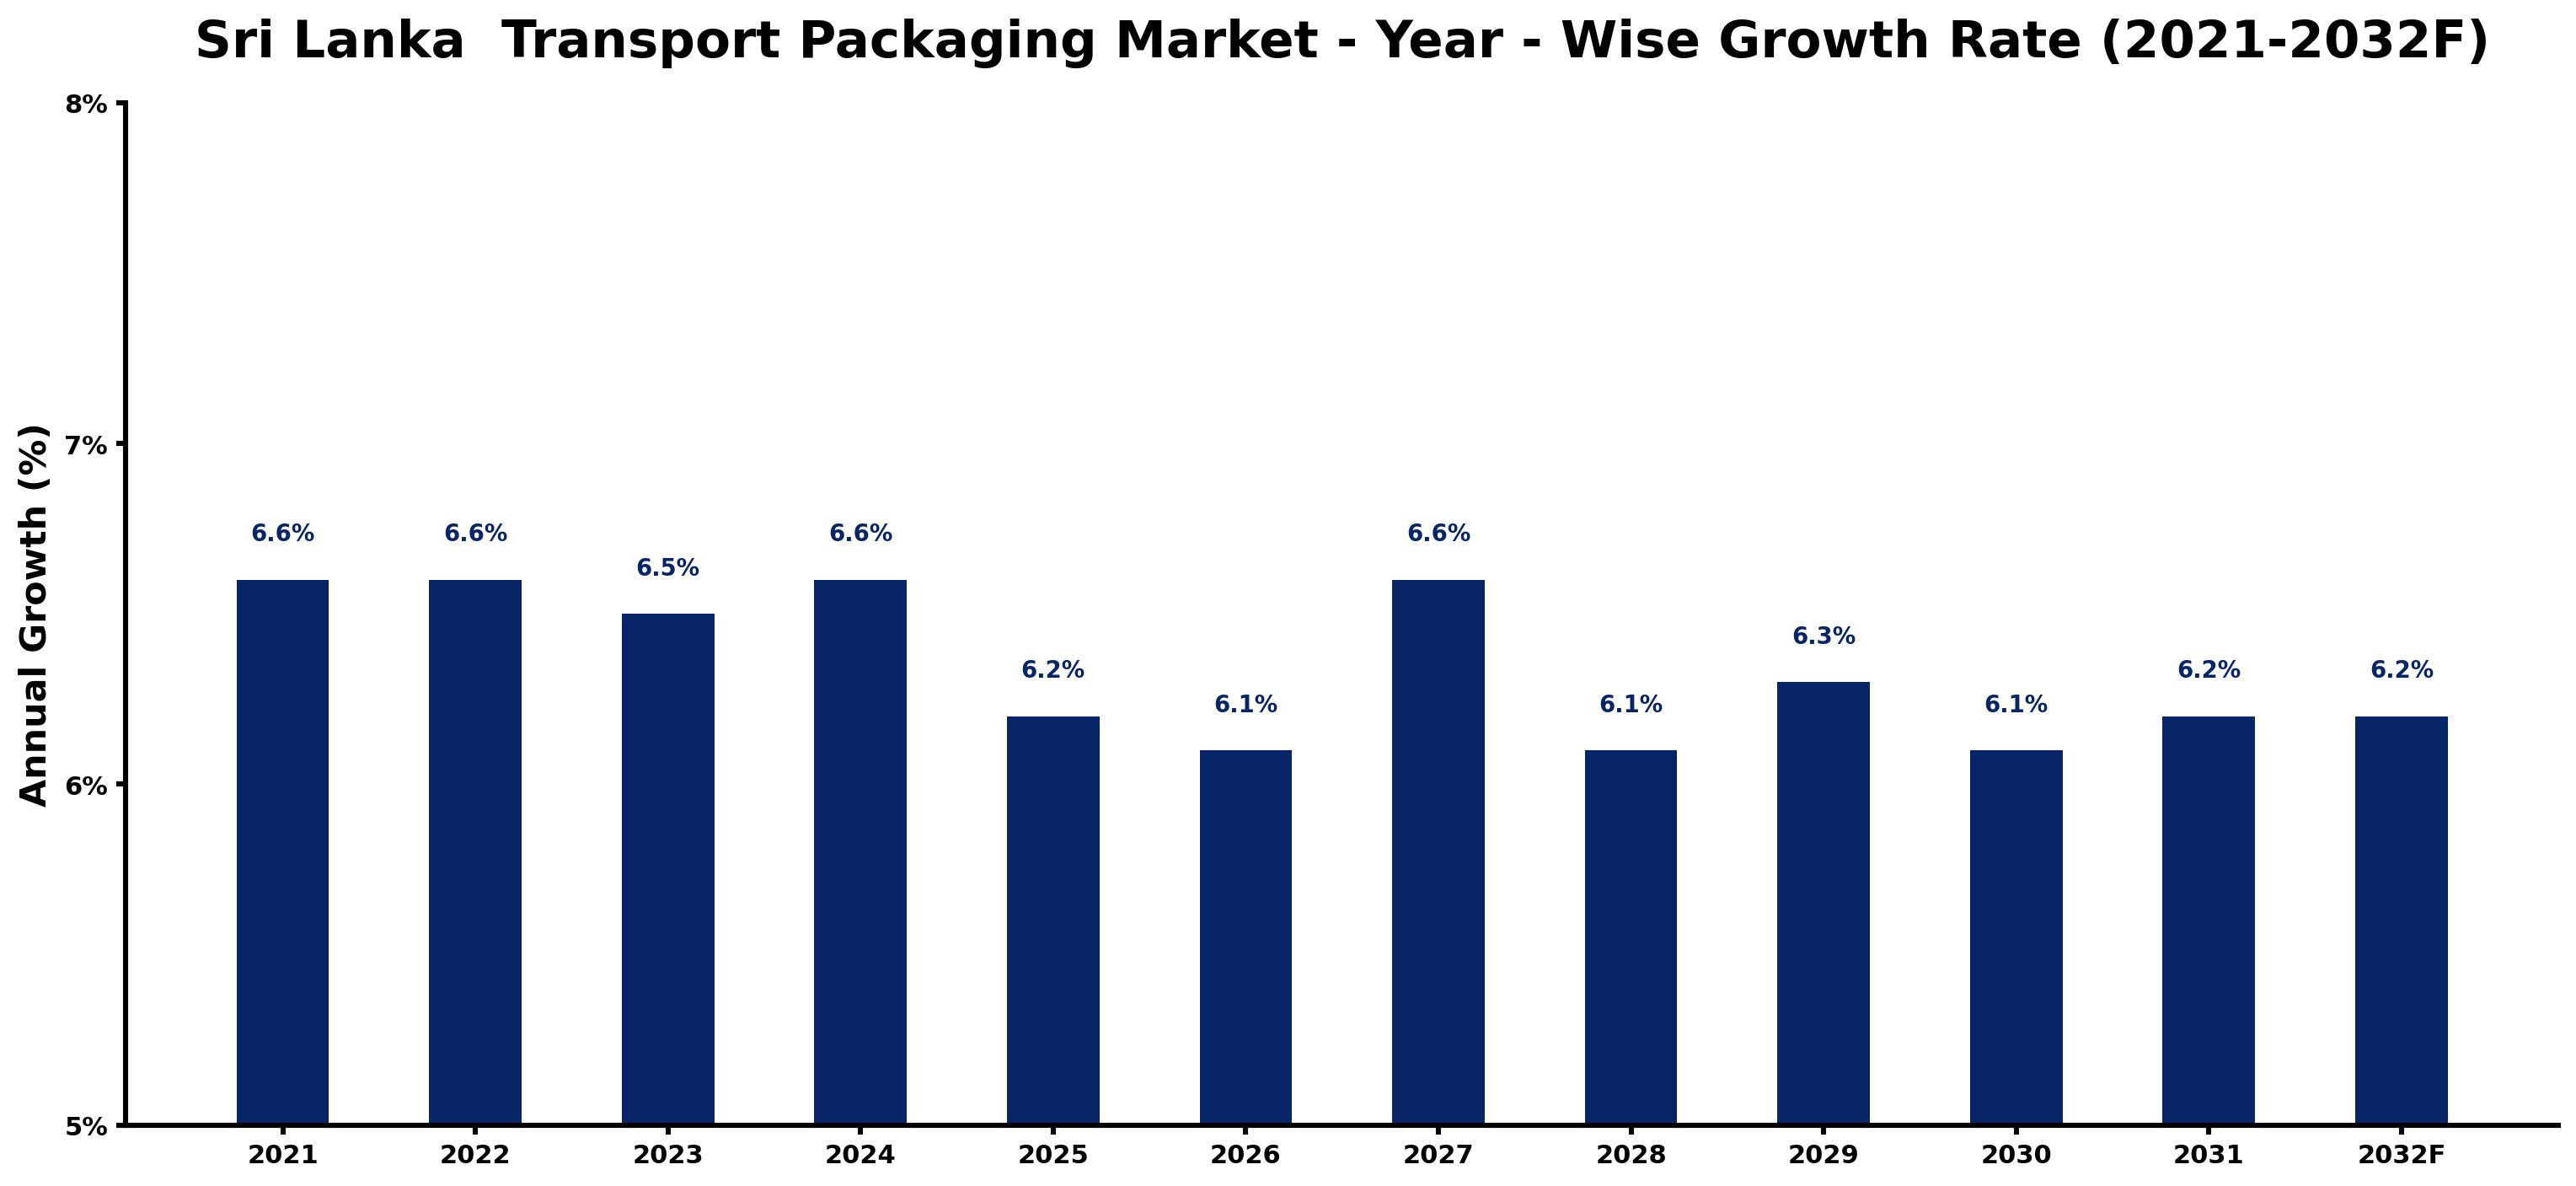
Sri Lanka Transport Packaging Market Growth Rate Analysis (2021-2032)
The Sri Lanka transport packaging market has exhibited a stable growth pattern, with rates around 6.6% in both 2021 and 2022, slightly tapering to 6.5% in 2023. This resilience can be attributed to increasing consumer demand driven by the expansion of e-commerce and the logistics sector, particularly following the pandemic. The growth is projected to sustain around 6.6% again in 2024, although it eases slightly to 6.2% by 2025 as inflationary pressures and global supply chain disruptions begin to exert their influence. Nevertheless, investments in infrastructure and technology are expected to bolster the market, allowing it to recover and maintain a healthy average growth rate of around 6.1% to 6.3% through 2032.
Sri Lanka Transport Packaging Market Year-wise Growth Rate and Key Drivers
This graph highlights how the Sri Lanka Transport Packaging Market has steadily grown over the past five years, supported by major growth factors.
The table below presents the year wise growth rates along with the key drivers influencing the market
| Year | Growth Rate | Major Drivers |
| 2021 | 6.6% | The transport packaging market faced challenges due to pandemic-related disruptions. |
| 2022 | 6.6% | Recovery in e-commerce boosted the demand for flexible transport packaging solutions. |
| 2023 | 6.5% | Logistics optimization led to a surge in multi-functional packaging innovations. |
| 2024 | 6.6% | Sustainability concerns prompted investments in eco-friendly packaging materials and designs. |
| 2025 | 6.2% | Increased urbanization influenced the demand for lightweight and space-saving packaging options. |
| 2026 | 6.1% | The expansion of supply chains enhanced the need for reliable transport packaging solutions. |
| 2027 | 6.6% | Technological advancements in packaging machinery improved manufacturing efficiency and quality. |
| 2028 | 6.1% | Rising consumer preferences for online shopping shaped packaging design and functionality. |
| 2029 | 6.3% | Integration of smart packaging solutions provided real-time tracking capabilities for shipments. |
| 2030 | 6.1% | Competitive pressures encouraged companies to innovate and reduce costs in packaging. |
| 2031 | 6.2% | Focus on food safety regulations drove the development of secure packaging alternatives. |
| 2032 | 6.2% | Emerging markets in Sri Lanka attracted foreign investments in transport packaging production. |
Note - Market size estimations and growth projections presented in this report are based on 6Wresearch's advanced forecasting approach, validated with industry datasets as of June 2026.
Sri Lanka Transport Packaging Market Synopsis
The Sri Lanka Transport Packaging Market is projected to reach 6.1% and witness significant growth during the forecast period (2026-2032). This market plays a pivotal role in safeguarding products throughout the shipping process, ensuring that goods arrive at their destinations in optimal condition. Transport packaging encompasses a variety of materials such as pallets, crates, and protective wraps, all essential for proper handling and distribution. This report delves into the multifaceted dynamics of the market, identifying critical drivers, challenges, and opportunities shaping its future.
Sri Lanka Transport Packaging Market Growth Drivers
The growth of the Sri Lanka Transport Packaging Market is primarily fueled by several interlinked factors:
- The expansion of the logistics industry is a significant driver, as the need for efficient transport solutions increases with growing trade activities. This enhancement in logistics infrastructure is vital for the transport packaging sector.
- The rise of e-commerce platforms has transformed consumer expectations regarding packaging and delivery. The demand for quick and safe delivery options necessitates robust transport packaging solutions to meet consumer standards.
- International trade volumes are also escalating, leading to an increased need for durable and compliant packaging solutions that can withstand global shipping conditions and regulations.
- There is a growing emphasis on sustainability within the packaging industry. The demand for eco-friendly materials is prompting businesses to adapt their transport packaging strategies to align with environmental standards.
- Technological advancements in packaging materials and design have resulted in more functional and efficient solutions, making them more appealing to manufacturers and suppliers in the market.
Sri Lanka Transport Packaging Market Challenges and Restraints
Despite the promising growth trajectory, the Sri Lanka Transport Packaging Market faces several challenges that could hinder its progress:
- The high cost associated with quality packaging materials can deter businesses from investing in superior transport solutions. This financial barrier may limit the adoption of innovative packaging technologies.
- Ensuring compliance with international shipping standards is a complex task, and failure to meet these regulations can result in delays and reputational damage.
- The logistics of packaging supply and disposal pose significant hurdles, as companies strive to manage the lifecycle of their packaging materials in an efficient manner.
- Intense competition from alternative packaging solutions could impact market growth. Many companies are exploring options like reusable and biodegradable packaging, challenging traditional transport packaging methods.
- Market players must navigate fluctuating commodity prices that affect the cost and availability of essential packaging materials, further complicating supply chain management.
Sri Lanka Transport Packaging Market Government Investment and Initiatives
Government policies significantly shape the landscape of the Sri Lanka Transport Packaging Market. The Sri Lankan government has initiated various regulations aimed at enhancing packaging standards while supporting sustainability efforts. These policies encourage manufacturers to adopt more efficient transport packaging solutions that comply with both local and international standards. Public spending on infrastructure improvements further bolsters the logistics sector, creating a downstream effect on transport packaging. Additionally, government incentives aimed at promoting eco-friendly packaging practices are essential for stimulating innovation and sustainability in the market. These initiatives are crucial in positioning Sri Lanka as a competitive player in the regional and global transport packaging arena.
Sri Lanka Transport Packaging Market Latest Developments (May 2025 - June 2026)
Recent developments in the Sri Lanka Transport Packaging Market from May 2025 to June 2026 indicate a positive trajectory influenced by both global trends and local initiatives. The market has witnessed a surge in demand for environmentally friendly packaging materials, driven by consumer awareness and regulatory pressures. Innovations in biodegradable and recyclable materials have gained traction, reflecting a growing commitment to sustainability. Furthermore, industry players are increasingly investing in advanced technologies to enhance packaging efficiency and reduce waste. The government's push towards strengthening logistics infrastructure has also facilitated smoother supply chain operations, enhancing the overall effectiveness of transport packaging. These developments contribute to a more resilient and adaptive market environment.
Sri Lanka Transport Packaging Market - Key Attractiveness of the Report
- 10 Years of Market Numbers
- Historical Data Starting from 2022 to 2025
- Base Year: 2025
- Forecast Data until 2032
- Key Performance Indicators Impacting the Market
- Major Upcoming Developments and Projects
Key Highlights of the Report:
- Sri Lanka Transport Packaging Market Outlook
- Market Size of Sri Lanka Transport Packaging Market, 2025
- Forecast of Sri Lanka Transport Packaging Market, 2032
- Historical Data and Forecast of Sri Lanka Transport Packaging Revenues & Volume for the Period 2022-2032F
- Sri Lanka Transport Packaging Market Trend Evolution
- Sri Lanka Transport Packaging Market Drivers and Challenges
- Sri Lanka Transport Packaging Price Trends
- Sri Lanka Transport Packaging Porter's Five Forces
- Sri Lanka Transport Packaging Industry Life Cycle
- Historical Data and Forecast of Sri Lanka Transport Packaging Market Revenues & Volume By Material Type for the Period 2022-2032F
- Historical Data and Forecast of Sri Lanka Transport Packaging Market Revenues & Volume By Plastic for the Period 2022-2032F
- Historical Data and Forecast of Sri Lanka Transport Packaging Market Revenues & Volume By Polyethylene (PE) for the Period 2022-2032F
- Historical Data and Forecast of Sri Lanka Transport Packaging Market Revenues & Volume By Polypropylene (PP) for the Period 2022-2032F
- Historical Data and Forecast of Sri Lanka Transport Packaging Market Revenues & Volume By Polyethylene Terephthalate (PET) for the Period 2022-2032F
- Historical Data and Forecast of Sri Lanka Transport Packaging Market Revenues & Volume By Paper & Paperboard for the Period 2022-2032F
- Historical Data and Forecast of Sri Lanka Transport Packaging Market Revenues & Volume By Metal for the Period 2022-2032F
- Historical Data and Forecast of Sri Lanka Transport Packaging Market Revenues & Volume By Wood for the Period 2022-2032F
- Historical Data and Forecast of Sri Lanka Plastic Transport Packaging Market Revenues & Volume By Others for the Period 2022-2032F
- Historical Data and Forecast of Sri Lanka Transport Packaging Market Revenues & Volume By Packaging Types for the Period 2022-2032F
- Historical Data and Forecast of Sri Lanka Transport Packaging Market Revenues & Volume By Cartons for the Period 2022-2032F
- Historical Data and Forecast of Sri Lanka Transport Packaging Market Revenues & Volume By Wooden crates for the Period 2022-2032F
- Historical Data and Forecast of Sri Lanka Transport Packaging Market Revenues & Volume By Containers for the Period 2022-2032F
- Historical Data and Forecast of Sri Lanka Transport Packaging Market Revenues & Volume By Corrugated boxes for the Period 2022-2032F
- Historical Data and Forecast of Sri Lanka Transport Packaging Market Revenues & Volume By Barrels for the Period 2022-2032F
- Historical Data and Forecast of Sri Lanka Transport Packaging Market Revenues & Volume By IBCs for the Period 2022-2032F
- Historical Data and Forecast of Sri Lanka Transport Packaging Market Revenues & Volume By Strapping for the Period 2022-2032F
- Historical Data and Forecast of Sri Lanka Transport Packaging Market Revenues & Volume By Others for the Period 2022-2032F
- Historical Data and Forecast of Sri Lanka Transport Packaging Market Revenues & Volume By End-users for the Period 2022-2032F
- Historical Data and Forecast of Sri Lanka Transport Packaging Market Revenues & Volume By Agriculture for the Period 2022-2032F
- Historical Data and Forecast of Sri Lanka Transport Packaging Market Revenues & Volume By Automotive for the Period 2022-2032F
- Historical Data and Forecast of Sri Lanka Transport Packaging Market Revenues & Volume By Building & Construction for the Period 2022-2032F
- Historical Data and Forecast of Sri Lanka Transport Packaging Market Revenues & Volume By Chemicals & Pharmaceuticals for the Period 2022-2032F
- Historical Data and Forecast of Sri Lanka Transport Packaging Market Revenues & Volume By Food & Beverages for the Period 2022-2032F
- Historical Data and Forecast of Sri Lanka Transport Packaging Market Revenues & Volume By Metallurgical for the Period 2022-2032F
- Historical Data and Forecast of Sri Lanka Transport Packaging Market Revenues & Volume By Electrical & Electronics for the Period 2022-2032F
- Historical Data and Forecast of Sri Lanka Transport Packaging Market Revenues & Volume By Others for the Period 2022-2032F
- Sri Lanka Transport Packaging Import Export Trade Statistics
- Market Opportunity Assessment By Material Type
- Market Opportunity Assessment By Packaging Types
- Market Opportunity Assessment By End-users
- Sri Lanka Transport Packaging Top Companies Market Share
- Sri Lanka Transport Packaging Competitive Benchmarking By Technical and Operational Parameters
- Sri Lanka Transport Packaging Company Profiles
- Sri Lanka Transport Packaging Key Strategic Recommendations
Frequently Asked Questions About the Market Study (FAQs):
The primary growth factors include the expansion of logistics operations, the rise of e-commerce, and the increasing demand for sustainable packaging solutions.
Challenges include high material costs, compliance with international shipping standards, and intense competition from alternative packaging solutions.
The government promotes efficient packaging practices through regulations, incentives for eco-friendly solutions, and investment in logistics infrastructure.
Current trends include a shift towards biodegradable materials, advancements in packaging technologies, and an emphasis on sustainability.
6Wresearch actively monitors the Sri Lanka Transport Packaging Market and publishes its comprehensive annual report, highlighting emerging trends, growth drivers, revenue analysis, and forecast outlook. Our insights help businesses to make data-backed strategic decisions with ongoing market dynamics. Our analysts track relevent industries related to the Sri Lanka Transport Packaging Market, allowing our clients with actionable intelligence and reliable forecasts tailored to emerging regional needs.
Yes, we provide customisation as per your requirements. To learn more, feel free to contact us on sales@6wresearch.com
1 Executive Summary |
2 Introduction |
2.1 Key Highlights of the Report |
2.2 Report Description |
2.3 Market Scope & Segmentation |
2.4 Research Methodology |
2.5 Assumptions |
3 Sri Lanka Transport Packaging Market Overview |
3.1 Sri Lanka Country Macro Economic Indicators |
3.2 Sri Lanka Transport Packaging Market Revenues & Volume, 2022 & 2032F |
3.3 Sri Lanka Transport Packaging Market - Industry Life Cycle |
3.4 Sri Lanka Transport Packaging Market - Porter's Five Forces |
3.5 Sri Lanka Transport Packaging Market Revenues & Volume Share, By Material Type, 2022 & 2032F |
3.6 Sri Lanka Transport Packaging Market Revenues & Volume Share, By Packaging Types, 2022 & 2032F |
3.7 Sri Lanka Transport Packaging Market Revenues & Volume Share, By End-users, 2022 & 2032F |
4 Sri Lanka Transport Packaging Market Dynamics |
4.1 Impact Analysis |
4.2 Market Drivers |
4.3 Market Restraints |
5 Sri Lanka Transport Packaging Market Trends |
6 Sri Lanka Transport Packaging Market, By Types |
6.1 Sri Lanka Transport Packaging Market, By Material Type |
6.1.1 Overview and Analysis |
6.1.2 Sri Lanka Transport Packaging Market Revenues & Volume, By Material Type, 2022-2032F |
6.1.3 Sri Lanka Transport Packaging Market Revenues & Volume, By Plastic, 2022-2032F |
6.1.4 Sri Lanka Transport Packaging Market Revenues & Volume, By Polyethylene (PE), 2022-2032F |
6.1.5 Sri Lanka Transport Packaging Market Revenues & Volume, By Polypropylene (PP), 2022-2032F |
6.1.6 Sri Lanka Transport Packaging Market Revenues & Volume, By Polyethylene Terephthalate (PET), 2022-2032F |
6.1.7 Sri Lanka Transport Packaging Market Revenues & Volume, By Paper & Paperboard, 2022-2032F |
6.1.8 Sri Lanka Transport Packaging Market Revenues & Volume, By Metal, 2022-2032F |
6.1.9 Sri Lanka Transport Packaging Market Revenues & Volume, By Others, 2022-2032F |
6.1.10 Sri Lanka Transport Packaging Market Revenues & Volume, By Others, 2022-2032F |
6.2 Sri Lanka Transport Packaging Market, By Packaging Types |
6.2.1 Overview and Analysis |
6.2.2 Sri Lanka Transport Packaging Market Revenues & Volume, By Cartons, 2022-2032F |
6.2.3 Sri Lanka Transport Packaging Market Revenues & Volume, By Wooden crates, 2022-2032F |
6.2.4 Sri Lanka Transport Packaging Market Revenues & Volume, By Containers, 2022-2032F |
6.2.5 Sri Lanka Transport Packaging Market Revenues & Volume, By Corrugated boxes, 2022-2032F |
6.2.6 Sri Lanka Transport Packaging Market Revenues & Volume, By Barrels, 2022-2032F |
6.2.7 Sri Lanka Transport Packaging Market Revenues & Volume, By IBCs, 2022-2032F |
6.2.8 Sri Lanka Transport Packaging Market Revenues & Volume, By Others, 2022-2032F |
6.2.9 Sri Lanka Transport Packaging Market Revenues & Volume, By Others, 2022-2032F |
6.3 Sri Lanka Transport Packaging Market, By End-users |
6.3.1 Overview and Analysis |
6.3.2 Sri Lanka Transport Packaging Market Revenues & Volume, By Agriculture, 2022-2032F |
6.3.3 Sri Lanka Transport Packaging Market Revenues & Volume, By Automotive, 2022-2032F |
6.3.4 Sri Lanka Transport Packaging Market Revenues & Volume, By Building & Construction, 2022-2032F |
6.3.5 Sri Lanka Transport Packaging Market Revenues & Volume, By Chemicals & Pharmaceuticals, 2022-2032F |
6.3.6 Sri Lanka Transport Packaging Market Revenues & Volume, By Food & Beverages, 2022-2032F |
6.3.7 Sri Lanka Transport Packaging Market Revenues & Volume, By Metallurgical, 2022-2032F |
6.3.8 Sri Lanka Transport Packaging Market Revenues & Volume, By Others, 2022-2032F |
6.3.9 Sri Lanka Transport Packaging Market Revenues & Volume, By Others, 2022-2032F |
7 Sri Lanka Transport Packaging Market Import-Export Trade Statistics |
7.1 Sri Lanka Transport Packaging Market Export to Major Countries |
7.2 Sri Lanka Transport Packaging Market Imports from Major Countries |
8 Sri Lanka Transport Packaging Market Key Performance Indicators |
9 Sri Lanka Transport Packaging Market - Opportunity Assessment |
9.1 Sri Lanka Transport Packaging Market Opportunity Assessment, By Material Type, 2022 & 2032F |
9.2 Sri Lanka Transport Packaging Market Opportunity Assessment, By Packaging Types, 2022 & 2032F |
9.3 Sri Lanka Transport Packaging Market Opportunity Assessment, By End-users, 2022 & 2032F |
10 Sri Lanka Transport Packaging Market - Competitive Landscape |
10.1 Sri Lanka Transport Packaging Market Revenue Share, By Companies, 2025 |
10.2 Sri Lanka Transport Packaging Market Competitive Benchmarking, By Operating and Technical Parameters |
11 Company Profiles |
12 Recommendations |
13 Disclaimer |
Global Go To Market Strategy - 2030
Export potential enables firms to identify high-growth global markets with greater confidence by combining advanced trade intelligence with a structured quantitative methodology. The framework analyzes emerging demand trends and country-level import patterns while integrating macroeconomic and trade datasets such as GDP and population forecasts, bilateral import–export flows, tariff structures, elasticity differentials between developed and developing economies, geographic distance, and import demand projections. Using weighted trade values from 2020–2024 as the base period to project country-to-country export potential for 2030, these inputs are operationalized through calculated drivers such as gravity model parameters, tariff impact factors, and projected GDP per-capita growth. Through an analysis of hidden potentials, demand hotspots, and market conditions that are most favorable to success, this method enables firms to focus on target countries, maximize returns, and global expansion with data, backed by accuracy.
By factoring in the projected importer demand gap that is currently unmet and could be potential opportunity, it identifies the potential for the Exporter (Country) among 190 countries, against the general trade analysis, which identifies the biggest importer or exporter.
To discover high-growth global markets and optimize your business strategy:
Click Here
Pricing
- Single User License$ 1,995
- Department License$ 2,400
- Site License$ 3,120
- Global License$ 3,795

Leadership Perspectives from Industry Events
Search
Thought Leadership and Analyst Meet


Our Clients
6WResearch In News
- India Air Conditioner Market Set for Strong Rebound in 2026 After Weather-Led Correction and GST-Driven Recovery: 6Wresearch
- ADAS in India: How Automatic Emergency Braking, Blind Spot Detection & Driver Monitoring are Transforming Road Safety
- Doha a strategic location for EV manufacturing hub: IPA Qatar
- Demand for luxury TVs surging in the GCC, says Samsung
- Empowering Growth: The Thriving Journey of Bangladesh’s Cable Industry
- Demand for luxury TVs surging in the GCC, says Samsung
Latest Reports
- Nicaragua RPG Gaming Market (2026-2032)
- New Zealand RPG Gaming Market (2026-2032)
- Netherlands RPG Gaming Market (2026-2032)
- Nauru RPG Gaming Market (2026-2032)
- Namibia RPG Gaming Market (2026-2032)
- Mozambique RPG Gaming Market (2026-2032)
- Montenegro RPG Gaming Market (2026-2032)
- Mongolia RPG Gaming Market (2026-2032)
- Monaco RPG Gaming Market (2026-2032)
- Micronesia RPG Gaming Market (2026-2032)
Industry Events and Analyst Meet

HIMTEX 2026

India Refining Summit 2026

India EV Show 2026

EV tech India Expo 2026

Auto Tech Asia 2026
Whitepaper
- Middle East & Africa Commercial Security Market Click here to view more.
- Middle East & Africa Fire Safety Systems & Equipment Market Click here to view more.
- GCC Drone Market Click here to view more.
- Middle East Lighting Fixture Market Click here to view more.
- GCC Physical & Perimeter Security Market Click here to view more.