Suriname Unmanned Surface Vehicles Market (2026-2032) | Companies, Forecast, Outlook, Value, Analysis, Share, Trends, Size, Segmentation, Revenue, Growth & Industry
Market Forecast By Type (Remotely Operated Surface Vehicles, Autonomous Surface Vehicles), By Application (Commercial, Defense), By System (Propulsion System, Communication System, Payload, Chassis Material, Component, Software), By Size (Small (Less Than 3 Meters), Medium (3-7 Meters), Large (7-14 Meters), Extremely Large (>14 Meters)), By Endurance (<100 Hours, 100†™500 Hours, 500†™1,000 Hours, >1,000 Hours), By Hull Type (Single, Twin, Triple, Rigid Inflatable), By Cruising Speed (Up to 10 Knots, 10†™30 Knots, More than 30 Knots) And Competitive Landscape
| Product Code: ETC5860998 | Publication Date: Nov 2023 | Updated Date: Mar 2026 | Product Type: Market Research Report | |
| Publisher: 6Wresearch | Author: Ravi Bhandari | No. of Pages: 60 | No. of Figures: 30 | No. of Tables: 5 |
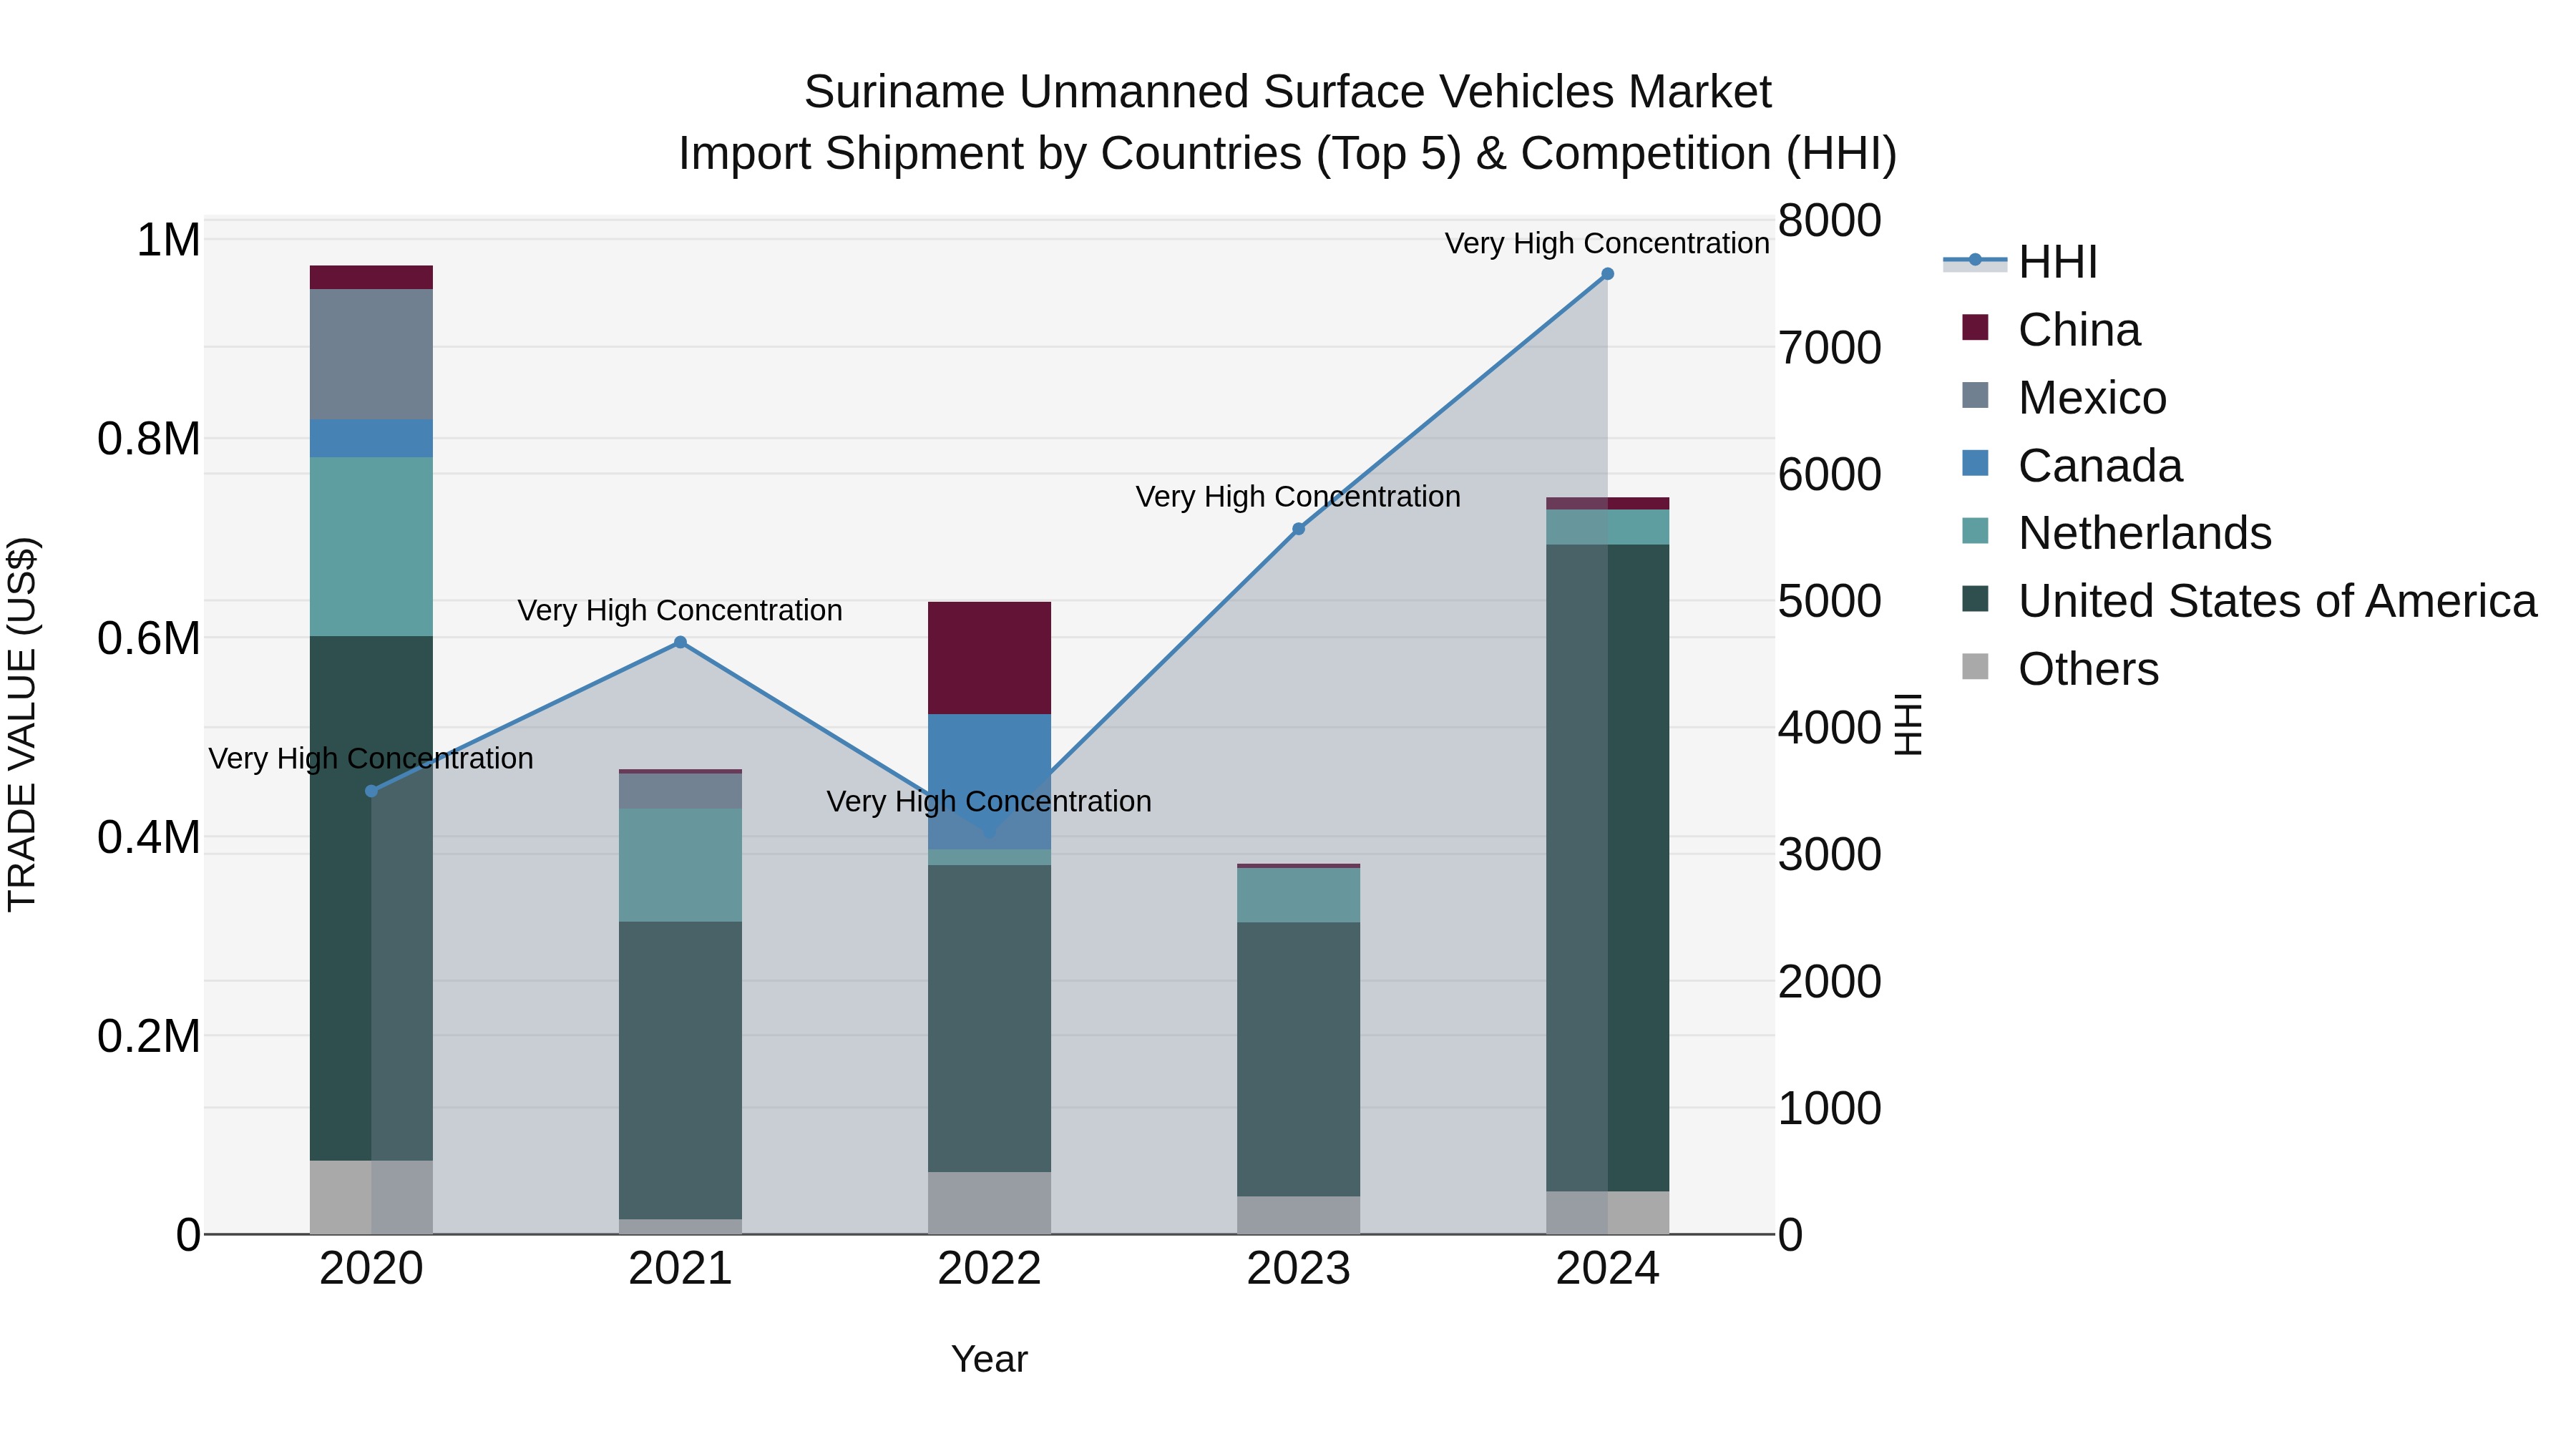
Suriname Unmanned Surface Vehicles Market: Top 5 Importing Countries and Market Competition (HHI) Analysis
Suriname import shipments of unmanned surface vehicles in 2024 saw significant growth, with the top exporting countries being the United States, Netherlands, Colombia, China, and Brazil. Despite a high Herfindahl-Hirschman Index (HHI) indicating market concentration, the industry experienced a negative compound annual growth rate (CAGR) from 2020 to 2024. However, there was a remarkable growth spurt from 2023 to 2024, with a growth rate of 99.05%, suggesting a potential shift in market dynamics and heightened demand for unmanned surface vehicles in Suriname.
Key Highlights of the Report:
- Suriname Unmanned Surface Vehicles Market Outlook
- Market Size of Suriname Unmanned Surface Vehicles Market, 2025
- Forecast of Suriname Unmanned Surface Vehicles Market, 2032
- Historical Data and Forecast of Suriname Unmanned Surface Vehicles Revenues & Volume for the Period 2022 - 2032F
- Suriname Unmanned Surface Vehicles Market Trend Evolution
- Suriname Unmanned Surface Vehicles Market Drivers and Challenges
- Suriname Unmanned Surface Vehicles Price Trends
- Suriname Unmanned Surface Vehicles Porter`s Five Forces
- Suriname Unmanned Surface Vehicles Industry Life Cycle
- Historical Data and Forecast of Suriname Unmanned Surface Vehicles Market Revenues & Volume By Type for the Period 2022 - 2032F
- Historical Data and Forecast of Suriname Unmanned Surface Vehicles Market Revenues & Volume By Remotely Operated Surface Vehicles for the Period 2022 - 2032F
- Historical Data and Forecast of Suriname Unmanned Surface Vehicles Market Revenues & Volume By Autonomous Surface Vehicles for the Period 2022 - 2032F
- Historical Data and Forecast of Suriname Unmanned Surface Vehicles Market Revenues & Volume By Application for the Period 2022 - 2032F
- Historical Data and Forecast of Suriname Unmanned Surface Vehicles Market Revenues & Volume By Commercial for the Period 2022 - 2032F
- Historical Data and Forecast of Suriname Unmanned Surface Vehicles Market Revenues & Volume By Defense for the Period 2022 - 2032F
- Historical Data and Forecast of Suriname Unmanned Surface Vehicles Market Revenues & Volume By System for the Period 2022 - 2032F
- Historical Data and Forecast of Suriname Unmanned Surface Vehicles Market Revenues & Volume By Propulsion System for the Period 2022 - 2032F
- Historical Data and Forecast of Suriname Unmanned Surface Vehicles Market Revenues & Volume By Communication System for the Period 2022 - 2032F
- Historical Data and Forecast of Suriname Unmanned Surface Vehicles Market Revenues & Volume By Payload for the Period 2022 - 2032F
- Historical Data and Forecast of Suriname Unmanned Surface Vehicles Market Revenues & Volume By Chassis Material for the Period 2022 - 2032F
- Historical Data and Forecast of Suriname Unmanned Surface Vehicles Market Revenues & Volume By Component for the Period 2022 - 2032F
- Historical Data and Forecast of Suriname Unmanned Surface Vehicles Market Revenues & Volume By Software for the Period 2022 - 2032F
- Historical Data and Forecast of Suriname Unmanned Surface Vehicles Market Revenues & Volume By Size for the Period 2022 - 2032F
- Historical Data and Forecast of Suriname Unmanned Surface Vehicles Market Revenues & Volume By Small (Less Than 3 Meters) for the Period 2022 - 2032F
- Historical Data and Forecast of Suriname Unmanned Surface Vehicles Market Revenues & Volume By Medium (3-7 Meters) for the Period 2022 - 2032F
- Historical Data and Forecast of Suriname Unmanned Surface Vehicles Market Revenues & Volume By Large (7-14 Meters) for the Period 2022 - 2032F
- Historical Data and Forecast of Suriname Unmanned Surface Vehicles Market Revenues & Volume By Extremely Large (>14 Meters) for the Period 2022 - 2032F
- Historical Data and Forecast of Suriname Unmanned Surface Vehicles Market Revenues & Volume By Endurance for the Period 2022 - 2032F
- Historical Data and Forecast of Suriname Unmanned Surface Vehicles Market Revenues & Volume By <100 Hours for the Period 2022 - 2032F
- Historical Data and Forecast of Suriname Unmanned Surface Vehicles Market Revenues & Volume By 100???500 Hours for the Period 2022 - 2032F
- Historical Data and Forecast of Suriname Unmanned Surface Vehicles Market Revenues & Volume By 500???1,000 Hours for the Period 2022 - 2032F
- Historical Data and Forecast of Suriname Unmanned Surface Vehicles Market Revenues & Volume By >1,000 Hours for the Period 2022 - 2032F
- Historical Data and Forecast of Suriname Unmanned Surface Vehicles Market Revenues & Volume By Hull Type for the Period 2022 - 2032F
- Historical Data and Forecast of Suriname Unmanned Surface Vehicles Market Revenues & Volume By Single for the Period 2022 - 2032F
- Historical Data and Forecast of Suriname Unmanned Surface Vehicles Market Revenues & Volume By Twin for the Period 2022 - 2032F
- Historical Data and Forecast of Suriname Unmanned Surface Vehicles Market Revenues & Volume By Triple for the Period 2022 - 2032F
- Historical Data and Forecast of Suriname Unmanned Surface Vehicles Market Revenues & Volume By Rigid Inflatable for the Period 2022 - 2032F
- Historical Data and Forecast of Suriname Unmanned Surface Vehicles Market Revenues & Volume By Cruising Speed for the Period 2022 - 2032F
- Historical Data and Forecast of Suriname Unmanned Surface Vehicles Market Revenues & Volume By Up to 10 Knots for the Period 2022 - 2032F
- Historical Data and Forecast of Suriname Unmanned Surface Vehicles Market Revenues & Volume By 10???30 Knots for the Period 2022 - 2032F
- Historical Data and Forecast of Suriname Unmanned Surface Vehicles Market Revenues & Volume By More than 30 Knots for the Period 2022 - 2032F
- Suriname Unmanned Surface Vehicles Import Export Trade Statistics
- Market Opportunity Assessment By Type
- Market Opportunity Assessment By Application
- Market Opportunity Assessment By System
- Market Opportunity Assessment By Size
- Market Opportunity Assessment By Endurance
- Market Opportunity Assessment By Hull Type
- Market Opportunity Assessment By Cruising Speed
- Suriname Unmanned Surface Vehicles Top Companies Market Share
- Suriname Unmanned Surface Vehicles Competitive Benchmarking By Technical and Operational Parameters
- Suriname Unmanned Surface Vehicles Company Profiles
- Suriname Unmanned Surface Vehicles Key Strategic Recommendations
Frequently Asked Questions About the Market Study (FAQs):
6Wresearch actively monitors the Suriname Unmanned Surface Vehicles Market and publishes its comprehensive annual report, highlighting emerging trends, growth drivers, revenue analysis, and forecast outlook. Our insights help businesses to make data-backed strategic decisions with ongoing market dynamics. Our analysts track relevent industries related to the Suriname Unmanned Surface Vehicles Market, allowing our clients with actionable intelligence and reliable forecasts tailored to emerging regional needs.
Yes, we provide customisation as per your requirements. To learn more, feel free to contact us on sales@6wresearch.com
1 Executive Summary |
2 Introduction |
2.1 Key Highlights of the Report |
2.2 Report Description |
2.3 Market Scope & Segmentation |
2.4 Research Methodology |
2.5 Assumptions |
3 Suriname Unmanned Surface Vehicles Market Overview |
3.1 Suriname Country Macro Economic Indicators |
3.2 Suriname Unmanned Surface Vehicles Market Revenues & Volume, 2022 & 2032F |
3.3 Suriname Unmanned Surface Vehicles Market - Industry Life Cycle |
3.4 Suriname Unmanned Surface Vehicles Market - Porter's Five Forces |
3.5 Suriname Unmanned Surface Vehicles Market Revenues & Volume Share, By Type, 2022 & 2032F |
3.6 Suriname Unmanned Surface Vehicles Market Revenues & Volume Share, By Application, 2022 & 2032F |
3.7 Suriname Unmanned Surface Vehicles Market Revenues & Volume Share, By System, 2022 & 2032F |
3.8 Suriname Unmanned Surface Vehicles Market Revenues & Volume Share, By Size, 2022 & 2032F |
3.9 Suriname Unmanned Surface Vehicles Market Revenues & Volume Share, By Endurance, 2022 & 2032F |
3.10 Suriname Unmanned Surface Vehicles Market Revenues & Volume Share, By Hull Type, 2022 & 2032F |
3.11 Suriname Unmanned Surface Vehicles Market Revenues & Volume Share, By Cruising Speed, 2022 & 2032F |
4 Suriname Unmanned Surface Vehicles Market Dynamics |
4.1 Impact Analysis |
4.2 Market Drivers |
4.2.1 Increasing demand for efficient and cost-effective surveillance and monitoring solutions in Suriname. |
4.2.2 Technological advancements in unmanned surface vehicles leading to improved capabilities and functionalities. |
4.2.3 Government initiatives and investments in enhancing maritime security and monitoring in Suriname. |
4.3 Market Restraints |
4.3.1 High initial investment cost for acquiring unmanned surface vehicles. |
4.3.2 Lack of skilled workforce for operating and maintaining unmanned surface vehicles in Suriname. |
4.3.3 Regulatory challenges and compliance issues related to the use of unmanned surface vehicles in Suriname. |
5 Suriname Unmanned Surface Vehicles Market Trends |
6 Suriname Unmanned Surface Vehicles Market Segmentations |
6.1 Suriname Unmanned Surface Vehicles Market, By Type |
6.1.1 Overview and Analysis |
6.1.2 Suriname Unmanned Surface Vehicles Market Revenues & Volume, By Remotely Operated Surface Vehicles, 2022 - 2032F |
6.1.3 Suriname Unmanned Surface Vehicles Market Revenues & Volume, By Autonomous Surface Vehicles, 2022 - 2032F |
6.2 Suriname Unmanned Surface Vehicles Market, By Application |
6.2.1 Overview and Analysis |
6.2.2 Suriname Unmanned Surface Vehicles Market Revenues & Volume, By Commercial, 2022 - 2032F |
6.2.3 Suriname Unmanned Surface Vehicles Market Revenues & Volume, By Defense, 2022 - 2032F |
6.3 Suriname Unmanned Surface Vehicles Market, By System |
6.3.1 Overview and Analysis |
6.3.2 Suriname Unmanned Surface Vehicles Market Revenues & Volume, By Propulsion System, 2022 - 2032F |
6.3.3 Suriname Unmanned Surface Vehicles Market Revenues & Volume, By Communication System, 2022 - 2032F |
6.3.4 Suriname Unmanned Surface Vehicles Market Revenues & Volume, By Payload, 2022 - 2032F |
6.3.5 Suriname Unmanned Surface Vehicles Market Revenues & Volume, By Chassis Material, 2022 - 2032F |
6.3.6 Suriname Unmanned Surface Vehicles Market Revenues & Volume, By Component, 2022 - 2032F |
6.3.7 Suriname Unmanned Surface Vehicles Market Revenues & Volume, By Software, 2022 - 2032F |
6.4 Suriname Unmanned Surface Vehicles Market, By Size |
6.4.1 Overview and Analysis |
6.4.2 Suriname Unmanned Surface Vehicles Market Revenues & Volume, By Small (Less Than 3 Meters), 2022 - 2032F |
6.4.3 Suriname Unmanned Surface Vehicles Market Revenues & Volume, By Medium (3-7 Meters), 2022 - 2032F |
6.4.4 Suriname Unmanned Surface Vehicles Market Revenues & Volume, By Large (7-14 Meters), 2022 - 2032F |
6.4.5 Suriname Unmanned Surface Vehicles Market Revenues & Volume, By Extremely Large (>14 Meters), 2022 - 2032F |
6.5 Suriname Unmanned Surface Vehicles Market, By Endurance |
6.5.1 Overview and Analysis |
6.5.2 Suriname Unmanned Surface Vehicles Market Revenues & Volume, By |
6.5.3 Suriname Unmanned Surface Vehicles Market Revenues & Volume, By 100???500 Hours, 2022 - 2032F |
6.5.4 Suriname Unmanned Surface Vehicles Market Revenues & Volume, By 500???1,000 Hours, 2022 - 2032F |
6.5.5 Suriname Unmanned Surface Vehicles Market Revenues & Volume, By >1,000 Hours, 2022 - 2032F |
6.6 Suriname Unmanned Surface Vehicles Market, By Hull Type |
6.6.1 Overview and Analysis |
6.6.2 Suriname Unmanned Surface Vehicles Market Revenues & Volume, By Single, 2022 - 2032F |
6.6.3 Suriname Unmanned Surface Vehicles Market Revenues & Volume, By Twin, 2022 - 2032F |
6.6.4 Suriname Unmanned Surface Vehicles Market Revenues & Volume, By Triple, 2022 - 2032F | 6.6.5 Suriname Unmanned Surface Vehicles Market Revenues & Volume, By Rigid Inflatable, 2022 - 2032F |
6.7 Suriname Unmanned Surface Vehicles Market, By Cruising Speed |
6.7.1 Overview and Analysis |
6.7.2 Suriname Unmanned Surface Vehicles Market Revenues & Volume, By Up to 10 Knots, 2022 - 2032F |
6.7.3 Suriname Unmanned Surface Vehicles Market Revenues & Volume, By 10???30 Knots, 2022 - 2032F |
6.7.4 Suriname Unmanned Surface Vehicles Market Revenues & Volume, By , 2022 - 2032F |
7 Suriname Unmanned Surface Vehicles Market Import-Export Trade Statistics |
7.1 Suriname Unmanned Surface Vehicles Market Export to Major Countries |
7.2 Suriname Unmanned Surface Vehicles Market Imports from Major Countries |
8 Suriname Unmanned Surface Vehicles Market Key Performance Indicators |
8.1 Average response time for deploying unmanned surface vehicles for surveillance missions in Suriname. |
8.2 Percentage increase in the adoption of unmanned surface vehicles for maritime applications in Suriname. |
8.3 Rate of technological adoption and integration of advanced features in unmanned surface vehicles in Suriname. |
8.4 Average operational efficiency and uptime of unmanned surface vehicles in Suriname. |
8.5 Level of customer satisfaction and feedback on the performance of unmanned surface vehicles in Suriname. |
9 Suriname Unmanned Surface Vehicles Market - Opportunity Assessment |
9.1 Suriname Unmanned Surface Vehicles Market Opportunity Assessment, By Type, 2022 & 2032F |
9.2 Suriname Unmanned Surface Vehicles Market Opportunity Assessment, By Application, 2022 & 2032F |
9.3 Suriname Unmanned Surface Vehicles Market Opportunity Assessment, By System, 2022 & 2032F |
9.4 Suriname Unmanned Surface Vehicles Market Opportunity Assessment, By Size, 2022 & 2032F |
9.5 Suriname Unmanned Surface Vehicles Market Opportunity Assessment, By Endurance, 2022 & 2032F |
9.6 Suriname Unmanned Surface Vehicles Market Opportunity Assessment, By Hull Type, 2022 & 2032F |
9.7 Suriname Unmanned Surface Vehicles Market Opportunity Assessment, By Cruising Speed, 2022 & 2032F |
10 Suriname Unmanned Surface Vehicles Market - Competitive Landscape |
10.1 Suriname Unmanned Surface Vehicles Market Revenue Share, By Companies, 2025 |
10.2 Suriname Unmanned Surface Vehicles Market Competitive Benchmarking, By Operating and Technical Parameters |
11 Company Profiles |
12 Recommendations | 13 Disclaimer |
Global Go To Market Strategy - 2030
Export potential enables firms to identify high-growth global markets with greater confidence by combining advanced trade intelligence with a structured quantitative methodology. The framework analyzes emerging demand trends and country-level import patterns while integrating macroeconomic and trade datasets such as GDP and population forecasts, bilateral import–export flows, tariff structures, elasticity differentials between developed and developing economies, geographic distance, and import demand projections. Using weighted trade values from 2020–2024 as the base period to project country-to-country export potential for 2030, these inputs are operationalized through calculated drivers such as gravity model parameters, tariff impact factors, and projected GDP per-capita growth. Through an analysis of hidden potentials, demand hotspots, and market conditions that are most favorable to success, this method enables firms to focus on target countries, maximize returns, and global expansion with data, backed by accuracy.
By factoring in the projected importer demand gap that is currently unmet and could be potential opportunity, it identifies the potential for the Exporter (Country) among 190 countries, against the general trade analysis, which identifies the biggest importer or exporter.
To discover high-growth global markets and optimize your business strategy:
Click Here
Pricing
- Single User License$ 1,995
- Department License$ 2,400
- Site License$ 3,120
- Global License$ 3,795

Leadership Perspectives from Industry Events
Search
Thought Leadership and Analyst Meet


Our Clients
6WResearch In News
- Doha a strategic location for EV manufacturing hub: IPA Qatar
- Demand for luxury TVs surging in the GCC, says Samsung
- Empowering Growth: The Thriving Journey of Bangladesh’s Cable Industry
- Demand for luxury TVs surging in the GCC, says Samsung
- Video call with a traditional healer? Once unthinkable, it’s now common in South Africa
- Intelligent Buildings To Smooth GCC’s Path To Net Zero
Latest Reports
- Taiwan Airport Wireless Infrastructure Market (2026-2032)
- Vietnam Airport Wireless Infrastructure Market (2026-2032)
- Thailand Airport Wireless Infrastructure Market (2026-2032)
- South Korea Airport Wireless Infrastructure Market (2026-2032)
- Romania Airport Wireless Infrastructure Market (2026-2032)
- Qatar Airport Wireless Infrastructure Market (2026-2032)
- Philippines Airport Wireless Infrastructure Market (2026-2032)
- Japan Airport Wireless Infrastructure Market (2026-2032)
- Taiwan Airport Winter Services Market (2026-2032)
- Vietnam Airport Winter Services Market (2026-2032)
Industry Events and Analyst Meet

HIMTEX 2026

India Refining Summit 2026

India EV Show 2026

EV tech India Expo 2026

Auto Tech Asia 2026
Whitepaper
- Middle East & Africa Commercial Security Market Click here to view more.
- Middle East & Africa Fire Safety Systems & Equipment Market Click here to view more.
- GCC Drone Market Click here to view more.
- Middle East Lighting Fixture Market Click here to view more.
- GCC Physical & Perimeter Security Market Click here to view more.