Sweden Adipic acid Market (2026-2032) | Revenue, Trends, Companies, Growth, Size, Industry, Segmentation, Share, Forecast, Outlook, Value & Analysis
Market Forecast By Application (Nylon 6,6 Fiber, Nylon 6,6 Resin, Polyurethane, Adipate Esters, Others), By Raw Material (Cyclohexanol, Cyclohexanone) And Competitive Landscape
| Product Code: ETC4820560 | Publication Date: Nov 2023 | Updated Date: Apr 2026 | Product Type: Market Research Report | |
| Publisher: 6Wresearch | Author: Shubham Padhi | No. of Pages: 60 | No. of Figures: 30 | No. of Tables: 5 |
Sweden Adipic Acid Market Size (2020-2030)
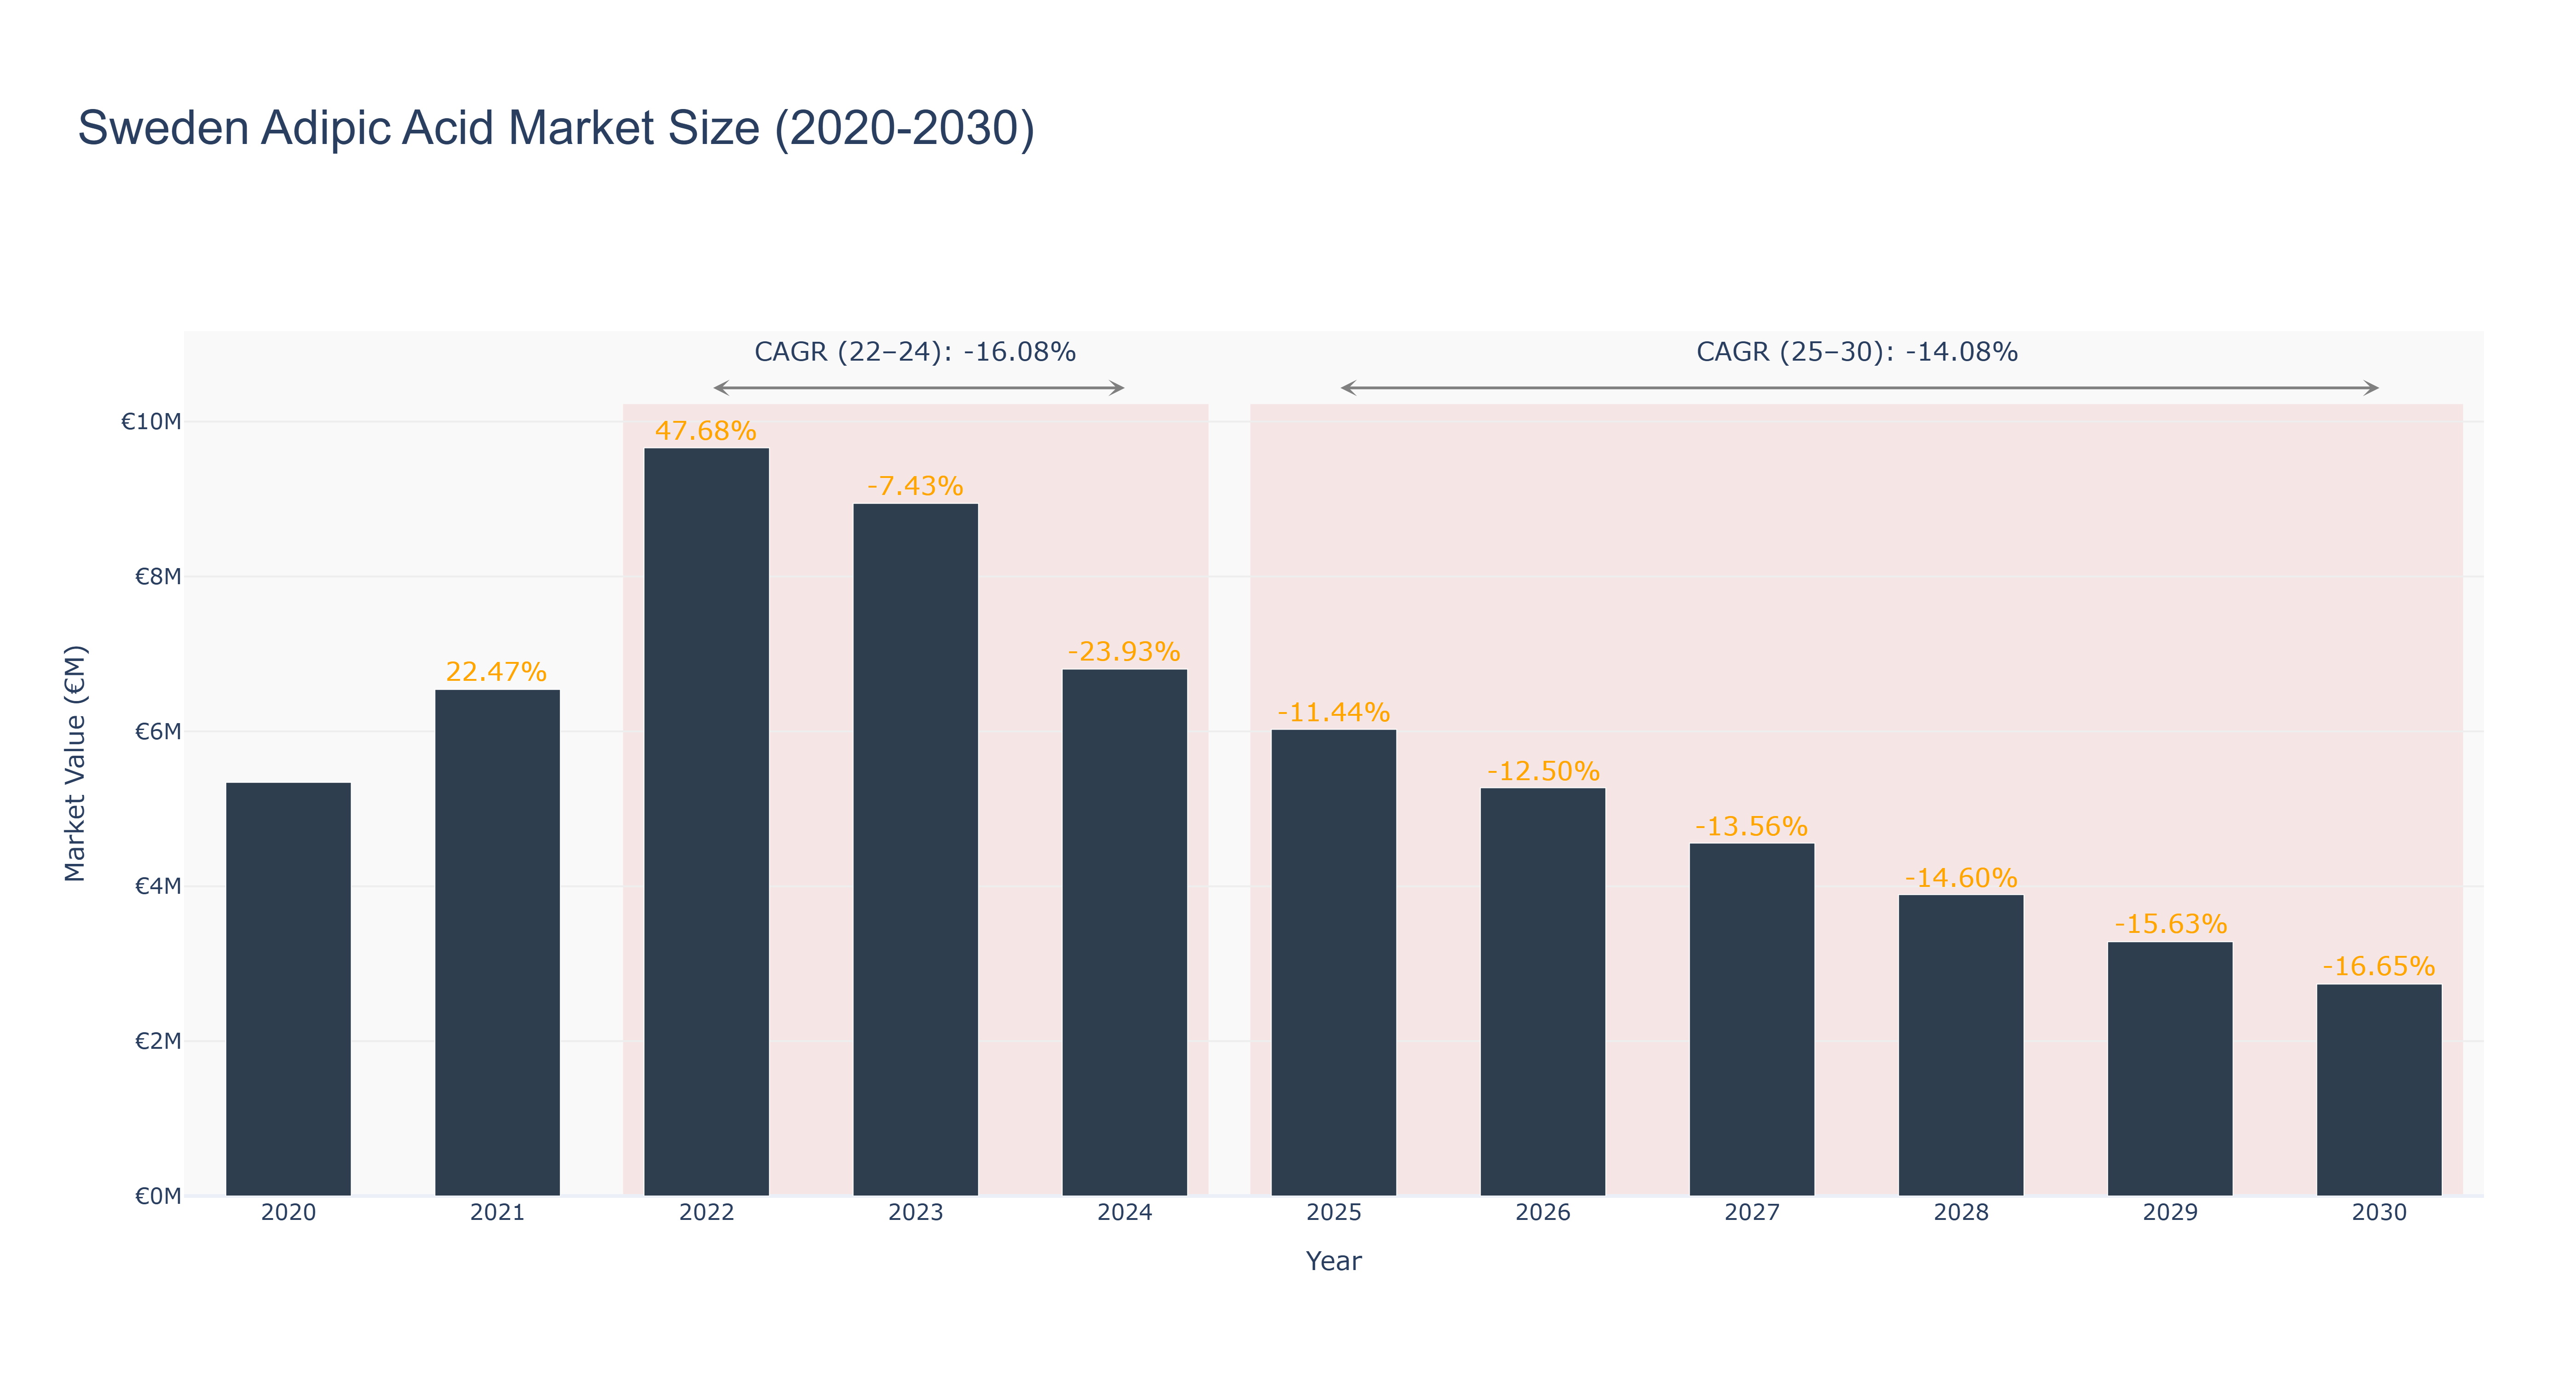
Sweden's Adipic Acid Market has seen a fluctuating trend over the years. The peak market size of €9.66 million was recorded in 2022, followed by a decline to €2.74 million in 2030. The market experienced a significant drop in market size from 2024 to 2025, possibly due to decreased demand or external economic factors. The forecasted CAGR for the period 2025-2030 is -14.08%, indicating a continued downward trend. Industry drivers such as changing consumer preferences towards eco-friendly alternatives and regulatory shifts may have impacted the market dynamics. Looking ahead, Sweden is focusing on sustainable production methods and green initiatives in the chemical industry, with upcoming projects aimed at reducing carbon footprint and enhancing environmental sustainability in the Adipic Acid sector.
Sweden Adipic Acid Market: Production & Trade Performance (2019-2025)
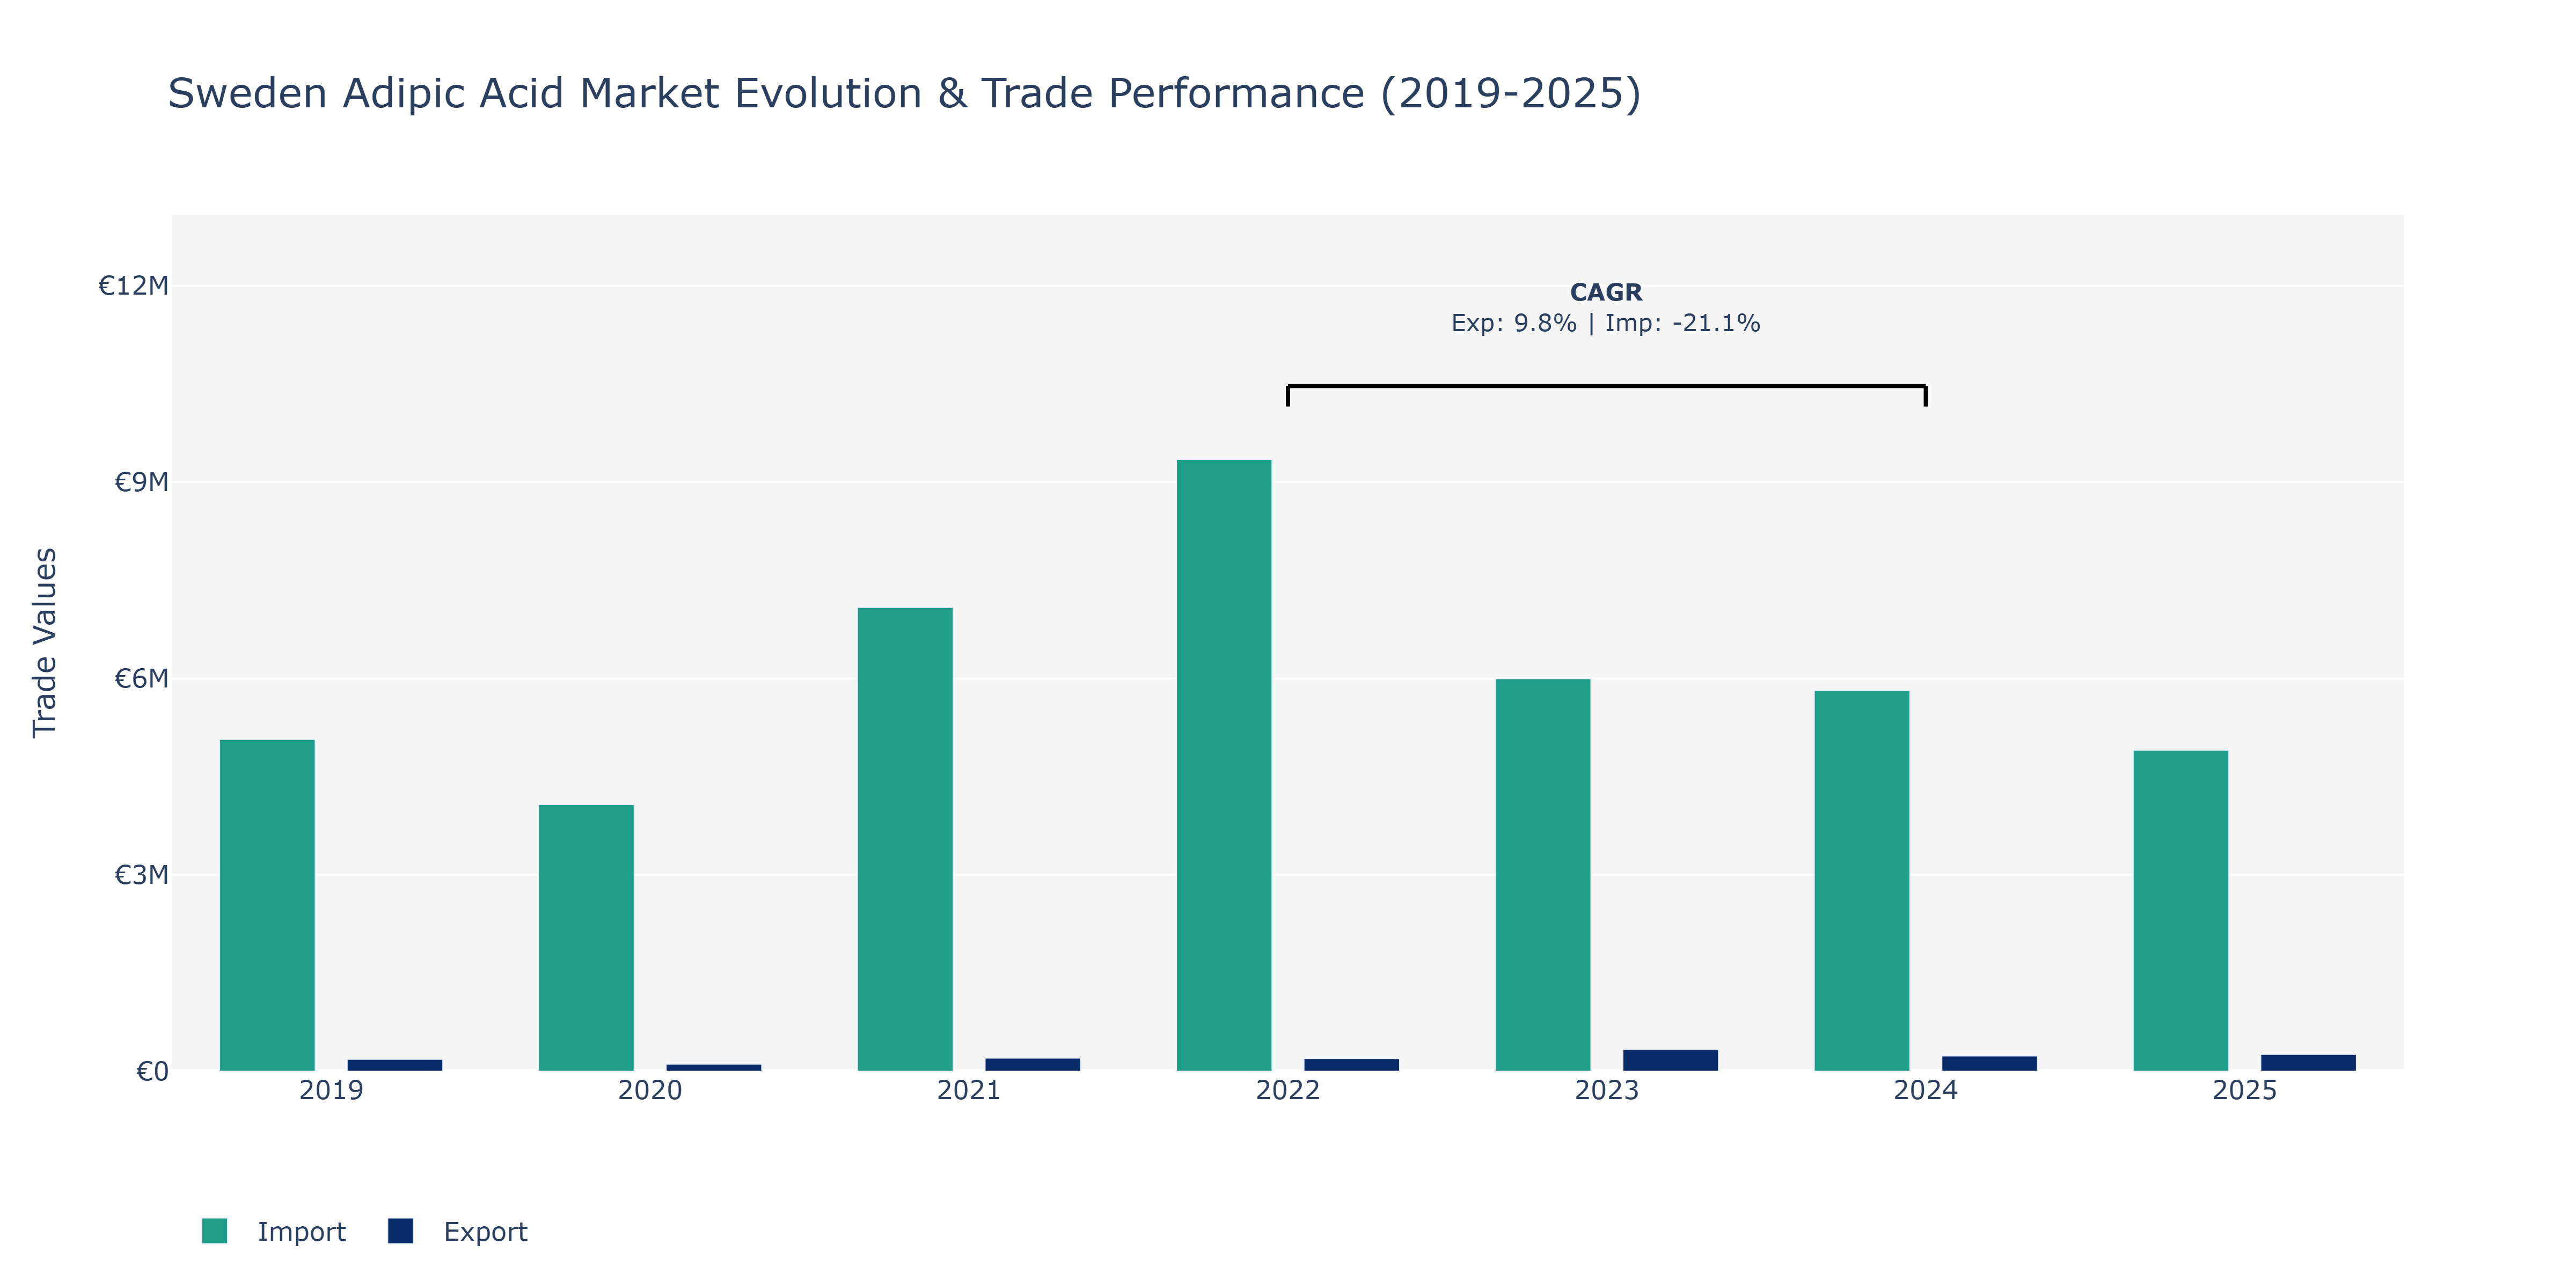
Between 2019 and 2025, Sweden's Adipic Acid Market showed varying trends in both exports and imports. In 2019, exports stood at €181.82 thousand, dipping to €108.21 thousand in 2020 before rebounding to €201.34 thousand in 2021, marking a peak. This was followed by a slight decline in 2022 to €194.08 thousand, before experiencing a substantial increase to €329.62 thousand in 2023, another peak point, and then stabilizing around €234.10 thousand in 2024 and €256.00 thousand in 2025. Conversely, imports demonstrated a different pattern, starting at €5.07 million in 2019 and fluctuating to €4.08 million in 2020, then surging to €7.09 million in 2021, reaching a peak. The trend reversed in 2022 with a slight decrease to €5.99 million, followed by a further decline to €5.81 million in 2023, and €4.90 million in 2025. These fluctuations in exports and imports can be attributed to global demand shifts, price variations, and regulatory changes impacting the Adipic Acid Market. The increase in exports could be linked to enhanced production capacities or improved product quality, while the import fluctuations might be influenced by changes in raw material sourcing strategies or domestic market dynamics.
Key Highlights of the Report:
- Sweden Adipic acid Market Outlook
- Market Size of Sweden Adipic acid Market, 2025
- Forecast of Sweden Adipic acid Market, 2032
- Historical Data and Forecast of Sweden Adipic acid Revenues & Volume for the Period 2022 - 2032F
- Sweden Adipic acid Market Trend Evolution
- Sweden Adipic acid Market Drivers and Challenges
- Sweden Adipic acid Price Trends
- Sweden Adipic acid Porter`s Five Forces
- Sweden Adipic acid Industry Life Cycle
- Historical Data and Forecast of Sweden Adipic acid Market Revenues & Volume By Application for the Period 2022 - 2032F
- Historical Data and Forecast of Sweden Adipic acid Market Revenues & Volume By Nylon 6,6 Fiber for the Period 2022 - 2032F
- Historical Data and Forecast of Sweden Adipic acid Market Revenues & Volume By Nylon 6,6 Resin for the Period 2022 - 2032F
- Historical Data and Forecast of Sweden Adipic acid Market Revenues & Volume By Polyurethane for the Period 2022 - 2032F
- Historical Data and Forecast of Sweden Adipic acid Market Revenues & Volume By Adipate Esters for the Period 2022 - 2032F
- Historical Data and Forecast of Sweden Adipic acid Market Revenues & Volume By Others for the Period 2022 - 2032F
- Historical Data and Forecast of Sweden Adipic acid Market Revenues & Volume By Raw Material for the Period 2022 - 2032F
- Historical Data and Forecast of Sweden Adipic acid Market Revenues & Volume By Cyclohexanol for the Period 2022 - 2032F
- Historical Data and Forecast of Sweden Adipic acid Market Revenues & Volume By Cyclohexanone for the Period 2022 - 2032F
- Sweden Adipic acid Import Export Trade Statistics
- Market Opportunity Assessment By Application
- Market Opportunity Assessment By Raw Material
- Sweden Adipic acid Top Companies Market Share
- Sweden Adipic acid Competitive Benchmarking By Technical and Operational Parameters
- Sweden Adipic acid Company Profiles
- Sweden Adipic acid Key Strategic Recommendations
Frequently Asked Questions About the Market Study (FAQs):
6Wresearch actively monitors the Sweden Adipic acid Market and publishes its comprehensive annual report, highlighting emerging trends, growth drivers, revenue analysis, and forecast outlook. Our insights help businesses to make data-backed strategic decisions with ongoing market dynamics. Our analysts track relevent industries related to the Sweden Adipic acid Market, allowing our clients with actionable intelligence and reliable forecasts tailored to emerging regional needs.
Yes, we provide customisation as per your requirements. To learn more, feel free to contact us on sales@6wresearch.com
1 Executive Summary |
2 Introduction |
2.1 Key Highlights of the Report |
2.2 Report Description |
2.3 Market Scope & Segmentation |
2.4 Research Methodology |
2.5 Assumptions |
3 Sweden Adipic acid Market Overview |
3.1 Sweden Country Macro Economic Indicators |
3.2 Sweden Adipic acid Market Revenues & Volume, 2022 & 2032F |
3.3 Sweden Adipic acid Market - Industry Life Cycle |
3.4 Sweden Adipic acid Market - Porter's Five Forces |
3.5 Sweden Adipic acid Market Revenues & Volume Share, By Application, 2022 & 2032F |
3.6 Sweden Adipic acid Market Revenues & Volume Share, By Raw Material, 2022 & 2032F |
4 Sweden Adipic acid Market Dynamics |
4.1 Impact Analysis |
4.2 Market Drivers |
4.2.1 Increasing demand for adipic acid in the production of nylon and other polymers |
4.2.2 Growing awareness about environmental sustainability leading to the use of bio-based adipic acid |
4.2.3 Government initiatives promoting the use of adipic acid in various industries |
4.3 Market Restraints |
4.3.1 Fluctuating prices of raw materials impacting the production cost of adipic acid |
4.3.2 Stringent regulations related to the use and disposal of adipic acid |
4.3.3 Competition from alternative chemicals and materials affecting market growth |
5 Sweden Adipic acid Market Trends |
6 Sweden Adipic acid Market Segmentations |
6.1 Sweden Adipic acid Market, By Application |
6.1.1 Overview and Analysis |
6.1.2 Sweden Adipic acid Market Revenues & Volume, By Nylon 6,6 Fiber, 2022 - 2032F |
6.1.3 Sweden Adipic acid Market Revenues & Volume, By Nylon 6,6 Resin, 2022 - 2032F |
6.1.4 Sweden Adipic acid Market Revenues & Volume, By Polyurethane, 2022 - 2032F |
6.1.5 Sweden Adipic acid Market Revenues & Volume, By Adipate Esters, 2022 - 2032F |
6.1.6 Sweden Adipic acid Market Revenues & Volume, By Others, 2022 - 2032F |
6.2 Sweden Adipic acid Market, By Raw Material |
6.2.1 Overview and Analysis |
6.2.2 Sweden Adipic acid Market Revenues & Volume, By Cyclohexanol, 2022 - 2032F |
6.2.3 Sweden Adipic acid Market Revenues & Volume, By Cyclohexanone, 2022 - 2032F |
7 Sweden Adipic acid Market Import-Export Trade Statistics |
7.1 Sweden Adipic acid Market Export to Major Countries |
7.2 Sweden Adipic acid Market Imports from Major Countries |
8 Sweden Adipic acid Market Key Performance Indicators |
8.1 Research and development investment in bio-based adipic acid technology |
8.2 Adoption rate of adipic acid in new applications and industries |
8.3 Environmental impact assessment and sustainability certifications for adipic acid production |
9 Sweden Adipic acid Market - Opportunity Assessment |
9.1 Sweden Adipic acid Market Opportunity Assessment, By Application, 2022 & 2032F |
9.2 Sweden Adipic acid Market Opportunity Assessment, By Raw Material, 2022 & 2032F |
10 Sweden Adipic acid Market - Competitive Landscape |
10.1 Sweden Adipic acid Market Revenue Share, By Companies, 2025 |
10.2 Sweden Adipic acid Market Competitive Benchmarking, By Operating and Technical Parameters |
11 Company Profiles |
12 Recommendations | 13 Disclaimer |
Global Go To Market Strategy - 2030
Export potential enables firms to identify high-growth global markets with greater confidence by combining advanced trade intelligence with a structured quantitative methodology. The framework analyzes emerging demand trends and country-level import patterns while integrating macroeconomic and trade datasets such as GDP and population forecasts, bilateral import–export flows, tariff structures, elasticity differentials between developed and developing economies, geographic distance, and import demand projections. Using weighted trade values from 2020–2024 as the base period to project country-to-country export potential for 2030, these inputs are operationalized through calculated drivers such as gravity model parameters, tariff impact factors, and projected GDP per-capita growth. Through an analysis of hidden potentials, demand hotspots, and market conditions that are most favorable to success, this method enables firms to focus on target countries, maximize returns, and global expansion with data, backed by accuracy.
By factoring in the projected importer demand gap that is currently unmet and could be potential opportunity, it identifies the potential for the Exporter (Country) among 190 countries, against the general trade analysis, which identifies the biggest importer or exporter.
To discover high-growth global markets and optimize your business strategy:
Click Here
Pricing
- Single User License$ 1,995
- Department License$ 2,400
- Site License$ 3,120
- Global License$ 3,795

Leadership Perspectives from Industry Events
Search
Thought Leadership and Analyst Meet


Our Clients
6WResearch In News
- Doha a strategic location for EV manufacturing hub: IPA Qatar
- Demand for luxury TVs surging in the GCC, says Samsung
- Empowering Growth: The Thriving Journey of Bangladesh’s Cable Industry
- Demand for luxury TVs surging in the GCC, says Samsung
- Video call with a traditional healer? Once unthinkable, it’s now common in South Africa
- Intelligent Buildings To Smooth GCC’s Path To Net Zero
Latest Reports
- Taiwan Airport Wireless Infrastructure Market (2026-2032)
- Vietnam Airport Wireless Infrastructure Market (2026-2032)
- Thailand Airport Wireless Infrastructure Market (2026-2032)
- South Korea Airport Wireless Infrastructure Market (2026-2032)
- Romania Airport Wireless Infrastructure Market (2026-2032)
- Qatar Airport Wireless Infrastructure Market (2026-2032)
- Philippines Airport Wireless Infrastructure Market (2026-2032)
- Japan Airport Wireless Infrastructure Market (2026-2032)
- Taiwan Airport Winter Services Market (2026-2032)
- Vietnam Airport Winter Services Market (2026-2032)
Industry Events and Analyst Meet

HIMTEX 2026

India Refining Summit 2026

India EV Show 2026

EV tech India Expo 2026

Auto Tech Asia 2026
Whitepaper
- Middle East & Africa Commercial Security Market Click here to view more.
- Middle East & Africa Fire Safety Systems & Equipment Market Click here to view more.
- GCC Drone Market Click here to view more.
- Middle East Lighting Fixture Market Click here to view more.
- GCC Physical & Perimeter Security Market Click here to view more.