Sweden Cereal Bars Market (2026-2032) | Companies, Consumer Insights, Competitive, Value, Competition, Pricing Analysis, Revenue, Strategy, Segments, Growth, Forecast, Analysis, Restraints, Share, Challenges, Supply, Strategic Insights, Drivers, Size, Outlook, Opportunities, Trends, Industry, Segmentation, Investment Trends, Demand
Market Forecast By Product Type (Granola Bars, Protein Bars, Energy Bars, Low Sugar Bars), By Technology Type (Baked Technology, Cold-pressed Technology, Extrusion Technology, Natural Sweeteners), By End User (Health-conscious Consumers, Fitness Enthusiasts, Busy Professionals, Diet-conscious Consumers), By Application (On-the-go Breakfast, Post-Workout Nutrition, Quick Energy Boost, Low-calorie Snack) And Competitive Landscape
| Product Code: ETC11562859 | Publication Date: Apr 2025 | Updated Date: Apr 2026 | Product Type: Market Research Report | |
| Publisher: 6Wresearch | Author: Bhawna Singh | No. of Pages: 65 | No. of Figures: 34 | No. of Tables: 19 |
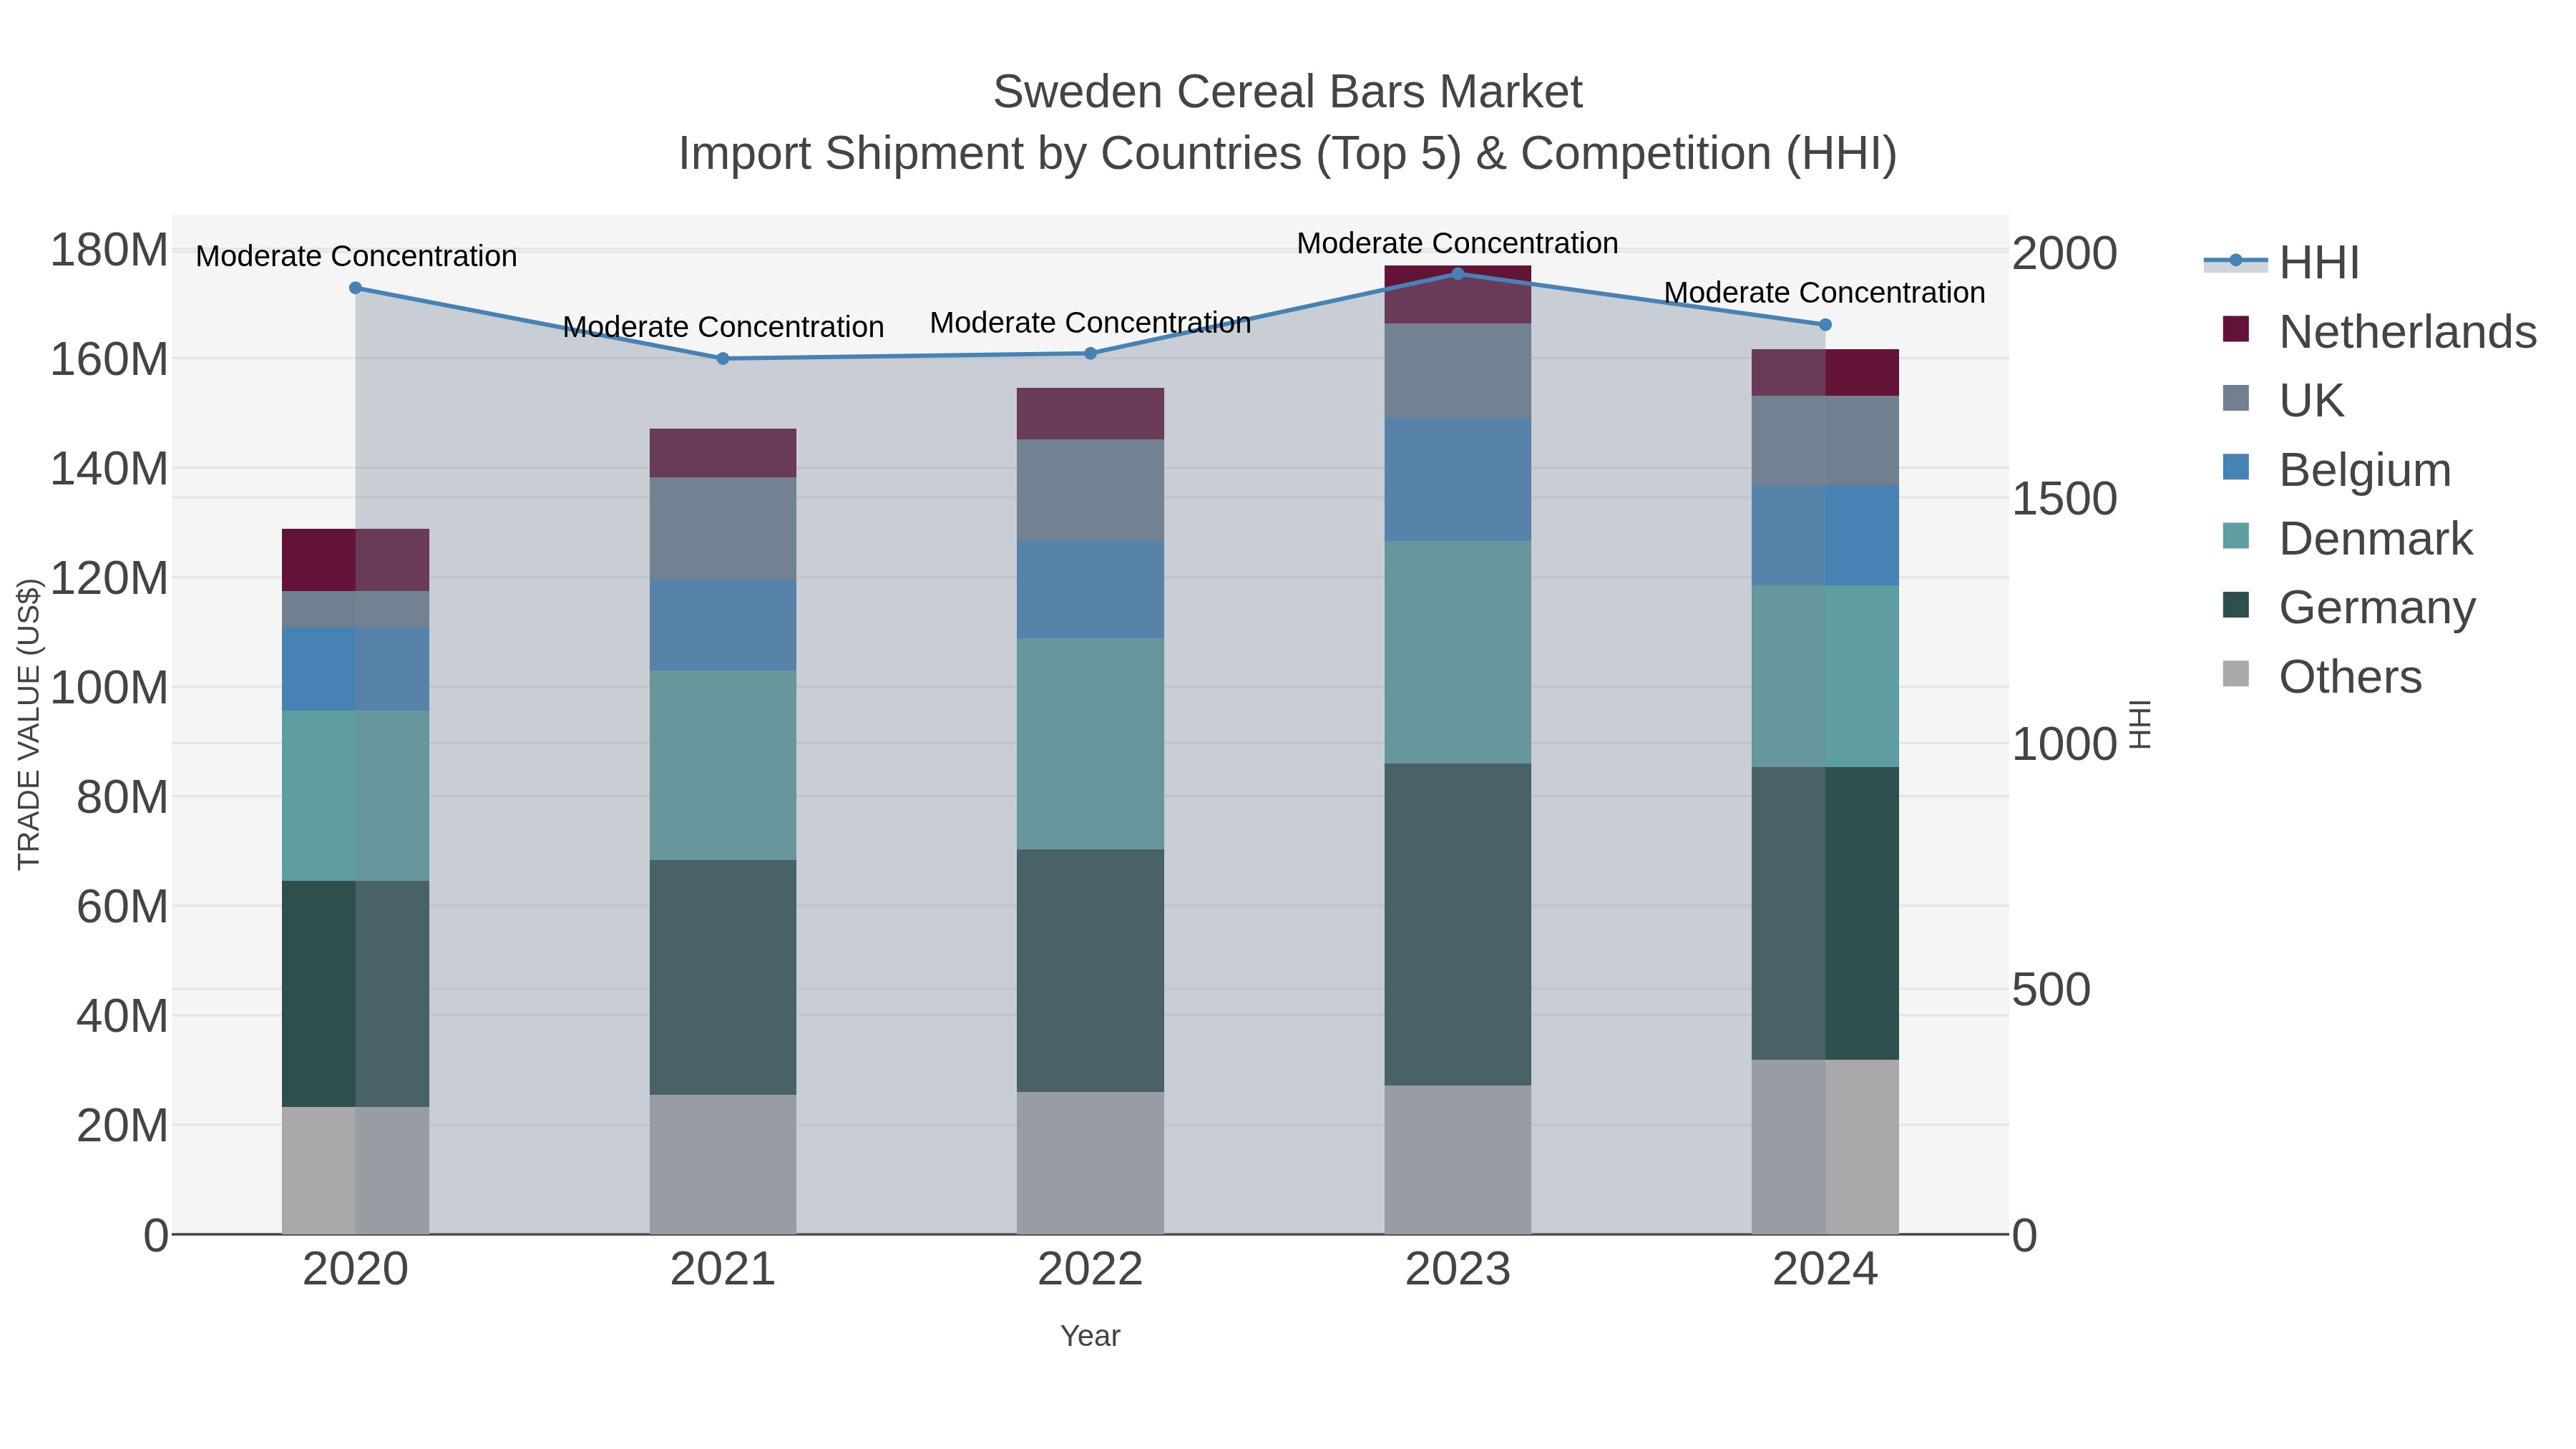
Sweden Cereal Bars Market Top 5 Importing Countries and Market Competition (HHI) Analysis
In 2024, Sweden saw a steady increase in cereal bar import shipments, with top exporters being Germany, Denmark, Belgium, UK, and Poland. The market displayed moderate concentration based on the Herfindahl-Hirschman Index (HHI). Despite a slight decline in growth rate from 2023 to 2024, the compound annual growth rate (CAGR) for the period 2020-2024 remained positive at 5.84%, indicating a consistent demand for cereal bars in Sweden. The diversity of exporting countries suggests a competitive market landscape driving innovation and variety for consumers.
Key Highlights of the Report:
- Sweden Cereal Bars Market Outlook
- Market Size of Sweden Cereal Bars Market, 2025
- Forecast of Sweden Cereal Bars Market, 2032
- Historical Data and Forecast of Sweden Cereal Bars Revenues & Volume for the Period 2022 - 2032F
- Sweden Cereal Bars Market Trend Evolution
- Sweden Cereal Bars Market Drivers and Challenges
- Sweden Cereal Bars Price Trends
- Sweden Cereal Bars Porter's Five Forces
- Sweden Cereal Bars Industry Life Cycle
- Historical Data and Forecast of Sweden Cereal Bars Market Revenues & Volume By Product Type for the Period 2022 - 2032F
- Historical Data and Forecast of Sweden Cereal Bars Market Revenues & Volume By Granola Bars for the Period 2022 - 2032F
- Historical Data and Forecast of Sweden Cereal Bars Market Revenues & Volume By Protein Bars for the Period 2022 - 2032F
- Historical Data and Forecast of Sweden Cereal Bars Market Revenues & Volume By Energy Bars for the Period 2022 - 2032F
- Historical Data and Forecast of Sweden Cereal Bars Market Revenues & Volume By Low Sugar Bars for the Period 2022 - 2032F
- Historical Data and Forecast of Sweden Cereal Bars Market Revenues & Volume By Technology Type for the Period 2022 - 2032F
- Historical Data and Forecast of Sweden Cereal Bars Market Revenues & Volume By Baked Technology for the Period 2022 - 2032F
- Historical Data and Forecast of Sweden Cereal Bars Market Revenues & Volume By Cold-pressed Technology for the Period 2022 - 2032F
- Historical Data and Forecast of Sweden Cereal Bars Market Revenues & Volume By Extrusion Technology for the Period 2022 - 2032F
- Historical Data and Forecast of Sweden Cereal Bars Market Revenues & Volume By Natural Sweeteners for the Period 2022 - 2032F
- Historical Data and Forecast of Sweden Cereal Bars Market Revenues & Volume By End User for the Period 2022 - 2032F
- Historical Data and Forecast of Sweden Cereal Bars Market Revenues & Volume By Health-conscious Consumers for the Period 2022 - 2032F
- Historical Data and Forecast of Sweden Cereal Bars Market Revenues & Volume By Fitness Enthusiasts for the Period 2022 - 2032F
- Historical Data and Forecast of Sweden Cereal Bars Market Revenues & Volume By Busy Professionals for the Period 2022 - 2032F
- Historical Data and Forecast of Sweden Cereal Bars Market Revenues & Volume By Diet-conscious Consumers for the Period 2022 - 2032F
- Historical Data and Forecast of Sweden Cereal Bars Market Revenues & Volume By Application for the Period 2022 - 2032F
- Historical Data and Forecast of Sweden Cereal Bars Market Revenues & Volume By On-the-go Breakfast for the Period 2022 - 2032F
- Historical Data and Forecast of Sweden Cereal Bars Market Revenues & Volume By Post-Workout Nutrition for the Period 2022 - 2032F
- Historical Data and Forecast of Sweden Cereal Bars Market Revenues & Volume By Quick Energy Boost for the Period 2022 - 2032F
- Historical Data and Forecast of Sweden Cereal Bars Market Revenues & Volume By Low-calorie Snack for the Period 2022 - 2032F
- Sweden Cereal Bars Import Export Trade Statistics
- Market Opportunity Assessment By Product Type
- Market Opportunity Assessment By Technology Type
- Market Opportunity Assessment By End User
- Market Opportunity Assessment By Application
- Sweden Cereal Bars Top Companies Market Share
- Sweden Cereal Bars Competitive Benchmarking By Technical and Operational Parameters
- Sweden Cereal Bars Company Profiles
- Sweden Cereal Bars Key Strategic Recommendations
Frequently Asked Questions About the Market Study (FAQs):
6Wresearch actively monitors the Sweden Cereal Bars Market and publishes its comprehensive annual report, highlighting emerging trends, growth drivers, revenue analysis, and forecast outlook. Our insights help businesses to make data-backed strategic decisions with ongoing market dynamics. Our analysts track relevent industries related to the Sweden Cereal Bars Market, allowing our clients with actionable intelligence and reliable forecasts tailored to emerging regional needs.
Yes, we provide customisation as per your requirements. To learn more, feel free to contact us on sales@6wresearch.com
1 Executive Summary |
2 Introduction |
2.1 Key Highlights of the Report |
2.2 Report Description |
2.3 Market Scope & Segmentation |
2.4 Research Methodology |
2.5 Assumptions |
3 Sweden Cereal Bars Market Overview |
3.1 Sweden Country Macro Economic Indicators |
3.2 Sweden Cereal Bars Market Revenues & Volume, 2022 & 2032F |
3.3 Sweden Cereal Bars Market - Industry Life Cycle |
3.4 Sweden Cereal Bars Market - Porter's Five Forces |
3.5 Sweden Cereal Bars Market Revenues & Volume Share, By Product Type, 2022 & 2032F |
3.6 Sweden Cereal Bars Market Revenues & Volume Share, By Technology Type, 2022 & 2032F |
3.7 Sweden Cereal Bars Market Revenues & Volume Share, By End User, 2022 & 2032F |
3.8 Sweden Cereal Bars Market Revenues & Volume Share, By Application, 2022 & 2032F |
4 Sweden Cereal Bars Market Dynamics |
4.1 Impact Analysis |
4.2 Market Drivers |
4.2.1 Increased consumer awareness towards health and wellness leading to a growing demand for healthy snack options like cereal bars. |
4.2.2 Rising trend of on-the-go snacking due to busy lifestyles, boosting the consumption of convenient and portable snack items. |
4.2.3 Expansion of distribution channels such as supermarkets, convenience stores, and online platforms, enhancing the accessibility of cereal bars to consumers. |
4.3 Market Restraints |
4.3.1 Intense competition among cereal bar manufacturers leading to price wars and margin pressures. |
4.3.2 Fluctuating prices of key ingredients like oats, nuts, and fruits impacting the production costs of cereal bars. |
4.3.3 Consumer preferences shifting towards fresh and natural snack alternatives, posing a challenge to the market growth of packaged cereal bars. |
5 Sweden Cereal Bars Market Trends |
6 Sweden Cereal Bars Market, By Types |
6.1 Sweden Cereal Bars Market, By Product Type |
6.1.1 Overview and Analysis |
6.1.2 Sweden Cereal Bars Market Revenues & Volume, By Product Type, 2022 - 2032F |
6.1.3 Sweden Cereal Bars Market Revenues & Volume, By Granola Bars, 2022 - 2032F |
6.1.4 Sweden Cereal Bars Market Revenues & Volume, By Protein Bars, 2022 - 2032F |
6.1.5 Sweden Cereal Bars Market Revenues & Volume, By Energy Bars, 2022 - 2032F |
6.1.6 Sweden Cereal Bars Market Revenues & Volume, By Low Sugar Bars, 2022 - 2032F |
6.2 Sweden Cereal Bars Market, By Technology Type |
6.2.1 Overview and Analysis |
6.2.2 Sweden Cereal Bars Market Revenues & Volume, By Baked Technology, 2022 - 2032F |
6.2.3 Sweden Cereal Bars Market Revenues & Volume, By Cold-pressed Technology, 2022 - 2032F |
6.2.4 Sweden Cereal Bars Market Revenues & Volume, By Extrusion Technology, 2022 - 2032F |
6.2.5 Sweden Cereal Bars Market Revenues & Volume, By Natural Sweeteners, 2022 - 2032F |
6.3 Sweden Cereal Bars Market, By End User |
6.3.1 Overview and Analysis |
6.3.2 Sweden Cereal Bars Market Revenues & Volume, By Health-conscious Consumers, 2022 - 2032F |
6.3.3 Sweden Cereal Bars Market Revenues & Volume, By Fitness Enthusiasts, 2022 - 2032F |
6.3.4 Sweden Cereal Bars Market Revenues & Volume, By Busy Professionals, 2022 - 2032F |
6.3.5 Sweden Cereal Bars Market Revenues & Volume, By Diet-conscious Consumers, 2022 - 2032F |
6.4 Sweden Cereal Bars Market, By Application |
6.4.1 Overview and Analysis |
6.4.2 Sweden Cereal Bars Market Revenues & Volume, By On-the-go Breakfast, 2022 - 2032F |
6.4.3 Sweden Cereal Bars Market Revenues & Volume, By Post-Workout Nutrition, 2022 - 2032F |
6.4.4 Sweden Cereal Bars Market Revenues & Volume, By Quick Energy Boost, 2022 - 2032F |
6.4.5 Sweden Cereal Bars Market Revenues & Volume, By Low-calorie Snack, 2022 - 2032F |
7 Sweden Cereal Bars Market Import-Export Trade Statistics |
7.1 Sweden Cereal Bars Market Export to Major Countries |
7.2 Sweden Cereal Bars Market Imports from Major Countries |
8 Sweden Cereal Bars Market Key Performance Indicators |
8.1 Health and wellness trends index reflecting the increasing focus on nutritious snack options. |
8.2 Distribution network penetration rate measuring the reach of cereal bars across various retail channels. |
8.3 Consumer engagement metrics like social media interactions and online reviews indicating the popularity and acceptance of different cereal bar brands. |
9 Sweden Cereal Bars Market - Opportunity Assessment |
9.1 Sweden Cereal Bars Market Opportunity Assessment, By Product Type, 2022 & 2032F |
9.2 Sweden Cereal Bars Market Opportunity Assessment, By Technology Type, 2022 & 2032F |
9.3 Sweden Cereal Bars Market Opportunity Assessment, By End User, 2022 & 2032F |
9.4 Sweden Cereal Bars Market Opportunity Assessment, By Application, 2022 & 2032F |
10 Sweden Cereal Bars Market - Competitive Landscape |
10.1 Sweden Cereal Bars Market Revenue Share, By Companies, 2025 |
10.2 Sweden Cereal Bars Market Competitive Benchmarking, By Operating and Technical Parameters |
11 Company Profiles |
12 Recommendations |
13 Disclaimer |
Export potential assessment - trade Analytics for 2030
Export potential enables firms to identify high-growth global markets with greater confidence by combining advanced trade intelligence with a structured quantitative methodology. The framework analyzes emerging demand trends and country-level import patterns while integrating macroeconomic and trade datasets such as GDP and population forecasts, bilateral import–export flows, tariff structures, elasticity differentials between developed and developing economies, geographic distance, and import demand projections. Using weighted trade values from 2020–2024 as the base period to project country-to-country export potential for 2030, these inputs are operationalized through calculated drivers such as gravity model parameters, tariff impact factors, and projected GDP per-capita growth. Through an analysis of hidden potentials, demand hotspots, and market conditions that are most favorable to success, this method enables firms to focus on target countries, maximize returns, and global expansion with data, backed by accuracy.
By factoring in the projected importer demand gap that is currently unmet and could be potential opportunity, it identifies the potential for the Exporter (Country) among 190 countries, against the general trade analysis, which identifies the biggest importer or exporter.
To discover high-growth global markets and optimize your business strategy:
Click Here
Pricing
- Single User License$ 1,995
- Department License$ 2,400
- Site License$ 3,120
- Global License$ 3,795

Search
Thought Leadership and Analyst Meet


Our Clients
Latest Reports
- Taiwan Food Delivery Platform Market (2026-2032) | Companies, Outlook, Analysis, Trends, Value, Revenue, Segmentation, Share, Forecast, Competitive Landscape, Growth, Size & Forecast
- United Kingdom (UK) Long-term Care Insurance Market (2026-2032) | Growth, Share, Consumer Insights, Drivers, Opportunities, Competition, Pricing Analysis, Segments, Restraints, Companies, Competitive, Value, Outlook, Size, Demand, Analysis, Challenges, Strategic Insights, Investment Trends, Revenue, Trends, Supply, Forecast
- United Kingdom (UK) Long Term Care Market (2026-2032) | Companies, Outlook, Analysis, Trends, Value, Revenue, Segmentation, Share, Forecast, Competitive Landscape, Growth, Size & Forecast
- Iraq Insulation and Waterproofing Market (2026-2032) | Outlook, Drivers, Growth, Size, Share, Industry, Revenue, Trends, Demand, Competitive, Strategic Insights, Opportunities, Segments, Companies, Challenges, Strategy, Consumer Insights, Analysis, Investment Trends, Value, Segmentation, Forecast, Restraints
- India Switchgear Market Outlook (2026-2032) | Size, Share, Trends, Growth, Revenue, Forecast, Analysis, Value, Outlook
- Pakistan Contraceptive Implants Market (2025-2031) | Demand, Growth, Size, Share, Industry, Pricing Analysis, Competitive, Strategic Insights, Strategy, Consumer Insights, Analysis, Investment Trends, Opportunities, Revenue, Segments, Value, Segmentation, Supply, Forecast, Restraints, Outlook, Competition, Drivers, Trends, Companies, Challenges
- Sri Lanka Packaging Market (2026-2032) | Outlook, Competition, Drivers, Trends, Demand, Pricing Analysis, Competitive, Strategic Insights, Companies, Challenges, Strategy, Consumer Insights, Analysis, Investment Trends, Opportunities, Growth, Size, Share, Industry, Revenue, Segments, Value, Segmentation, Supply, Forecast, Restraints
- India Kids Watches Market (2026-2032) | Strategy, Consumer Insights, Analysis, Investment Trends, Opportunities, Growth, Size, Share, Industry, Revenue, Segments, Value, Segmentation, Supply, Forecast, Restraints, Outlook, Competition, Drivers, Trends, Demand, Pricing Analysis, Competitive, Strategic Insights, Companies, Challenges
- Saudi Arabia Core Assurance Service Market (2025-2031) | Strategy, Consumer Insights, Analysis, Investment Trends, Opportunities, Growth, Size, Share, Industry, Revenue, Segments, Value, Segmentation, Supply, Forecast, Restraints, Outlook, Competition, Drivers, Trends, Demand, Pricing Analysis, Competitive, Strategic Insights, Companies, Challenges
- Romania Uninterruptible Power Supply (UPS) Market (2026-2032) | Industry, Analysis, Revenue, Size, Forecast, Outlook, Value, Trends, Share, Growth & Companies
Industry Events and Analyst Meet

India EV Show 2026

EV tech India Expo 2026

Auto Tech Asia 2026

Battery Tech India 2026

Smart Production Solutions Guangzhou 2026
Whitepaper
- Middle East & Africa Commercial Security Market Click here to view more.
- Middle East & Africa Fire Safety Systems & Equipment Market Click here to view more.
- GCC Drone Market Click here to view more.
- Middle East Lighting Fixture Market Click here to view more.
- GCC Physical & Perimeter Security Market Click here to view more.
6WResearch In News
- Doha a strategic location for EV manufacturing hub: IPA Qatar
- Demand for luxury TVs surging in the GCC, says Samsung
- Empowering Growth: The Thriving Journey of Bangladesh’s Cable Industry
- Demand for luxury TVs surging in the GCC, says Samsung
- Video call with a traditional healer? Once unthinkable, it’s now common in South Africa
- Intelligent Buildings To Smooth GCC’s Path To Net Zero