Sweden Magnesia Carbon Bricks Market (2026-2032) | Industry, Segmentation, Pricing Analysis, Restraints, Consumer Insights, Drivers, Segments, Investment Trends, Challenges, Companies, Opportunities, Size, Revenue, Strategy, Strategic Insights, Analysis, Outlook, Forecast, Value, Competitive, Supply, Demand, Growth, Share, Competition, Trends
Market Forecast By Type (High-Carbon, Low-Carbon, Ultra-Low Carbon), By Application (Steelmaking, Electric Arc Furnace, Ladle Furnaces), By End User (Steel Industry, Foundries, Non-Ferrous Metal Industry), By Sales Channel (Direct Sales, Distributors, Online) And Competitive Landscape
| Product Code: ETC12894571 | Publication Date: Apr 2025 | Updated Date: Apr 2026 | Product Type: Market Research Report | |
| Publisher: 6Wresearch | Author: Sachin Kumar Rai | No. of Pages: 65 | No. of Figures: 34 | No. of Tables: 19 |
Sweden Magnesia Carbon Bricks Market Size (2020-2030)
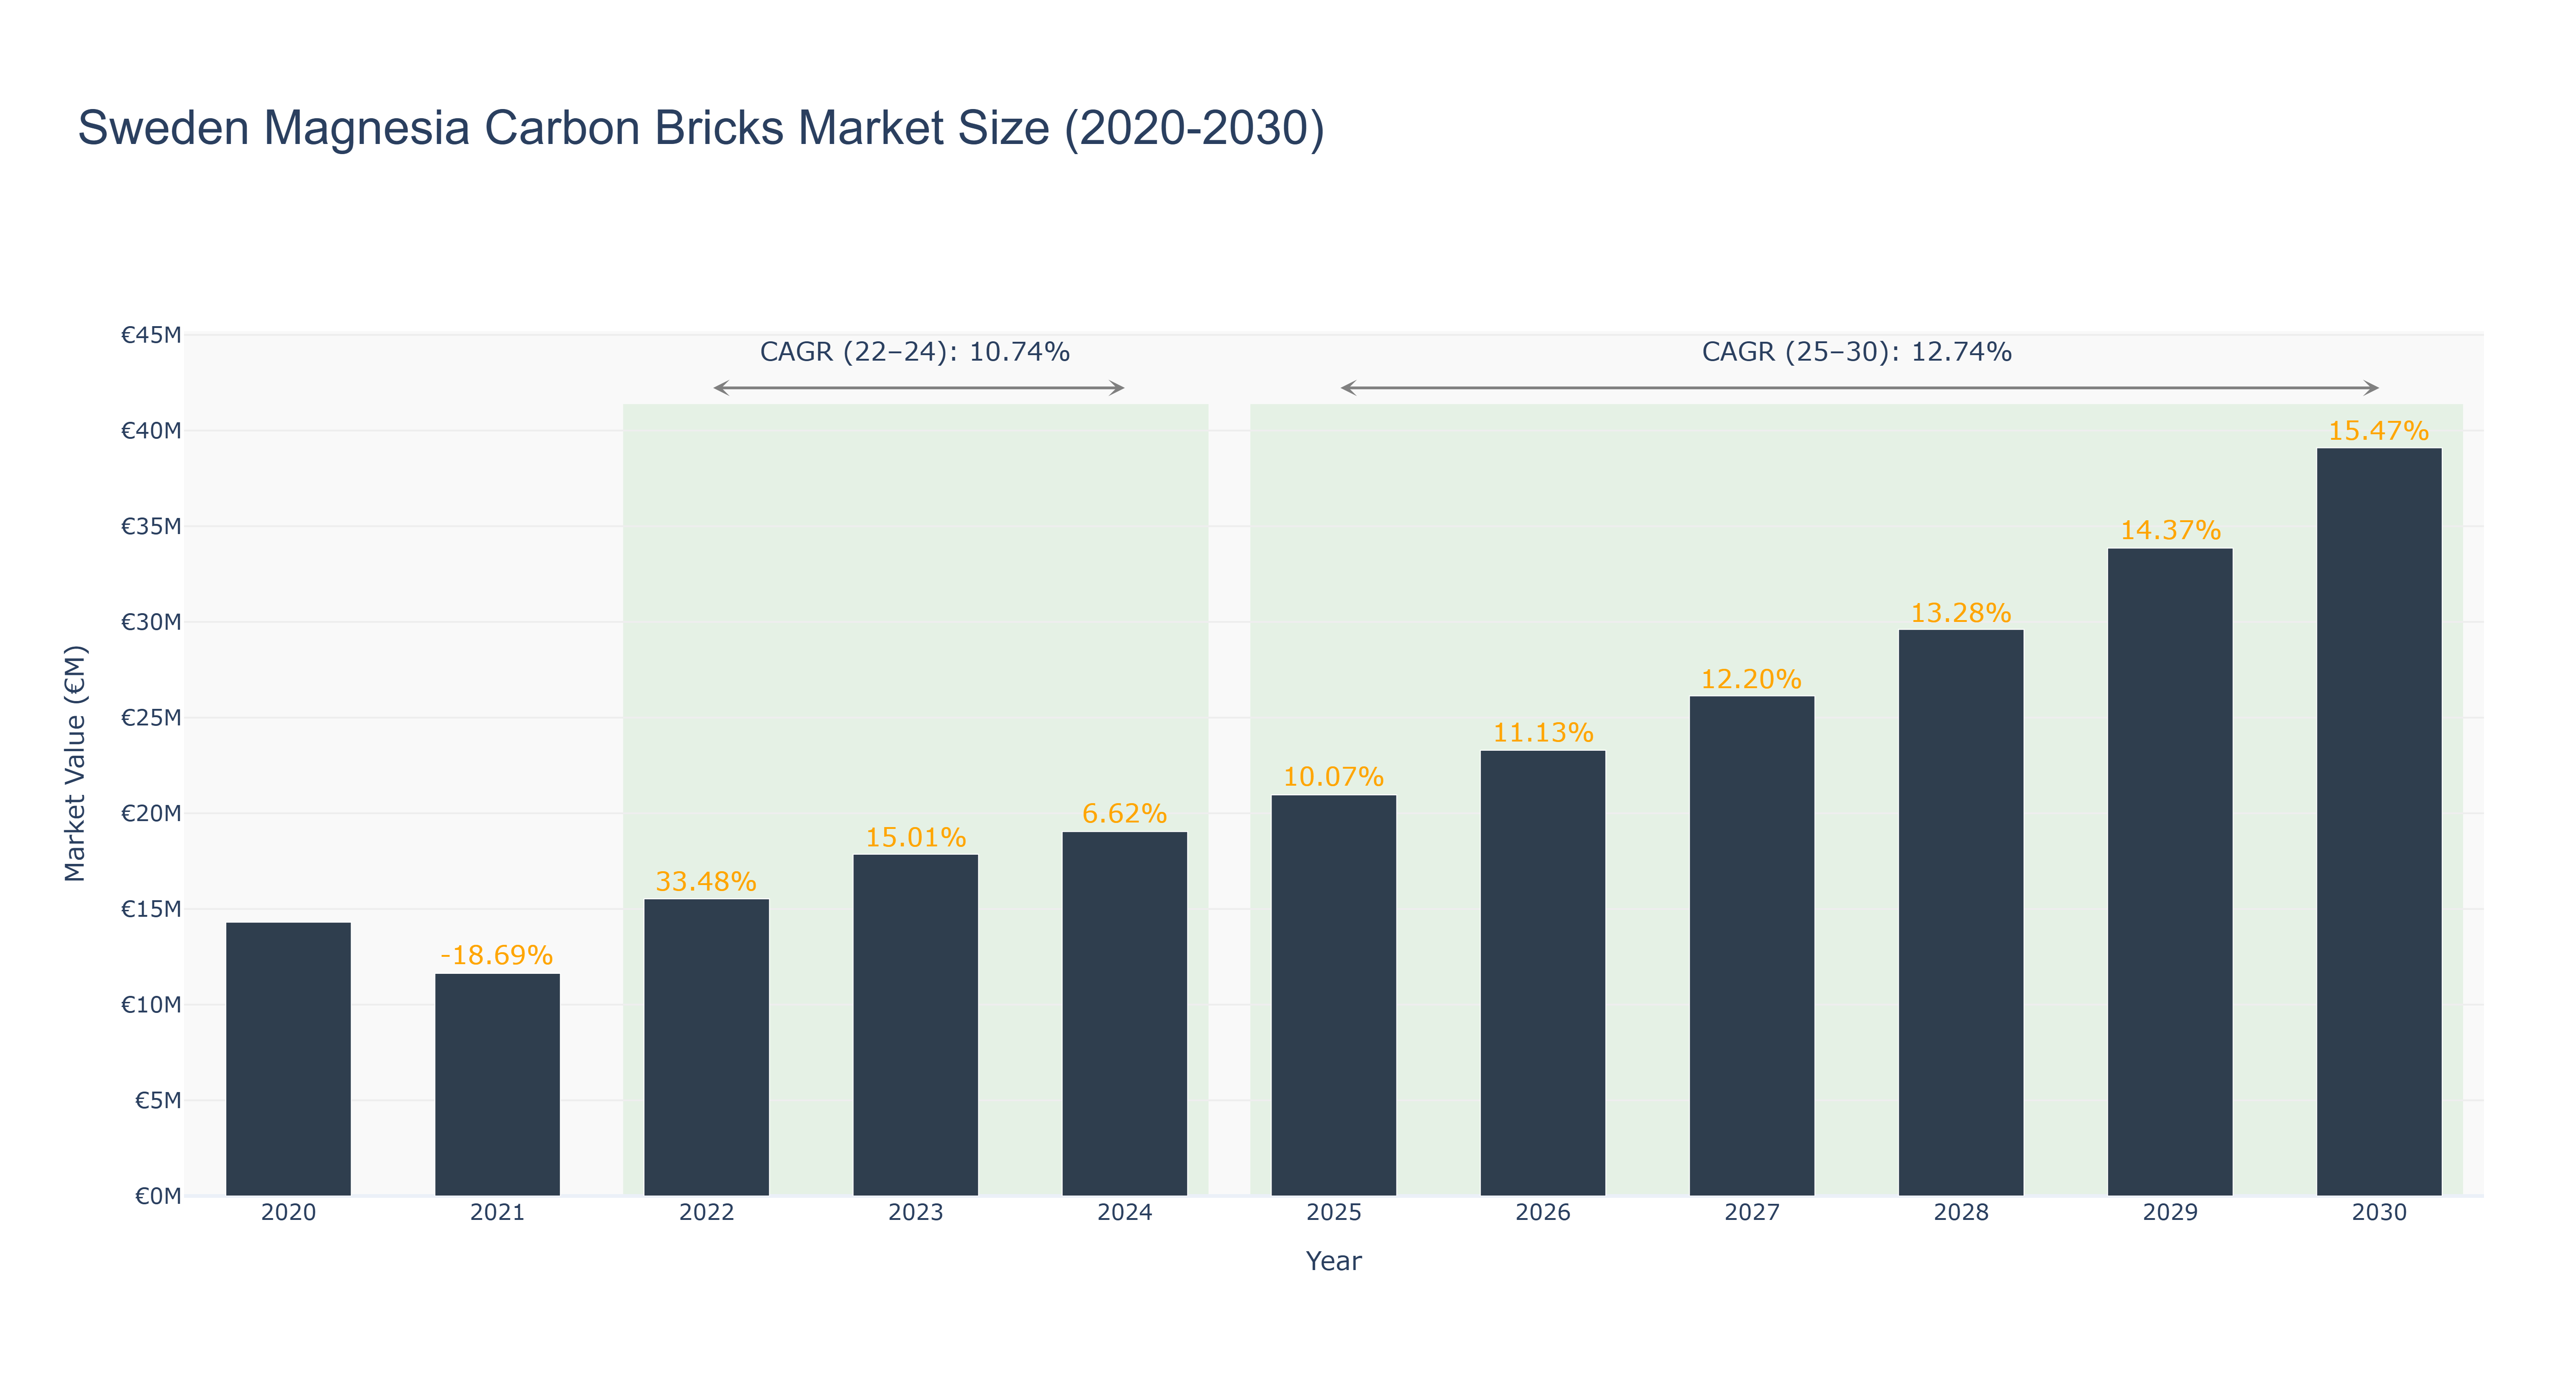
Sweden's Magnesia Carbon Bricks Market has shown a fluctuating trend over the years. The market peaked at €39.10 million in 2030, with a steady growth trajectory. From 2020 to 2024, the market size decreased from €14.31 million to €19.05 million before experiencing a recovery. The forecasted market size from 2025 to 2030 is expected to continue growing, with a CAGR of 12.74% from 2025 to 2030. The market's growth can be attributed to increasing demand in sectors like steel production and construction. Recent developments in sustainable manufacturing processes and innovative product designs are set to further drive market growth in the coming years, solidifying Sweden's position as a key player in the global magnesia carbon bricks market.
Sweden Magnesia Carbon Bricks Market: Production & Trade Performance (2019-2025)
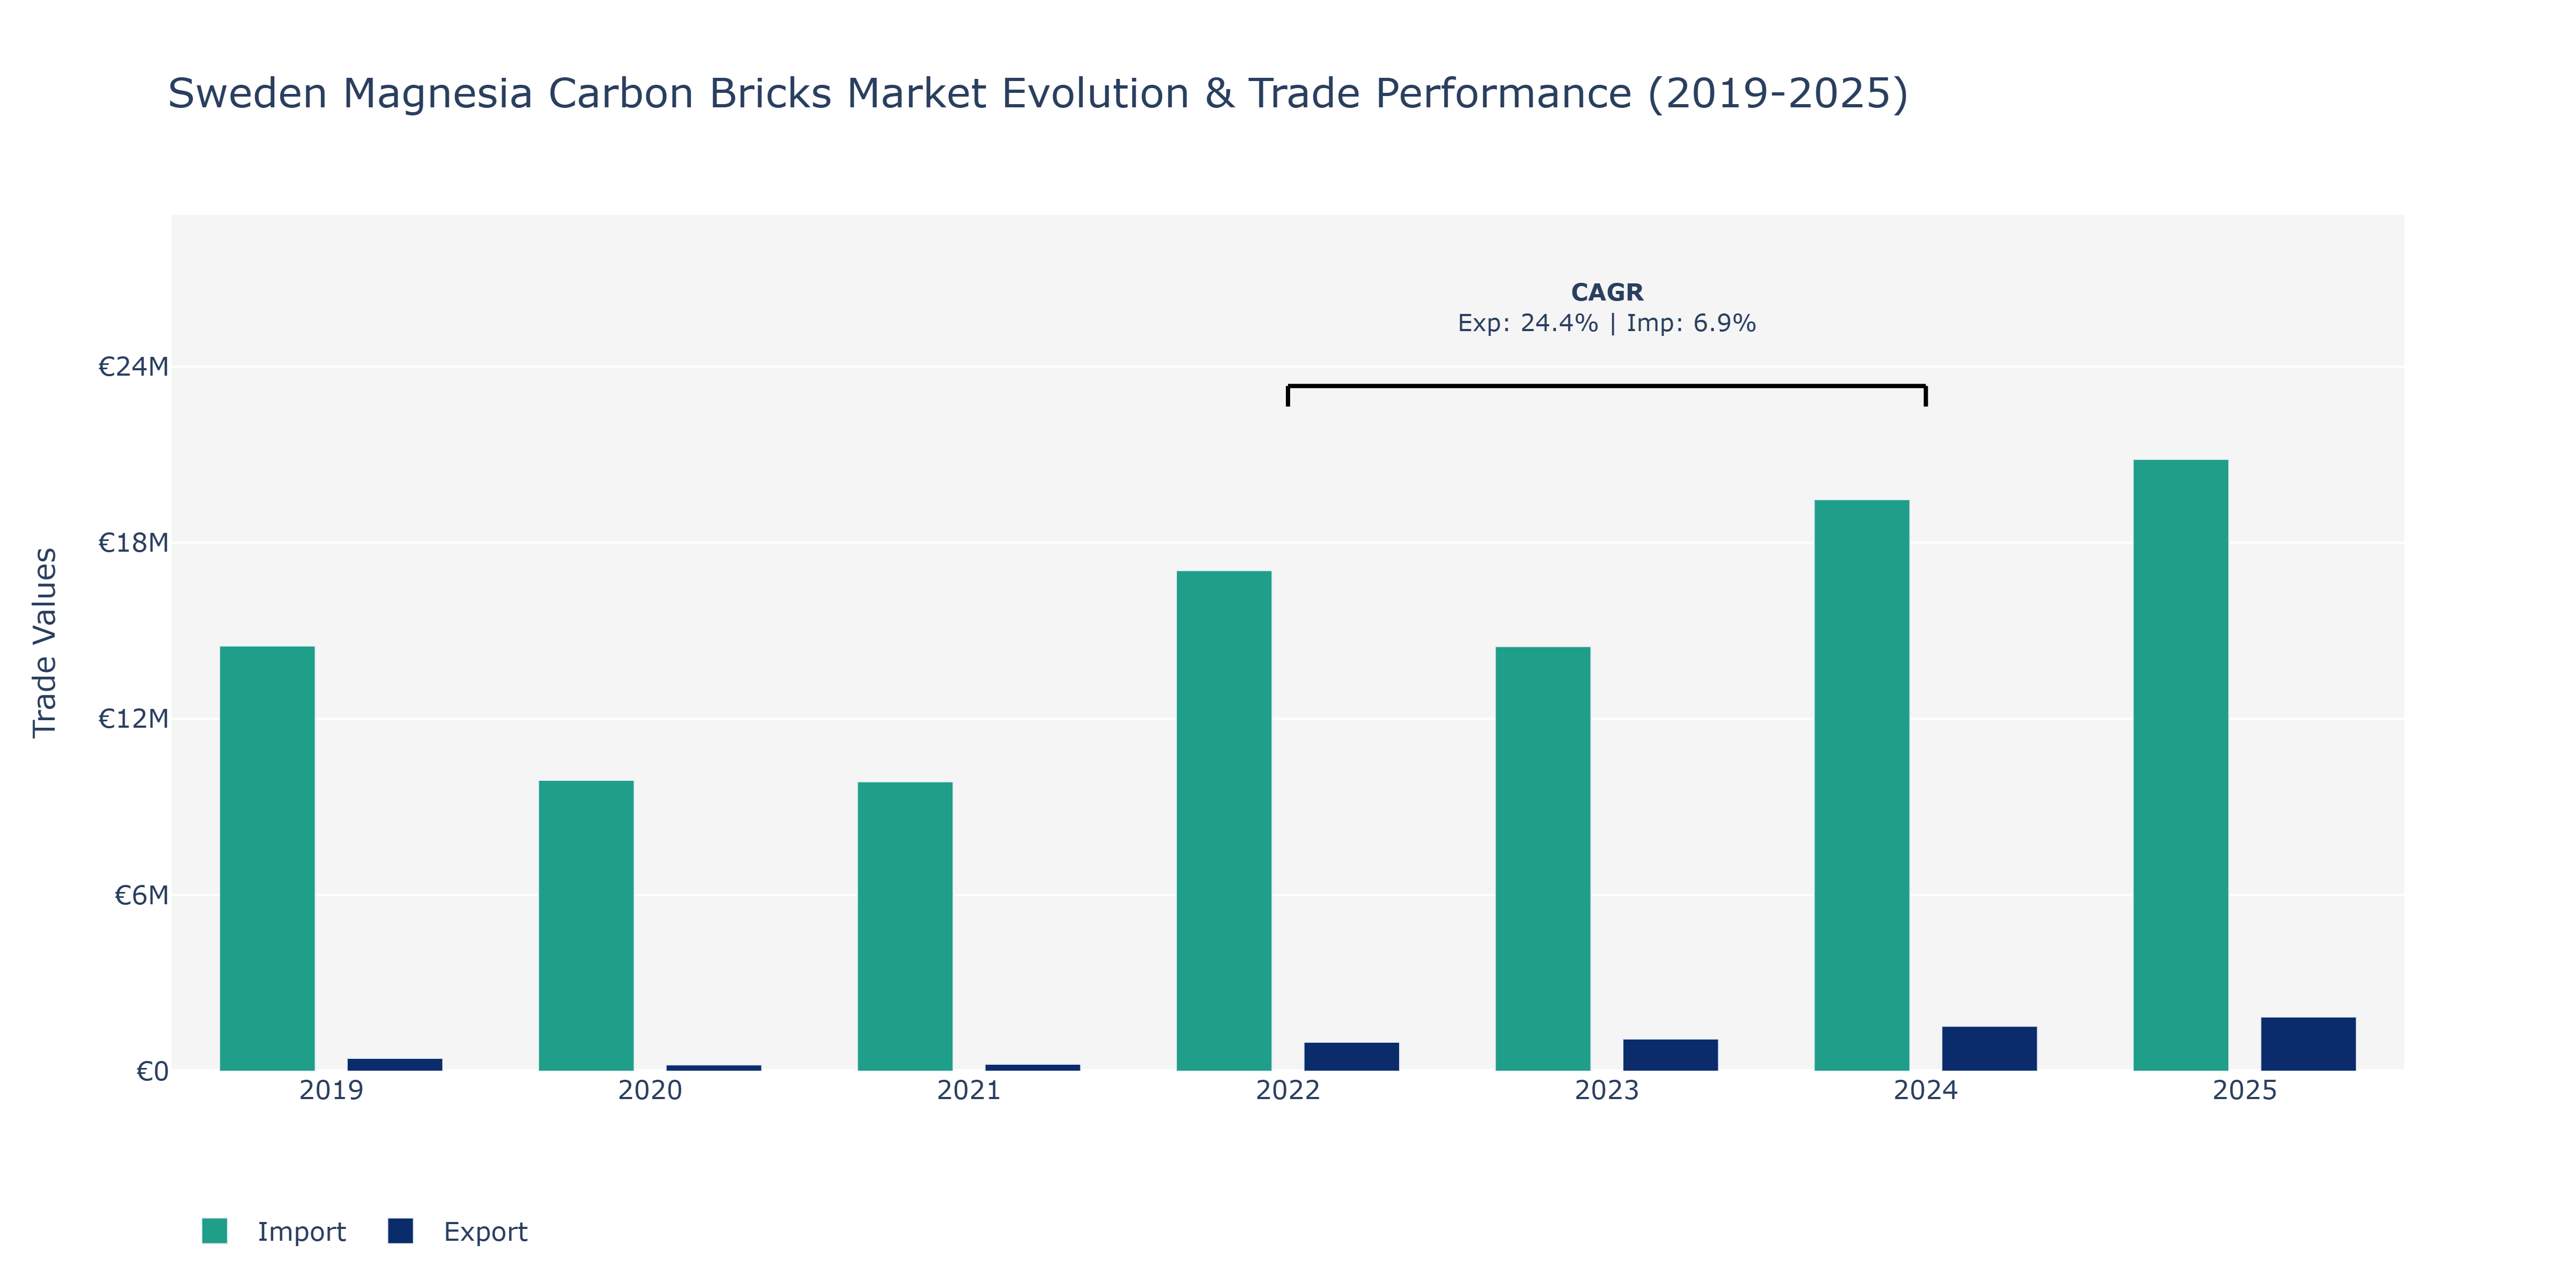
The Sweden Magnesia Carbon Bricks Market experienced notable fluctuations in both Exports and Imports from 2019 to 2025. Exports peaked in 2025 at approximately €1.84 million, showing a consistent upward trend over the years. This growth can be attributed to the increasing global demand for magnesia carbon bricks in industries such as steel production, where these bricks are used due to their high thermal resistance. On the other hand, Imports also demonstrated growth, reaching around €20.84 million in 2025. The spike in Imports from 2022 to 2024 aligns with the CAGR of 6.86% during that period, indicating a steady rise in the inflow of these products into the Swedish market. This surge can be linked to the country's expanding industrial sector, requiring a higher volume of raw materials for construction and infrastructure projects. The consistent growth in both Exports and Imports showcases the market's resilience and its ability to adapt to changing demands and supply chain dynamics.
Key Highlights of the Report:
- Sweden Magnesia Carbon Bricks Market Outlook
- Market Size of Sweden Magnesia Carbon Bricks Market, 2025
- Forecast of Sweden Magnesia Carbon Bricks Market, 2032
- Historical Data and Forecast of Sweden Magnesia Carbon Bricks Revenues & Volume for the Period 2022 - 2032F
- Sweden Magnesia Carbon Bricks Market Trend Evolution
- Sweden Magnesia Carbon Bricks Market Drivers and Challenges
- Sweden Magnesia Carbon Bricks Price Trends
- Sweden Magnesia Carbon Bricks Porter's Five Forces
- Sweden Magnesia Carbon Bricks Industry Life Cycle
- Historical Data and Forecast of Sweden Magnesia Carbon Bricks Market Revenues & Volume By Type for the Period 2022 - 2032F
- Historical Data and Forecast of Sweden Magnesia Carbon Bricks Market Revenues & Volume By High-Carbon for the Period 2022 - 2032F
- Historical Data and Forecast of Sweden Magnesia Carbon Bricks Market Revenues & Volume By Low-Carbon for the Period 2022 - 2032F
- Historical Data and Forecast of Sweden Magnesia Carbon Bricks Market Revenues & Volume By Ultra-Low Carbon for the Period 2022 - 2032F
- Historical Data and Forecast of Sweden Magnesia Carbon Bricks Market Revenues & Volume By Application for the Period 2022 - 2032F
- Historical Data and Forecast of Sweden Magnesia Carbon Bricks Market Revenues & Volume By Steelmaking for the Period 2022 - 2032F
- Historical Data and Forecast of Sweden Magnesia Carbon Bricks Market Revenues & Volume By Electric Arc Furnace for the Period 2022 - 2032F
- Historical Data and Forecast of Sweden Magnesia Carbon Bricks Market Revenues & Volume By Ladle Furnaces for the Period 2022 - 2032F
- Historical Data and Forecast of Sweden Magnesia Carbon Bricks Market Revenues & Volume By End User for the Period 2022 - 2032F
- Historical Data and Forecast of Sweden Magnesia Carbon Bricks Market Revenues & Volume By Steel Industry for the Period 2022 - 2032F
- Historical Data and Forecast of Sweden Magnesia Carbon Bricks Market Revenues & Volume By Foundries for the Period 2022 - 2032F
- Historical Data and Forecast of Sweden Magnesia Carbon Bricks Market Revenues & Volume By Non-Ferrous Metal Industry for the Period 2022 - 2032F
- Historical Data and Forecast of Sweden Magnesia Carbon Bricks Market Revenues & Volume By Sales Channel for the Period 2022 - 2032F
- Historical Data and Forecast of Sweden Magnesia Carbon Bricks Market Revenues & Volume By Direct Sales for the Period 2022 - 2032F
- Historical Data and Forecast of Sweden Magnesia Carbon Bricks Market Revenues & Volume By Distributors for the Period 2022 - 2032F
- Historical Data and Forecast of Sweden Magnesia Carbon Bricks Market Revenues & Volume By Online for the Period 2022 - 2032F
- Sweden Magnesia Carbon Bricks Import Export Trade Statistics
- Market Opportunity Assessment By Type
- Market Opportunity Assessment By Application
- Market Opportunity Assessment By End User
- Market Opportunity Assessment By Sales Channel
- Sweden Magnesia Carbon Bricks Top Companies Market Share
- Sweden Magnesia Carbon Bricks Competitive Benchmarking By Technical and Operational Parameters
- Sweden Magnesia Carbon Bricks Company Profiles
- Sweden Magnesia Carbon Bricks Key Strategic Recommendations
Frequently Asked Questions About the Market Study (FAQs):
6Wresearch actively monitors the Sweden Magnesia Carbon Bricks Market and publishes its comprehensive annual report, highlighting emerging trends, growth drivers, revenue analysis, and forecast outlook. Our insights help businesses to make data-backed strategic decisions with ongoing market dynamics. Our analysts track relevent industries related to the Sweden Magnesia Carbon Bricks Market, allowing our clients with actionable intelligence and reliable forecasts tailored to emerging regional needs.
Yes, we provide customisation as per your requirements. To learn more, feel free to contact us on sales@6wresearch.com
1 Executive Summary |
2 Introduction |
2.1 Key Highlights of the Report |
2.2 Report Description |
2.3 Market Scope & Segmentation |
2.4 Research Methodology |
2.5 Assumptions |
3 Sweden Magnesia Carbon Bricks Market Overview |
3.1 Sweden Country Macro Economic Indicators |
3.2 Sweden Magnesia Carbon Bricks Market Revenues & Volume, 2022 & 2032F |
3.3 Sweden Magnesia Carbon Bricks Market - Industry Life Cycle |
3.4 Sweden Magnesia Carbon Bricks Market - Porter's Five Forces |
3.5 Sweden Magnesia Carbon Bricks Market Revenues & Volume Share, By Type, 2022 & 2032F |
3.6 Sweden Magnesia Carbon Bricks Market Revenues & Volume Share, By Application, 2022 & 2032F |
3.7 Sweden Magnesia Carbon Bricks Market Revenues & Volume Share, By End User, 2022 & 2032F |
3.8 Sweden Magnesia Carbon Bricks Market Revenues & Volume Share, By Sales Channel, 2022 & 2032F |
4 Sweden Magnesia Carbon Bricks Market Dynamics |
4.1 Impact Analysis |
4.2 Market Drivers |
4.2.1 Increasing demand for magnesia carbon bricks in the steel industry due to their high thermal shock resistance and corrosion resistance properties. |
4.2.2 Growing focus on sustainable and energy-efficient manufacturing processes, leading to the adoption of magnesia carbon bricks. |
4.2.3 Technological advancements in the production of magnesia carbon bricks, leading to improved quality and performance. |
4.3 Market Restraints |
4.3.1 Fluctuations in raw material prices, such as magnesia and graphite, impacting the overall production cost of magnesia carbon bricks. |
4.3.2 Environmental regulations and concerns regarding the carbon footprint of manufacturing magnesia carbon bricks. |
4.3.3 Competition from alternative refractory materials, such as alumina carbon bricks or silicon carbide bricks, affecting market penetration. |
5 Sweden Magnesia Carbon Bricks Market Trends |
6 Sweden Magnesia Carbon Bricks Market, By Types |
6.1 Sweden Magnesia Carbon Bricks Market, By Type |
6.1.1 Overview and Analysis |
6.1.2 Sweden Magnesia Carbon Bricks Market Revenues & Volume, By Type, 2022 - 2032F |
6.1.3 Sweden Magnesia Carbon Bricks Market Revenues & Volume, By High-Carbon, 2022 - 2032F |
6.1.4 Sweden Magnesia Carbon Bricks Market Revenues & Volume, By Low-Carbon, 2022 - 2032F |
6.1.5 Sweden Magnesia Carbon Bricks Market Revenues & Volume, By Ultra-Low Carbon, 2022 - 2032F |
6.2 Sweden Magnesia Carbon Bricks Market, By Application |
6.2.1 Overview and Analysis |
6.2.2 Sweden Magnesia Carbon Bricks Market Revenues & Volume, By Steelmaking, 2022 - 2032F |
6.2.3 Sweden Magnesia Carbon Bricks Market Revenues & Volume, By Electric Arc Furnace, 2022 - 2032F |
6.2.4 Sweden Magnesia Carbon Bricks Market Revenues & Volume, By Ladle Furnaces, 2022 - 2032F |
6.3 Sweden Magnesia Carbon Bricks Market, By End User |
6.3.1 Overview and Analysis |
6.3.2 Sweden Magnesia Carbon Bricks Market Revenues & Volume, By Steel Industry, 2022 - 2032F |
6.3.3 Sweden Magnesia Carbon Bricks Market Revenues & Volume, By Foundries, 2022 - 2032F |
6.3.4 Sweden Magnesia Carbon Bricks Market Revenues & Volume, By Non-Ferrous Metal Industry, 2022 - 2032F |
6.4 Sweden Magnesia Carbon Bricks Market, By Sales Channel |
6.4.1 Overview and Analysis |
6.4.2 Sweden Magnesia Carbon Bricks Market Revenues & Volume, By Direct Sales, 2022 - 2032F |
6.4.3 Sweden Magnesia Carbon Bricks Market Revenues & Volume, By Distributors, 2022 - 2032F |
6.4.4 Sweden Magnesia Carbon Bricks Market Revenues & Volume, By Online, 2022 - 2032F |
7 Sweden Magnesia Carbon Bricks Market Import-Export Trade Statistics |
7.1 Sweden Magnesia Carbon Bricks Market Export to Major Countries |
7.2 Sweden Magnesia Carbon Bricks Market Imports from Major Countries |
8 Sweden Magnesia Carbon Bricks Market Key Performance Indicators |
8.1 Energy efficiency improvements in the steel industry, indirectly indicating potential growth in demand for magnesia carbon bricks. |
8.2 Research and development investments in new manufacturing processes for magnesia carbon bricks, reflecting innovation and potential market expansion. |
8.3 Adoption rate of magnesia carbon bricks in emerging industries or applications, indicating diversification and market growth opportunities. |
9 Sweden Magnesia Carbon Bricks Market - Opportunity Assessment |
9.1 Sweden Magnesia Carbon Bricks Market Opportunity Assessment, By Type, 2022 & 2032F |
9.2 Sweden Magnesia Carbon Bricks Market Opportunity Assessment, By Application, 2022 & 2032F |
9.3 Sweden Magnesia Carbon Bricks Market Opportunity Assessment, By End User, 2022 & 2032F |
9.4 Sweden Magnesia Carbon Bricks Market Opportunity Assessment, By Sales Channel, 2022 & 2032F |
10 Sweden Magnesia Carbon Bricks Market - Competitive Landscape |
10.1 Sweden Magnesia Carbon Bricks Market Revenue Share, By Companies, 2025 |
10.2 Sweden Magnesia Carbon Bricks Market Competitive Benchmarking, By Operating and Technical Parameters |
11 Company Profiles |
12 Recommendations |
13 Disclaimer |
Export potential assessment - trade Analytics for 2030
Export potential enables firms to identify high-growth global markets with greater confidence by combining advanced trade intelligence with a structured quantitative methodology. The framework analyzes emerging demand trends and country-level import patterns while integrating macroeconomic and trade datasets such as GDP and population forecasts, bilateral import–export flows, tariff structures, elasticity differentials between developed and developing economies, geographic distance, and import demand projections. Using weighted trade values from 2020–2024 as the base period to project country-to-country export potential for 2030, these inputs are operationalized through calculated drivers such as gravity model parameters, tariff impact factors, and projected GDP per-capita growth. Through an analysis of hidden potentials, demand hotspots, and market conditions that are most favorable to success, this method enables firms to focus on target countries, maximize returns, and global expansion with data, backed by accuracy.
By factoring in the projected importer demand gap that is currently unmet and could be potential opportunity, it identifies the potential for the Exporter (Country) among 190 countries, against the general trade analysis, which identifies the biggest importer or exporter.
To discover high-growth global markets and optimize your business strategy:
Click Here
Pricing
- Single User License$ 1,995
- Department License$ 2,400
- Site License$ 3,120
- Global License$ 3,795

Search
Thought Leadership and Analyst Meet


Our Clients
Latest Reports
- Canada Cloud CFD Market (2026-2032) | Size & Revenue, Industry, Growth, Competitive Landscape, Forecast, Segmentation, Value, Outlook, Trends, Share, Analysis, Companies
- Taiwan Food Delivery Platform Market (2026-2032) | Companies, Outlook, Analysis, Trends, Value, Revenue, Segmentation, Share, Forecast, Competitive Landscape, Growth, Size & Forecast
- United Kingdom (UK) Long-term Care Insurance Market (2026-2032) | Growth, Share, Consumer Insights, Drivers, Opportunities, Competition, Pricing Analysis, Segments, Restraints, Companies, Competitive, Value, Outlook, Size, Demand, Analysis, Challenges, Strategic Insights, Investment Trends, Revenue, Trends, Supply, Forecast
- United Kingdom (UK) Long Term Care Market (2026-2032) | Companies, Outlook, Analysis, Trends, Value, Revenue, Segmentation, Share, Forecast, Competitive Landscape, Growth, Size & Forecast
- Iraq Insulation and Waterproofing Market (2026-2032) | Outlook, Drivers, Growth, Size, Share, Industry, Revenue, Trends, Demand, Competitive, Strategic Insights, Opportunities, Segments, Companies, Challenges, Strategy, Consumer Insights, Analysis, Investment Trends, Value, Segmentation, Forecast, Restraints
- India Switchgear Market Outlook (2026-2032) | Size, Share, Trends, Growth, Revenue, Forecast, Analysis, Value, Outlook
- Pakistan Contraceptive Implants Market (2025-2031) | Demand, Growth, Size, Share, Industry, Pricing Analysis, Competitive, Strategic Insights, Strategy, Consumer Insights, Analysis, Investment Trends, Opportunities, Revenue, Segments, Value, Segmentation, Supply, Forecast, Restraints, Outlook, Competition, Drivers, Trends, Companies, Challenges
- Sri Lanka Packaging Market (2026-2032) | Outlook, Competition, Drivers, Trends, Demand, Pricing Analysis, Competitive, Strategic Insights, Companies, Challenges, Strategy, Consumer Insights, Analysis, Investment Trends, Opportunities, Growth, Size, Share, Industry, Revenue, Segments, Value, Segmentation, Supply, Forecast, Restraints
- India Kids Watches Market (2026-2032) | Strategy, Consumer Insights, Analysis, Investment Trends, Opportunities, Growth, Size, Share, Industry, Revenue, Segments, Value, Segmentation, Supply, Forecast, Restraints, Outlook, Competition, Drivers, Trends, Demand, Pricing Analysis, Competitive, Strategic Insights, Companies, Challenges
- Saudi Arabia Core Assurance Service Market (2025-2031) | Strategy, Consumer Insights, Analysis, Investment Trends, Opportunities, Growth, Size, Share, Industry, Revenue, Segments, Value, Segmentation, Supply, Forecast, Restraints, Outlook, Competition, Drivers, Trends, Demand, Pricing Analysis, Competitive, Strategic Insights, Companies, Challenges
Industry Events and Analyst Meet

India EV Show 2026

EV tech India Expo 2026

Auto Tech Asia 2026

Battery Tech India 2026

Smart Production Solutions Guangzhou 2026
Whitepaper
- Middle East & Africa Commercial Security Market Click here to view more.
- Middle East & Africa Fire Safety Systems & Equipment Market Click here to view more.
- GCC Drone Market Click here to view more.
- Middle East Lighting Fixture Market Click here to view more.
- GCC Physical & Perimeter Security Market Click here to view more.
6WResearch In News
- Doha a strategic location for EV manufacturing hub: IPA Qatar
- Demand for luxury TVs surging in the GCC, says Samsung
- Empowering Growth: The Thriving Journey of Bangladesh’s Cable Industry
- Demand for luxury TVs surging in the GCC, says Samsung
- Video call with a traditional healer? Once unthinkable, it’s now common in South Africa
- Intelligent Buildings To Smooth GCC’s Path To Net Zero