Sweden Mica Market (2026-2032) | Companies, Value, Size, Forecast, Trends, Revenue, Industry, Outlook, Segmentation, Analysis, Share & Growth
Market Forecast By Type (Natural, Synthetic), By Grade (Ground Mica, Sheet Mica, Built-Up Mica), By End-user (Paints & Coatings, Electronics, Construction, Cosmetics, Others) And Competitive Landscape
| Product Code: ETC4815506 | Publication Date: Nov 2023 | Updated Date: Apr 2026 | Product Type: Market Research Report | |
| Publisher: 6Wresearch | Author: Sachin Kumar Rai | No. of Pages: 60 | No. of Figures: 30 | No. of Tables: 5 |
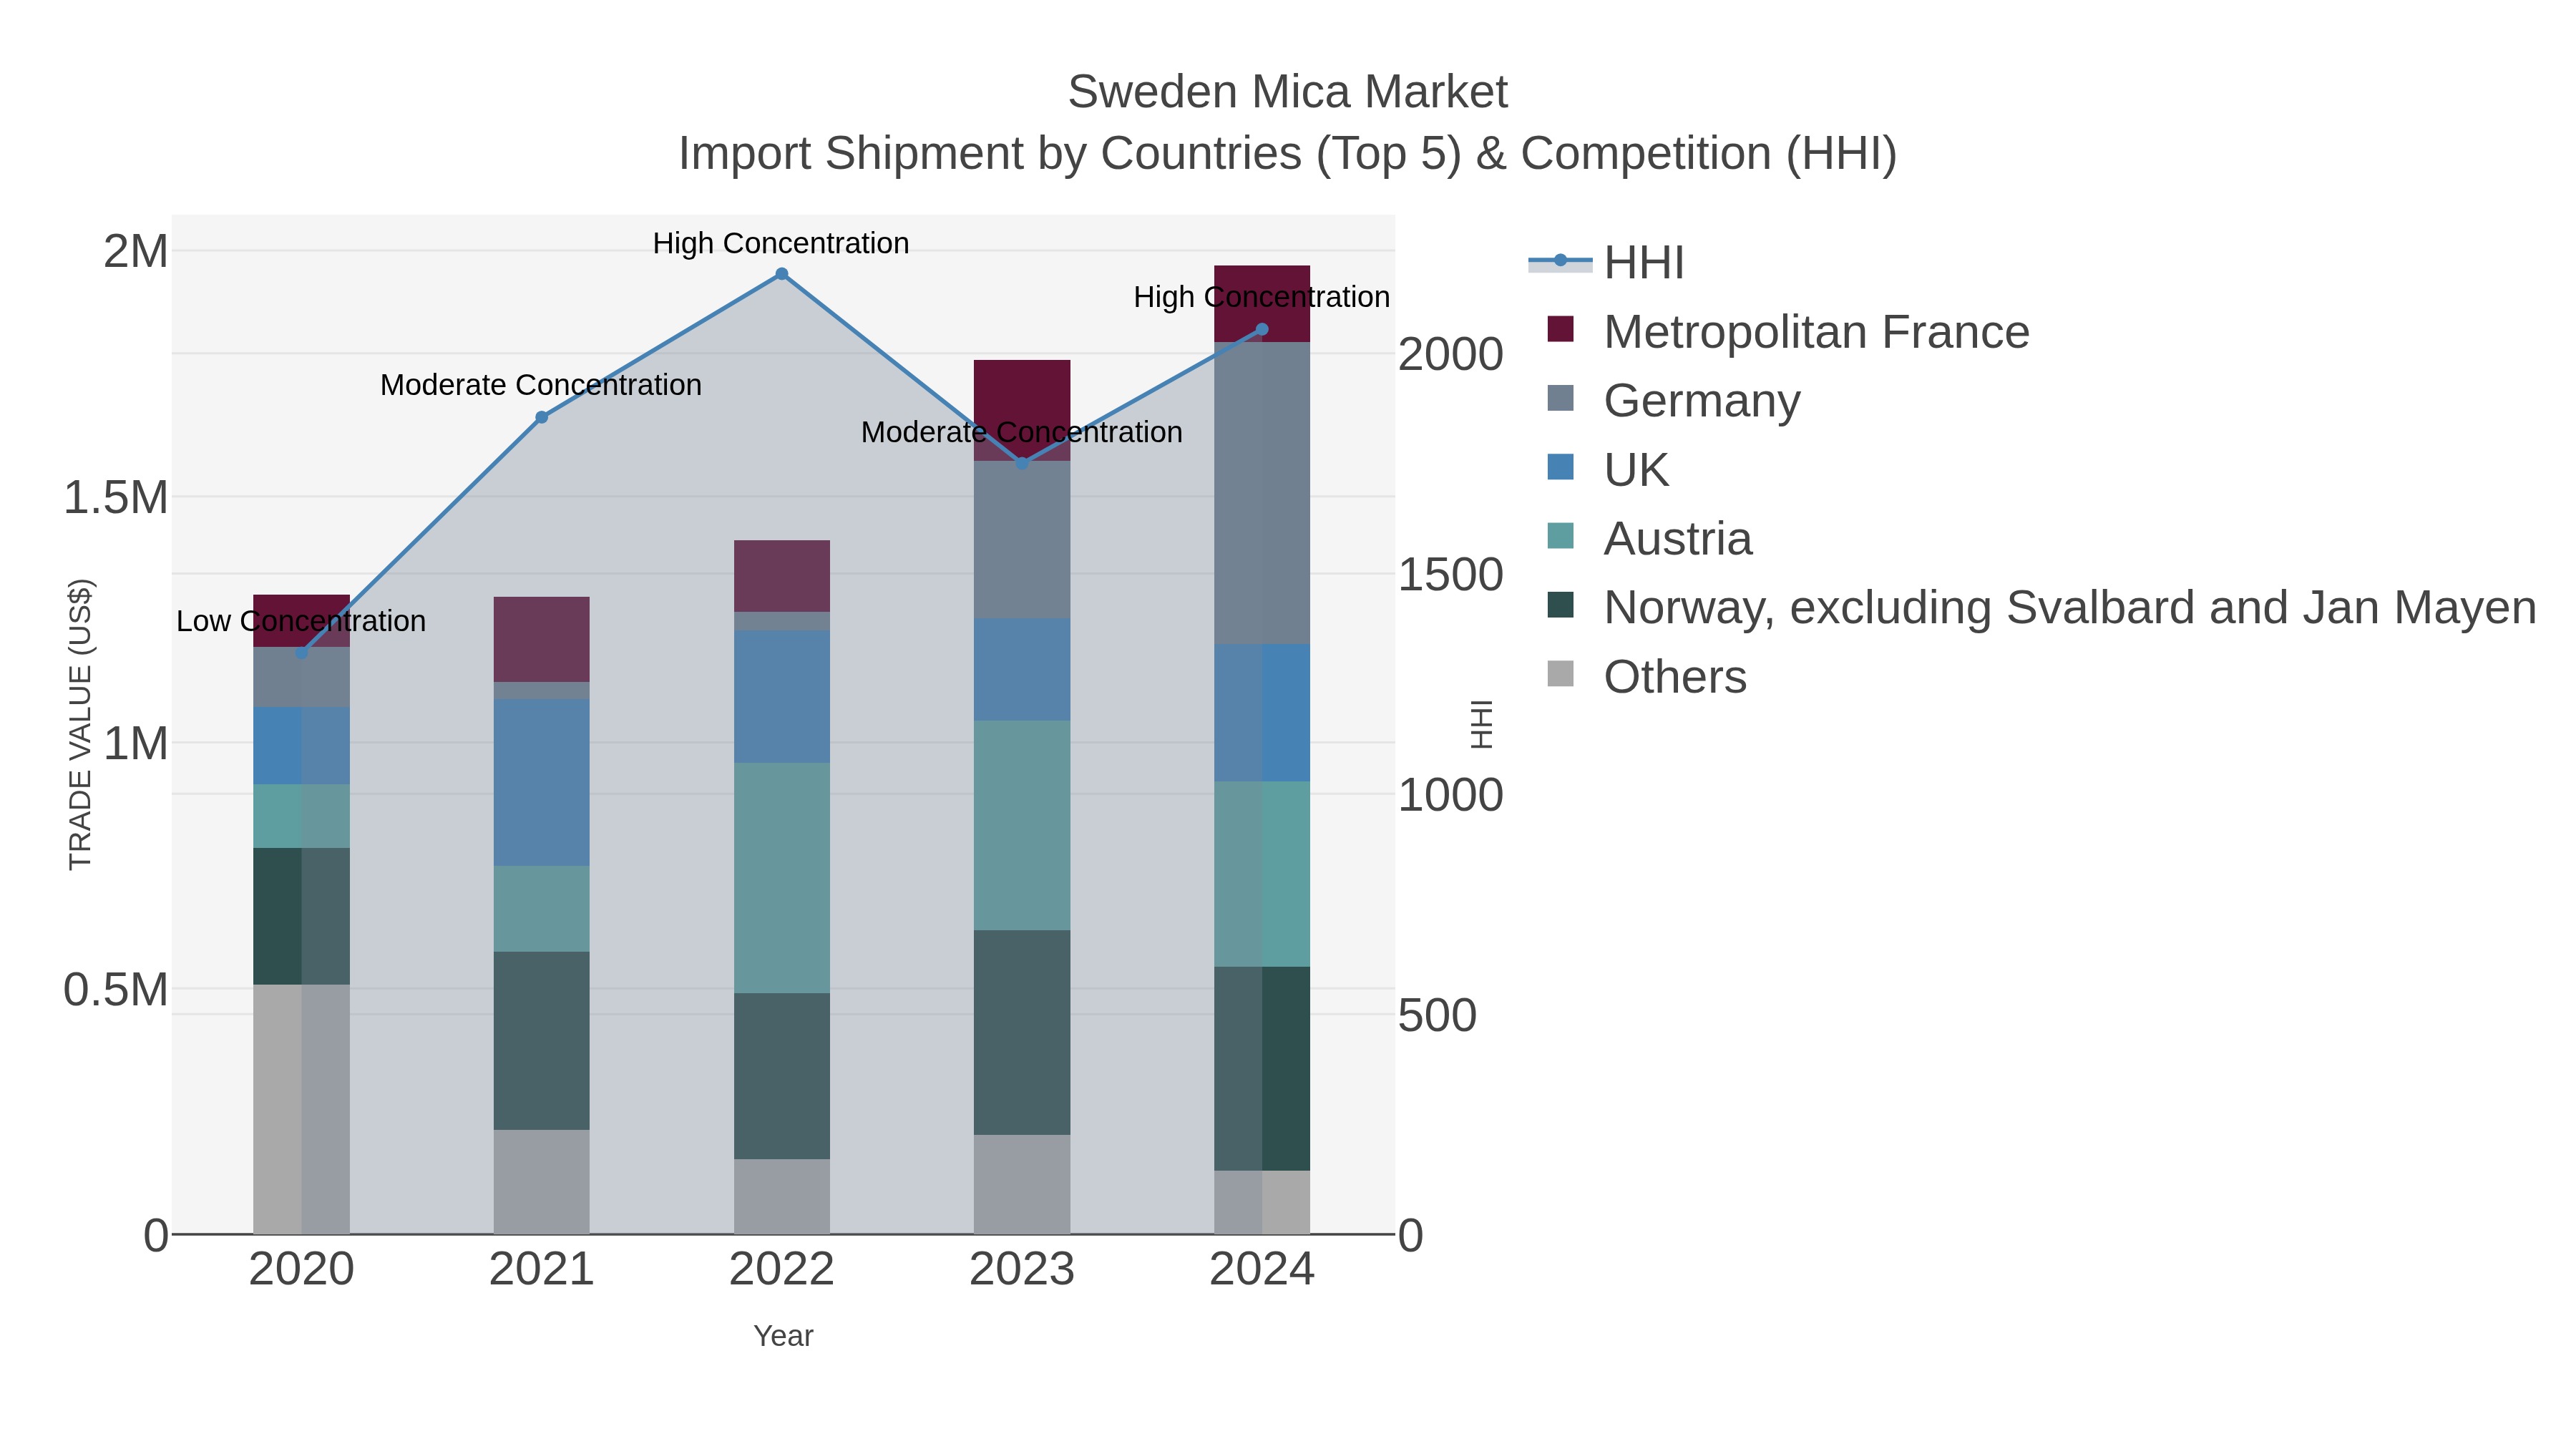
Sweden Mica Market Top 5 Importing Countries and Market Competition (HHI) Analysis
In 2024, Sweden saw a significant increase in mica imports, with top exporters being Germany, Norway, Austria, UK, and Metropolitan France. The Herfindahl-Hirschman Index (HHI) indicating market concentration shifted from moderate to high, reflecting a more consolidated market landscape. The Compound Annual Growth Rate (CAGR) for mica imports from 2020 to 2024 was strong at 10.94%, with a notable growth spurt of 10.76% from 2023 to 2024. This data suggests a growing reliance on these key exporting countries for mica supply in Sweden.
Sweden Mica Market Overview
Sweden mica market is characterized by its use in cosmetics, paints, and electronic applications. The natural mineral is valued for its unique properties, including transparency, luster, and resistance to heat. The market is witnessing a trend toward sustainable sourcing and transparency in supply chains, responding to consumer demand for ethically sourced products.
Drivers of the market
The mica market in Sweden is experiencing growth due to the increasing demand for high-performance materials in various applications, including cosmetics, electronics, and construction. The rise in industrial activities and the focus on product quality are propelling market growth, as companies seek innovative mica solutions to enhance their products. Additionally, the growing emphasis on sustainability and the use of natural materials influence market dynamics, as businesses require advanced mica that meets eco-friendly standards. The advancement of extraction and processing technologies further supports the demand for mica.
Challenges of the market
The mica market in Sweden faces challenges associated with fluctuating supply and demand dynamics and competition from synthetic alternatives. As industries increasingly rely on mica for various applications, ensuring a stable supply of quality material becomes critical. Additionally, competition from synthetic alternatives complicates the market landscape, necessitating effective differentiation in product offerings. The need for ongoing investment in sustainable mining practices further complicates the landscape.
Government Policy of the market
The mica market in Sweden is shaped by government policies that emphasize sustainability and ethical sourcing in mineral production. The government promotes regulations governing the mining and processing of mica, ensuring compliance with environmental and labor standards. Initiatives aimed at fostering responsible sourcing and promoting transparency in the supply chain contribute to the growth of this market, aligning with Sweden commitment to ethical business practices.
Key Highlights of the Report:
- Sweden Mica Market Outlook
- Market Size of Sweden Mica Market, 2025
- Forecast of Sweden Mica Market, 2032
- Historical Data and Forecast of Sweden Mica Revenues & Volume for the Period 2022 - 2032
- Sweden Mica Market Trend Evolution
- Sweden Mica Market Drivers and Challenges
- Sweden Mica Price Trends
- Sweden Mica Porter`s Five Forces
- Sweden Mica Industry Life Cycle
- Historical Data and Forecast of Sweden Mica Market Revenues & Volume By Type for the Period 2022 - 2032
- Historical Data and Forecast of Sweden Mica Market Revenues & Volume By Natural for the Period 2022 - 2032
- Historical Data and Forecast of Sweden Mica Market Revenues & Volume By Synthetic for the Period 2022 - 2032
- Historical Data and Forecast of Sweden Mica Market Revenues & Volume By Grade for the Period 2022 - 2032
- Historical Data and Forecast of Sweden Mica Market Revenues & Volume By Ground Mica for the Period 2022 - 2032
- Historical Data and Forecast of Sweden Mica Market Revenues & Volume By Sheet Mica for the Period 2022 - 2032
- Historical Data and Forecast of Sweden Mica Market Revenues & Volume By Built-Up Mica for the Period 2022 - 2032
- Historical Data and Forecast of Sweden Mica Market Revenues & Volume By End-user for the Period 2022 - 2032
- Historical Data and Forecast of Sweden Mica Market Revenues & Volume By Paints & Coatings for the Period 2022 - 2032
- Historical Data and Forecast of Sweden Mica Market Revenues & Volume By Electronics for the Period 2022 - 2032
- Historical Data and Forecast of Sweden Mica Market Revenues & Volume By Construction for the Period 2022 - 2032
- Historical Data and Forecast of Sweden Mica Market Revenues & Volume By Cosmetics for the Period 2022 - 2032
- Historical Data and Forecast of Sweden Mica Market Revenues & Volume By Others for the Period 2022 - 2032
- Sweden Mica Import Export Trade Statistics
- Market Opportunity Assessment By Type
- Market Opportunity Assessment By Grade
- Market Opportunity Assessment By End-user
- Sweden Mica Top Companies Market Share
- Sweden Mica Competitive Benchmarking By Technical and Operational Parameters
- Sweden Mica Company Profiles
- Sweden Mica Key Strategic Recommendations
Frequently Asked Questions About the Market Study (FAQs):
6Wresearch actively monitors the Sweden Mica Market and publishes its comprehensive annual report, highlighting emerging trends, growth drivers, revenue analysis, and forecast outlook. Our insights help businesses to make data-backed strategic decisions with ongoing market dynamics. Our analysts track relevent industries related to the Sweden Mica Market, allowing our clients with actionable intelligence and reliable forecasts tailored to emerging regional needs.
Yes, we provide customisation as per your requirements. To learn more, feel free to contact us on sales@6wresearch.com
1 Executive Summary |
2 Introduction |
2.1 Key Highlights of the Report |
2.2 Report Description |
2.3 Market Scope & Segmentation |
2.4 Research Methodology |
2.5 Assumptions |
3 Sweden Mica Market Overview |
3.1 Sweden Country Macro Economic Indicators |
3.2 Sweden Mica Market Revenues & Volume, 2022 & 2032F |
3.3 Sweden Mica Market - Industry Life Cycle |
3.4 Sweden Mica Market - Porter's Five Forces |
3.5 Sweden Mica Market Revenues & Volume Share, By Type, 2022 & 2032F |
3.6 Sweden Mica Market Revenues & Volume Share, By Grade, 2022 & 2032F |
3.7 Sweden Mica Market Revenues & Volume Share, By End-user, 2022 & 2032F |
4 Sweden Mica Market Dynamics |
4.1 Impact Analysis |
4.2 Market Drivers |
4.2.1 Increasing demand for cosmetics and personal care products containing mica |
4.2.2 Growing awareness about the benefits of using mica in construction materials |
4.2.3 Rise in demand for electronics and electrical equipment, where mica is used as an insulator |
4.3 Market Restraints |
4.3.1 Fluctuating prices of raw materials used in mica production |
4.3.2 Environmental concerns related to mica mining and processing |
4.3.3 Competition from alternative materials in various industries |
5 Sweden Mica Market Trends |
6 Sweden Mica Market Segmentations |
6.1 Sweden Mica Market, By Type |
6.1.1 Overview and Analysis |
6.1.2 Sweden Mica Market Revenues & Volume, By Natural, 2022-2032F |
6.1.3 Sweden Mica Market Revenues & Volume, By Synthetic, 2022-2032F |
6.2 Sweden Mica Market, By Grade |
6.2.1 Overview and Analysis |
6.2.2 Sweden Mica Market Revenues & Volume, By Ground Mica, 2022-2032F |
6.2.3 Sweden Mica Market Revenues & Volume, By Sheet Mica, 2022-2032F |
6.2.4 Sweden Mica Market Revenues & Volume, By Built-Up Mica, 2022-2032F |
6.3 Sweden Mica Market, By End-user |
6.3.1 Overview and Analysis |
6.3.2 Sweden Mica Market Revenues & Volume, By Paints & Coatings, 2022-2032F |
6.3.3 Sweden Mica Market Revenues & Volume, By Electronics, 2022-2032F |
6.3.4 Sweden Mica Market Revenues & Volume, By Construction, 2022-2032F |
6.3.5 Sweden Mica Market Revenues & Volume, By Cosmetics, 2022-2032F |
6.3.6 Sweden Mica Market Revenues & Volume, By Others, 2022-2032F |
7 Sweden Mica Market Import-Export Trade Statistics |
7.1 Sweden Mica Market Export to Major Countries |
7.2 Sweden Mica Market Imports from Major Countries |
8 Sweden Mica Market Key Performance Indicators |
8.1 Percentage of mica used in new product formulations by cosmetics and personal care companies |
8.2 Number of construction projects incorporating mica-based materials |
8.3 Adoption rate of mica substitutes in industries facing environmental pressure |
9 Sweden Mica Market - Opportunity Assessment |
9.1 Sweden Mica Market Opportunity Assessment, By Type, 2022 & 2032F |
9.2 Sweden Mica Market Opportunity Assessment, By Grade, 2022 & 2032F |
9.3 Sweden Mica Market Opportunity Assessment, By End-user, 2022 & 2032F |
10 Sweden Mica Market - Competitive Landscape |
10.1 Sweden Mica Market Revenue Share, By Companies, 2025 |
10.2 Sweden Mica Market Competitive Benchmarking, By Operating and Technical Parameters |
11 Company Profiles |
12 Recommendations | 13 Disclaimer |
Export potential assessment - trade Analytics for 2030
Export potential enables firms to identify high-growth global markets with greater confidence by combining advanced trade intelligence with a structured quantitative methodology. The framework analyzes emerging demand trends and country-level import patterns while integrating macroeconomic and trade datasets such as GDP and population forecasts, bilateral import–export flows, tariff structures, elasticity differentials between developed and developing economies, geographic distance, and import demand projections. Using weighted trade values from 2020–2024 as the base period to project country-to-country export potential for 2030, these inputs are operationalized through calculated drivers such as gravity model parameters, tariff impact factors, and projected GDP per-capita growth. Through an analysis of hidden potentials, demand hotspots, and market conditions that are most favorable to success, this method enables firms to focus on target countries, maximize returns, and global expansion with data, backed by accuracy.
By factoring in the projected importer demand gap that is currently unmet and could be potential opportunity, it identifies the potential for the Exporter (Country) among 190 countries, against the general trade analysis, which identifies the biggest importer or exporter.
To discover high-growth global markets and optimize your business strategy:
Click Here
Pricing
- Single User License$ 1,995
- Department License$ 2,400
- Site License$ 3,120
- Global License$ 3,795

Search
Thought Leadership and Analyst Meet


Our Clients
Latest Reports
- Canada Cloud CFD Market (2026-2032) | Size & Revenue, Industry, Growth, Competitive Landscape, Forecast, Segmentation, Value, Outlook, Trends, Share, Analysis, Companies
- Taiwan Food Delivery Platform Market (2026-2032) | Companies, Outlook, Analysis, Trends, Value, Revenue, Segmentation, Share, Forecast, Competitive Landscape, Growth, Size & Forecast
- United Kingdom (UK) Long-term Care Insurance Market (2026-2032) | Growth, Share, Consumer Insights, Drivers, Opportunities, Competition, Pricing Analysis, Segments, Restraints, Companies, Competitive, Value, Outlook, Size, Demand, Analysis, Challenges, Strategic Insights, Investment Trends, Revenue, Trends, Supply, Forecast
- United Kingdom (UK) Long Term Care Market (2026-2032) | Companies, Outlook, Analysis, Trends, Value, Revenue, Segmentation, Share, Forecast, Competitive Landscape, Growth, Size & Forecast
- Iraq Insulation and Waterproofing Market (2026-2032) | Outlook, Drivers, Growth, Size, Share, Industry, Revenue, Trends, Demand, Competitive, Strategic Insights, Opportunities, Segments, Companies, Challenges, Strategy, Consumer Insights, Analysis, Investment Trends, Value, Segmentation, Forecast, Restraints
- India Switchgear Market Outlook (2026-2032) | Size, Share, Trends, Growth, Revenue, Forecast, Analysis, Value, Outlook
- Pakistan Contraceptive Implants Market (2025-2031) | Demand, Growth, Size, Share, Industry, Pricing Analysis, Competitive, Strategic Insights, Strategy, Consumer Insights, Analysis, Investment Trends, Opportunities, Revenue, Segments, Value, Segmentation, Supply, Forecast, Restraints, Outlook, Competition, Drivers, Trends, Companies, Challenges
- Sri Lanka Packaging Market (2026-2032) | Outlook, Competition, Drivers, Trends, Demand, Pricing Analysis, Competitive, Strategic Insights, Companies, Challenges, Strategy, Consumer Insights, Analysis, Investment Trends, Opportunities, Growth, Size, Share, Industry, Revenue, Segments, Value, Segmentation, Supply, Forecast, Restraints
- India Kids Watches Market (2026-2032) | Strategy, Consumer Insights, Analysis, Investment Trends, Opportunities, Growth, Size, Share, Industry, Revenue, Segments, Value, Segmentation, Supply, Forecast, Restraints, Outlook, Competition, Drivers, Trends, Demand, Pricing Analysis, Competitive, Strategic Insights, Companies, Challenges
- Saudi Arabia Core Assurance Service Market (2025-2031) | Strategy, Consumer Insights, Analysis, Investment Trends, Opportunities, Growth, Size, Share, Industry, Revenue, Segments, Value, Segmentation, Supply, Forecast, Restraints, Outlook, Competition, Drivers, Trends, Demand, Pricing Analysis, Competitive, Strategic Insights, Companies, Challenges
Industry Events and Analyst Meet

India EV Show 2026

EV tech India Expo 2026

Auto Tech Asia 2026

Battery Tech India 2026

Smart Production Solutions Guangzhou 2026
Whitepaper
- Middle East & Africa Commercial Security Market Click here to view more.
- Middle East & Africa Fire Safety Systems & Equipment Market Click here to view more.
- GCC Drone Market Click here to view more.
- Middle East Lighting Fixture Market Click here to view more.
- GCC Physical & Perimeter Security Market Click here to view more.
6WResearch In News
- Doha a strategic location for EV manufacturing hub: IPA Qatar
- Demand for luxury TVs surging in the GCC, says Samsung
- Empowering Growth: The Thriving Journey of Bangladesh’s Cable Industry
- Demand for luxury TVs surging in the GCC, says Samsung
- Video call with a traditional healer? Once unthinkable, it’s now common in South Africa
- Intelligent Buildings To Smooth GCC’s Path To Net Zero