Sweden Polyurethane (PU) Microspheres Market (2026-2032) | Analysis, Trends, Growth, Value, Segmentation, Outlook, Revenue, Forecast, Size, Share, Industry & Companies
Market Forecast By Applications (Encapsulation, Paints & coatings, Adhesives films, Cosmetics, Other applications) And Competitive Landscape
| Product Code: ETC5738108 | Publication Date: Nov 2023 | Updated Date: Apr 2026 | Product Type: Market Research Report | |
| Publisher: 6Wresearch | Author: Sumit Sagar | No. of Pages: 60 | No. of Figures: 30 | No. of Tables: 5 |
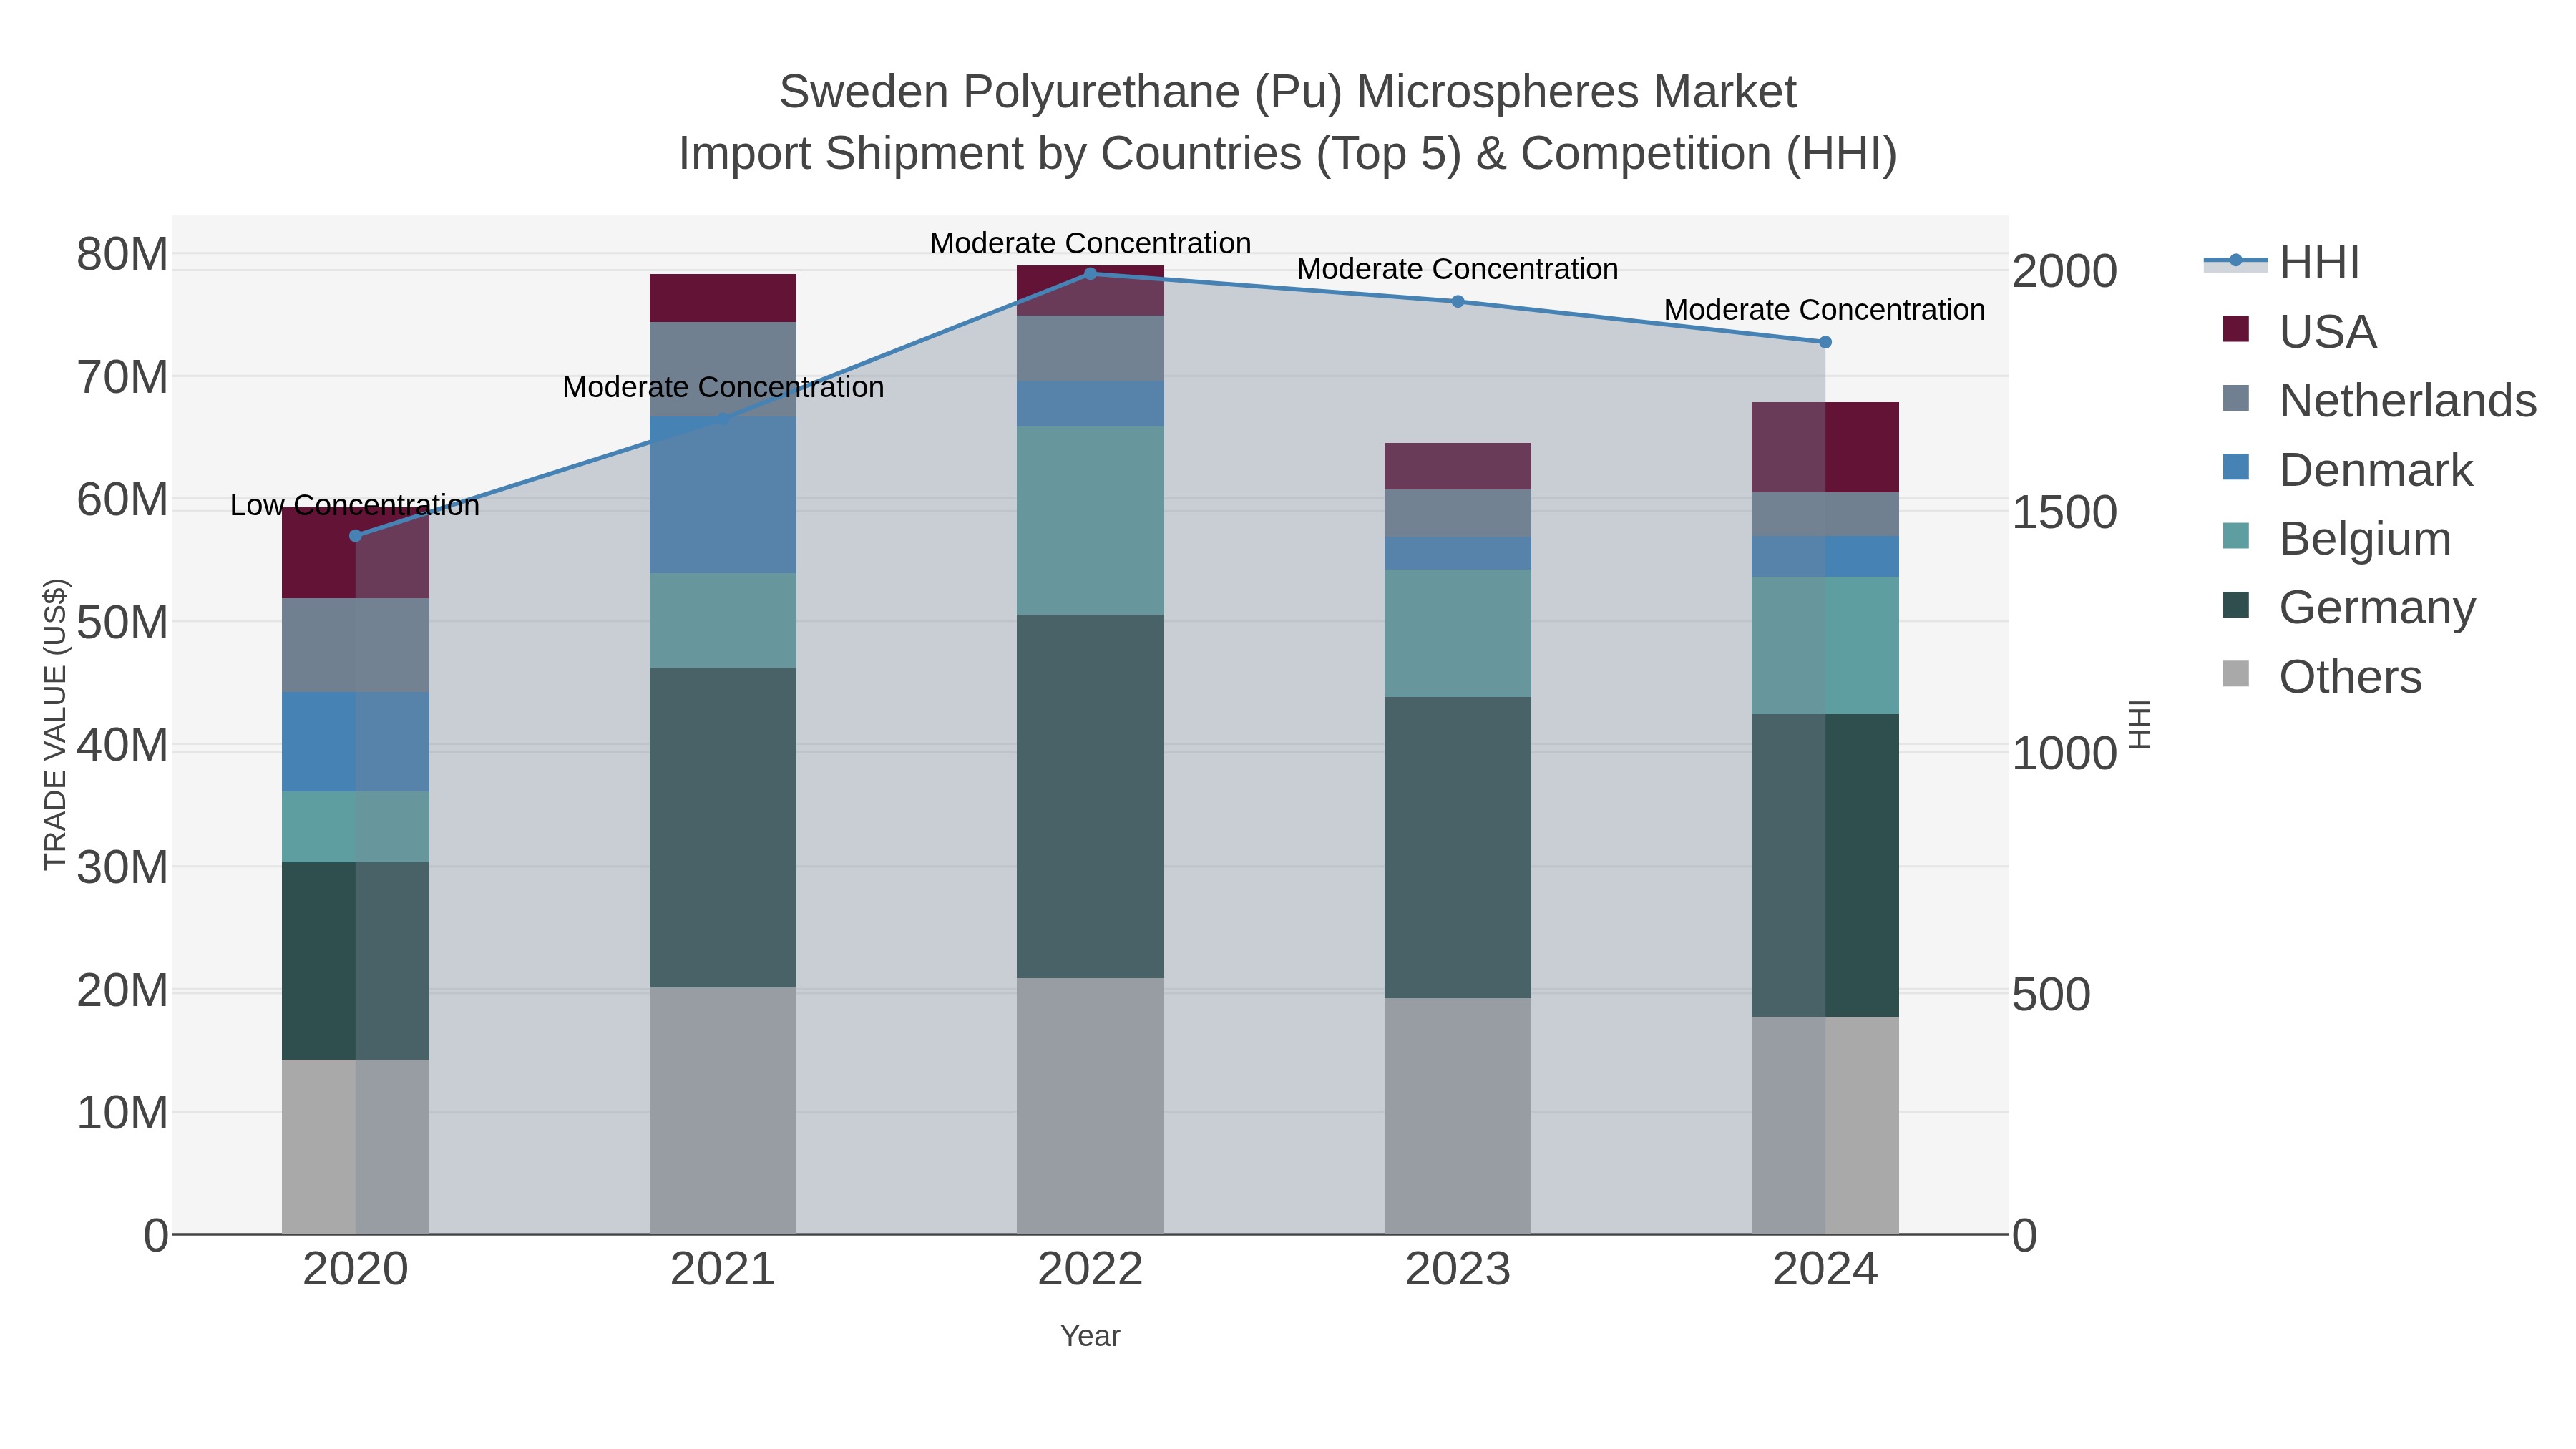
Sweden Polyurethane Pu Microspheres Market Top 5 Importing Countries and Market Competition (HHI) Analysis
Sweden continues to see a steady increase in polyurethane microspheres import shipments, with key exporting countries such as Germany, Belgium, and the USA leading the way in 2024. The market remains moderately concentrated, as indicated by the Herfindahl-Hirschman Index (HHI). With a compound annual growth rate (CAGR) of 3.43% from 2020 to 2024 and a growth rate of 5.15% from 2023 to 2024, the Swedish market for PU microspheres is showing promising growth prospects and attracting diverse sources of supply from around the globe.
Sweden Polyurethane (PU) Microspheres Market Overview
The polyurethane (PU) microspheres market in Sweden is witnessing growth driven by their applications in coatings, adhesives, and cosmetics. PU microspheres are valued for their lightweight properties, excellent stability, and versatility. The ongoing focus on sustainability and the demand for innovative formulations are influencing market dynamics, encouraging manufacturers to explore new applications.
Drivers of the market
The polyurethane microspheres market in Sweden is driven by the rising demand for innovative materials in cosmetics, pharmaceuticals, and coatings. As industries seek to enhance product performance and aesthetics, polyurethane microspheres offer unique properties such as controlled release and encapsulation. The increasing focus on sustainability influences market dynamics, encouraging manufacturers to explore eco-friendly and bio-based microsphere solutions to meet consumer expectations for greener products.
Challenges of the market
The Polyurethane (PU) Microspheres market faces challenges related to production scalability and market awareness. While PU microspheres offer unique properties, such as lightweight and customizable applications, scaling up production to meet growing demand can be complex and resource-intensive. Manufacturers must navigate the intricacies of optimizing production processes to ensure consistent quality while minimizing costs. Moreover, the market is still developing awareness regarding the benefits and applications of PU microspheres, which can limit adoption across various industries. This necessitates significant efforts in education and marketing to inform potential customers about the advantages of these materials. Additionally, as sustainability becomes a critical focus for many industries, manufacturers face pressure to adopt greener production practices and develop environmentally friendly alternatives to traditional PU microspheres, adding complexity to their operations and product offerings.
Government Policy of the market
Sweden policies regarding polyurethane microspheres reflect a strong emphasis on sustainability and innovation. The government supports research into biodegradable and environmentally friendly microspheres. Incentives for companies that develop green technologies are prevalent, promoting the use of polyurethane microspheres in various applications, including cosmetics and pharmaceuticals.
Key Highlights of the Report:
- Sweden Polyurethane (PU) Microspheres Market Outlook
- Market Size of Sweden Polyurethane (PU) Microspheres Market, 2025
- Forecast of Sweden Polyurethane (PU) Microspheres Market, 2032
- Historical Data and Forecast of Sweden Polyurethane (PU) Microspheres Revenues & Volume for the Period 2022 - 2032
- Sweden Polyurethane (PU) Microspheres Market Trend Evolution
- Sweden Polyurethane (PU) Microspheres Market Drivers and Challenges
- Sweden Polyurethane (PU) Microspheres Price Trends
- Sweden Polyurethane (PU) Microspheres Porter`s Five Forces
- Sweden Polyurethane (PU) Microspheres Industry Life Cycle
- Historical Data and Forecast of Sweden Polyurethane (PU) Microspheres Market Revenues & Volume By Applications for the Period 2022 - 2032
- Historical Data and Forecast of Sweden Polyurethane (PU) Microspheres Market Revenues & Volume By Encapsulation for the Period 2022 - 2032
- Historical Data and Forecast of Sweden Polyurethane (PU) Microspheres Market Revenues & Volume By Paints & coatings for the Period 2022 - 2032
- Historical Data and Forecast of Sweden Polyurethane (PU) Microspheres Market Revenues & Volume By Adhesives films for the Period 2022 - 2032
- Historical Data and Forecast of Sweden Polyurethane (PU) Microspheres Market Revenues & Volume By Cosmetics for the Period 2022 - 2032
- Historical Data and Forecast of Sweden Polyurethane (PU) Microspheres Market Revenues & Volume By Other applications for the Period 2022 - 2032
- Sweden Polyurethane (PU) Microspheres Import Export Trade Statistics
- Market Opportunity Assessment By Applications
- Sweden Polyurethane (PU) Microspheres Top Companies Market Share
- Sweden Polyurethane (PU) Microspheres Competitive Benchmarking By Technical and Operational Parameters
- Sweden Polyurethane (PU) Microspheres Company Profiles
- Sweden Polyurethane (PU) Microspheres Key Strategic Recommendations
Frequently Asked Questions About the Market Study (FAQs):
6Wresearch actively monitors the Sweden Polyurethane (PU) Microspheres Market and publishes its comprehensive annual report, highlighting emerging trends, growth drivers, revenue analysis, and forecast outlook. Our insights help businesses to make data-backed strategic decisions with ongoing market dynamics. Our analysts track relevent industries related to the Sweden Polyurethane (PU) Microspheres Market, allowing our clients with actionable intelligence and reliable forecasts tailored to emerging regional needs.
Yes, we provide customisation as per your requirements. To learn more, feel free to contact us on sales@6wresearch.com
1 Executive Summary |
2 Introduction |
2.1 Key Highlights of the Report |
2.2 Report Description |
2.3 Market Scope & Segmentation |
2.4 Research Methodology |
2.5 Assumptions |
3 Sweden Polyurethane (PU) Microspheres Market Overview |
3.1 Sweden Country Macro Economic Indicators |
3.2 Sweden Polyurethane (PU) Microspheres Market Revenues & Volume, 2022 & 2032F |
3.3 Sweden Polyurethane (PU) Microspheres Market - Industry Life Cycle |
3.4 Sweden Polyurethane (PU) Microspheres Market - Porter's Five Forces |
3.5 Sweden Polyurethane (PU) Microspheres Market Revenues & Volume Share, By Applications, 2022 & 2032F |
4 Sweden Polyurethane (PU) Microspheres Market Dynamics |
4.1 Impact Analysis |
4.2 Market Drivers |
4.2.1 Increasing demand for lightweight materials in various industries such as automotive, construction, and cosmetics |
4.2.2 Growing emphasis on energy efficiency and sustainability, driving the adoption of polyurethane microspheres |
4.2.3 Rising investments in research and development for innovative applications of PU microspheres |
4.3 Market Restraints |
4.3.1 Volatility in raw material prices impacting the production cost of polyurethane microspheres |
4.3.2 Stringent environmental regulations regarding the use and disposal of polyurethane materials |
4.3.3 Competition from alternative materials like glass microspheres and ceramic microspheres |
5 Sweden Polyurethane (PU) Microspheres Market Trends |
6 Sweden Polyurethane (PU) Microspheres Market Segmentations |
6.1 Sweden Polyurethane (PU) Microspheres Market, By Applications |
6.1.1 Overview and Analysis |
6.1.2 Sweden Polyurethane (PU) Microspheres Market Revenues & Volume, By Encapsulation, 2022-2032F |
6.1.3 Sweden Polyurethane (PU) Microspheres Market Revenues & Volume, By Paints & coatings, 2022-2032F |
6.1.4 Sweden Polyurethane (PU) Microspheres Market Revenues & Volume, By Adhesives films, 2022-2032F |
6.1.5 Sweden Polyurethane (PU) Microspheres Market Revenues & Volume, By Cosmetics, 2022-2032F |
6.1.6 Sweden Polyurethane (PU) Microspheres Market Revenues & Volume, By Other applications, 2022-2032F |
7 Sweden Polyurethane (PU) Microspheres Market Import-Export Trade Statistics |
7.1 Sweden Polyurethane (PU) Microspheres Market Export to Major Countries |
7.2 Sweden Polyurethane (PU) Microspheres Market Imports from Major Countries |
8 Sweden Polyurethane (PU) Microspheres Market Key Performance Indicators |
8.1 Research and development investment in PU microspheres technology |
8.2 Number of patents filed for new applications of PU microspheres |
8.3 Environmental impact assessments and compliance measures implemented by PU microspheres manufacturers |
9 Sweden Polyurethane (PU) Microspheres Market - Opportunity Assessment |
9.1 Sweden Polyurethane (PU) Microspheres Market Opportunity Assessment, By Applications, 2022 & 2032F |
10 Sweden Polyurethane (PU) Microspheres Market - Competitive Landscape |
10.1 Sweden Polyurethane (PU) Microspheres Market Revenue Share, By Companies, 2025 |
10.2 Sweden Polyurethane (PU) Microspheres Market Competitive Benchmarking, By Operating and Technical Parameters |
11 Company Profiles |
12 Recommendations | 13 Disclaimer |
Global Go To Market Strategy - 2030
Export potential enables firms to identify high-growth global markets with greater confidence by combining advanced trade intelligence with a structured quantitative methodology. The framework analyzes emerging demand trends and country-level import patterns while integrating macroeconomic and trade datasets such as GDP and population forecasts, bilateral import–export flows, tariff structures, elasticity differentials between developed and developing economies, geographic distance, and import demand projections. Using weighted trade values from 2020–2024 as the base period to project country-to-country export potential for 2030, these inputs are operationalized through calculated drivers such as gravity model parameters, tariff impact factors, and projected GDP per-capita growth. Through an analysis of hidden potentials, demand hotspots, and market conditions that are most favorable to success, this method enables firms to focus on target countries, maximize returns, and global expansion with data, backed by accuracy.
By factoring in the projected importer demand gap that is currently unmet and could be potential opportunity, it identifies the potential for the Exporter (Country) among 190 countries, against the general trade analysis, which identifies the biggest importer or exporter.
To discover high-growth global markets and optimize your business strategy:
Click Here
Pricing
- Single User License$ 1,995
- Department License$ 2,400
- Site License$ 3,120
- Global License$ 3,795

Leadership Perspectives from Industry Events
Search
Thought Leadership and Analyst Meet


Our Clients
6WResearch In News
- Doha a strategic location for EV manufacturing hub: IPA Qatar
- Demand for luxury TVs surging in the GCC, says Samsung
- Empowering Growth: The Thriving Journey of Bangladesh’s Cable Industry
- Demand for luxury TVs surging in the GCC, says Samsung
- Video call with a traditional healer? Once unthinkable, it’s now common in South Africa
- Intelligent Buildings To Smooth GCC’s Path To Net Zero
Latest Reports
- Cape Verde Portable Hand-Thrown Extinguisher Market (2026-2032)
- Canada Portable Hand-Thrown Extinguisher Market (2026-2032)
- Cameroon Portable Hand-Thrown Extinguisher Market (2026-2032)
- Burundi Portable Hand-Thrown Extinguisher Market (2026-2032)
- Burkina Faso Portable Hand-Thrown Extinguisher Market (2026-2032)
- Bulgaria Portable Hand-Thrown Extinguisher Market (2026-2032)
- Brunei Portable Hand-Thrown Extinguisher Market (2026-2032)
- Botswana Portable Hand-Thrown Extinguisher Market (2026-2032)
- Bosnia and Herzegovina Portable Hand-Thrown Extinguisher Market (2026-2032)
- Bolivia Portable Hand-Thrown Extinguisher Market (2026-2032)
Industry Events and Analyst Meet

HIMTEX 2026

India Refining Summit 2026

India EV Show 2026

EV tech India Expo 2026

Auto Tech Asia 2026
Whitepaper
- Middle East & Africa Commercial Security Market Click here to view more.
- Middle East & Africa Fire Safety Systems & Equipment Market Click here to view more.
- GCC Drone Market Click here to view more.
- Middle East Lighting Fixture Market Click here to view more.
- GCC Physical & Perimeter Security Market Click here to view more.