Sweden Quinones Market (2026-2032) | Revenue, Forecast, Share, Companies, Analysis, Industry, Trends, Growth, Value, Segmentation, Size & Outlook
Market Forecast By Type (Benzene Quinone, Naphthalene Quinone, Anthraquinone, Others), By Application (Pharmaceutical, Chemical Intermediates, Dye Intermediates, Others) And Competitive Landscape
| Product Code: ETC5312660 | Publication Date: Nov 2023 | Updated Date: Apr 2026 | Product Type: Market Research Report | |
| Publisher: 6Wresearch | Author: Ravi Bhandari | No. of Pages: 60 | No. of Figures: 30 | No. of Tables: 5 |
Sweden Quinones Market Size (2020-2030)
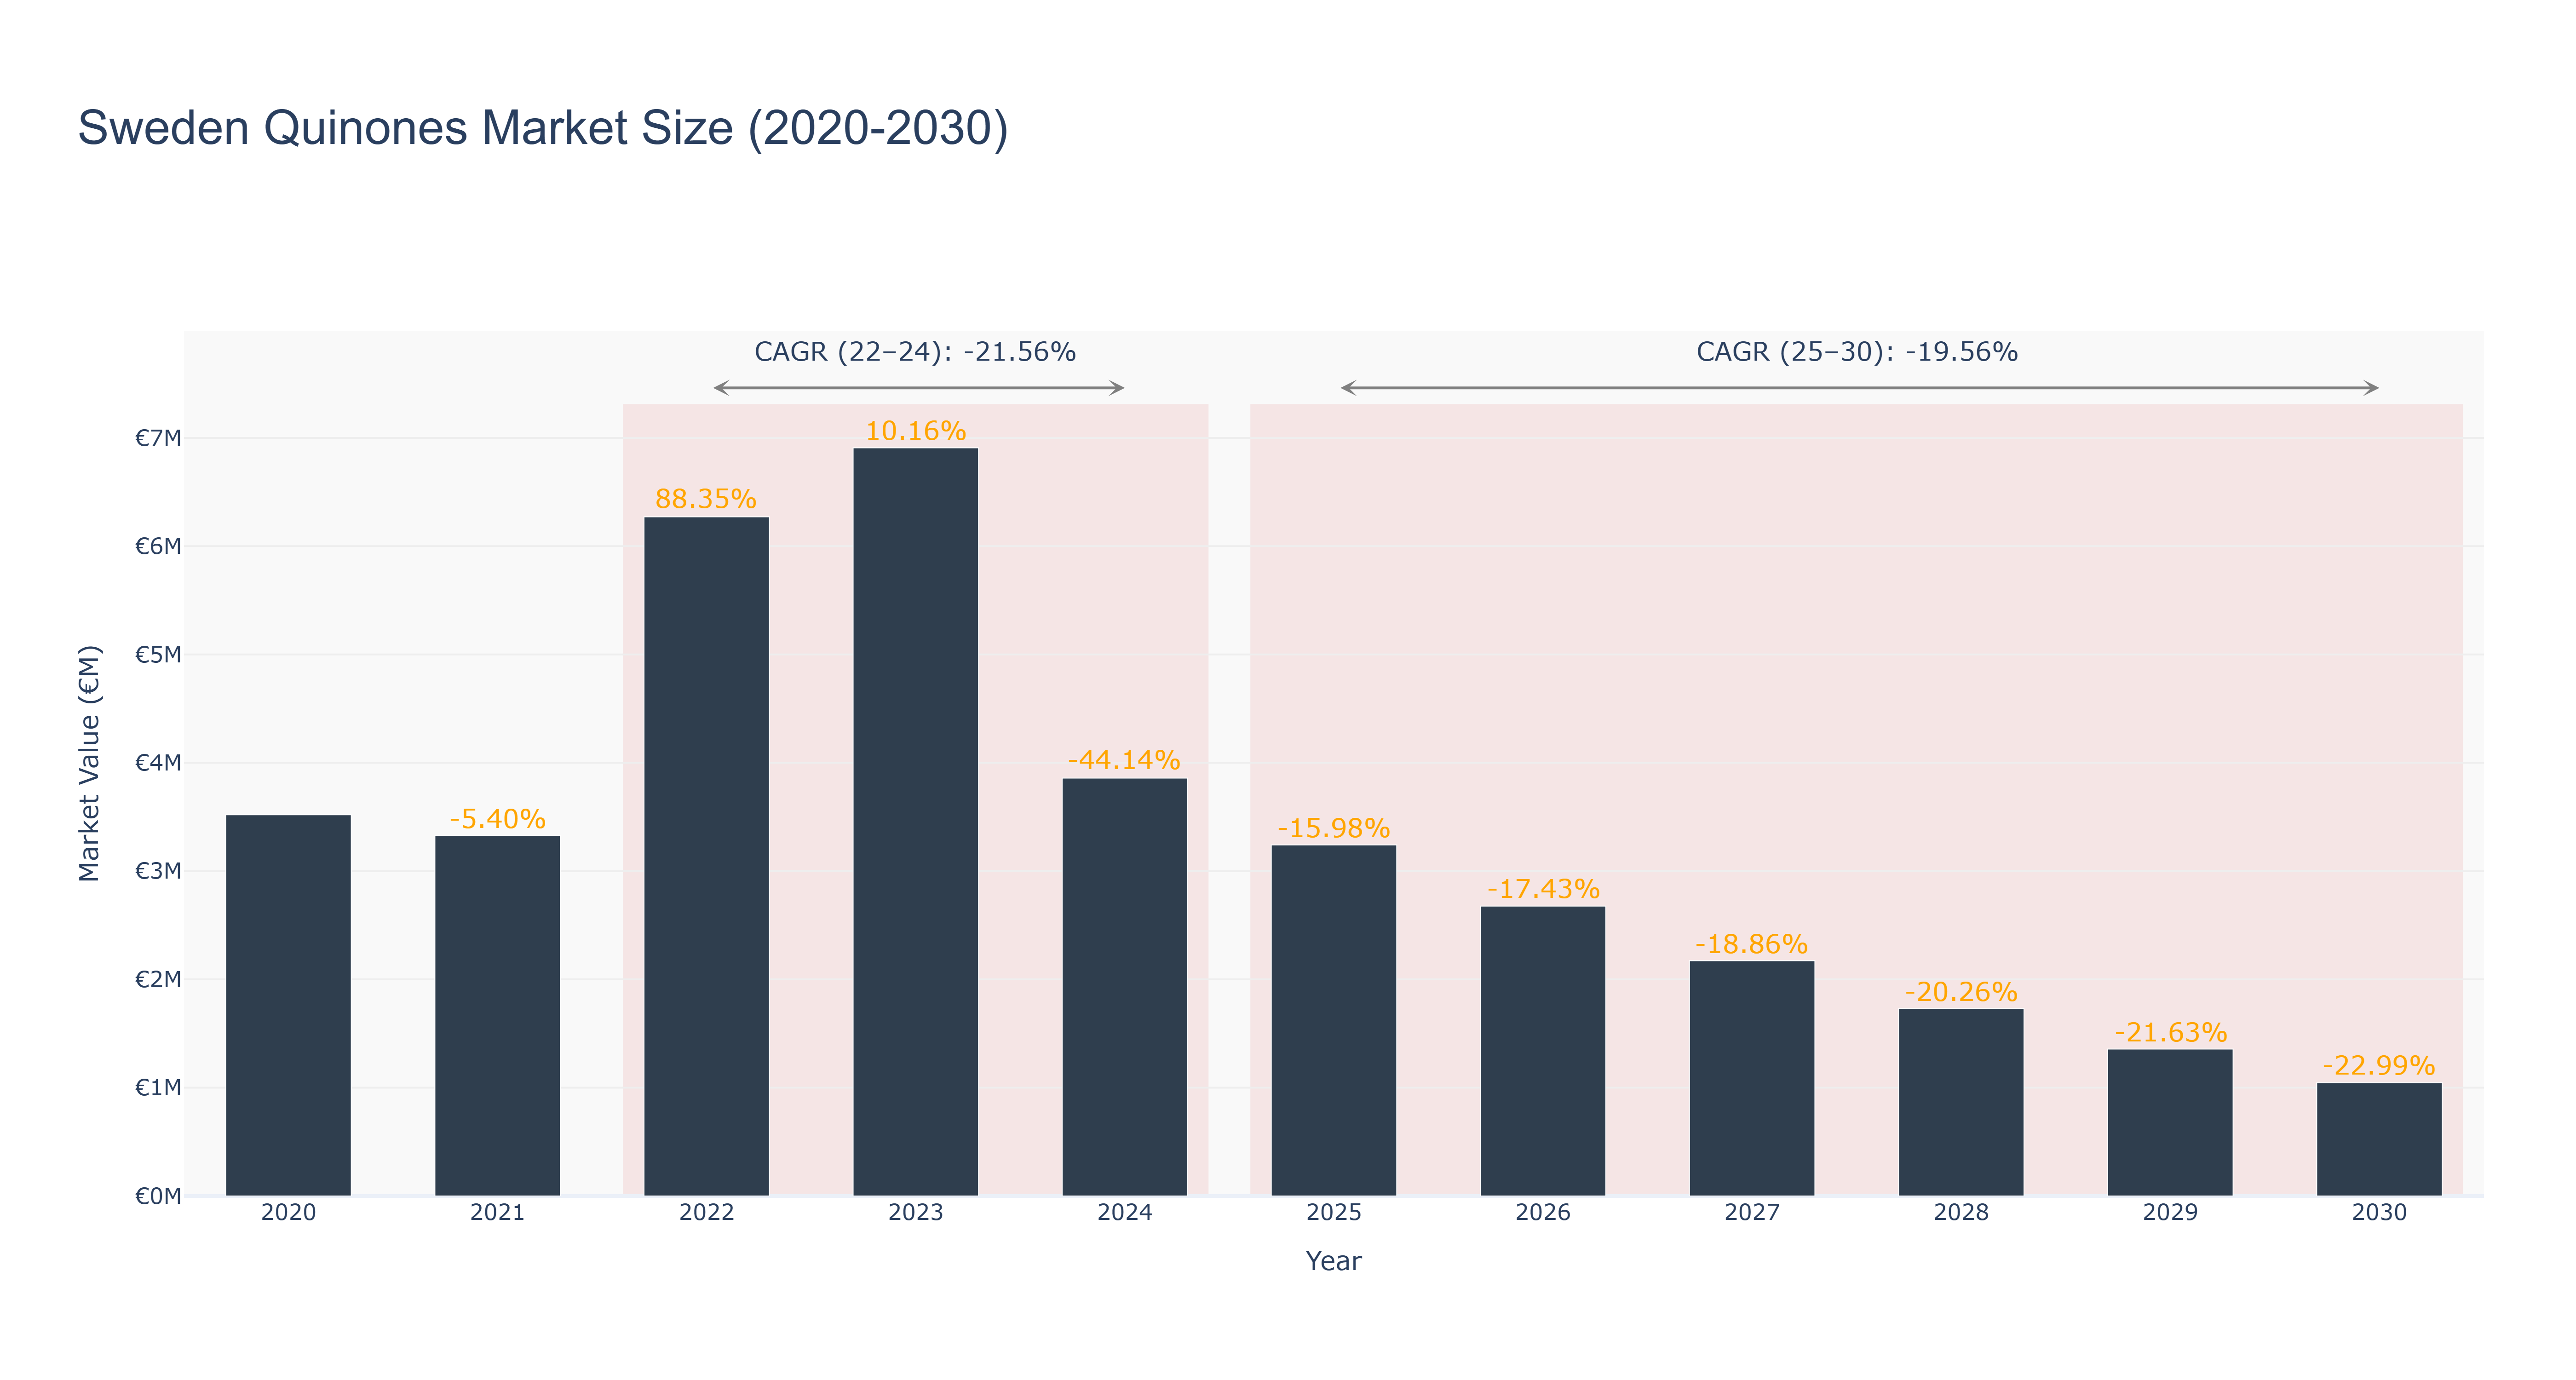
Sweden Quinones Market has seen fluctuations in market size over the years. The peak market size of €6.91 million was recorded in 2023, followed by a significant drop to €3.86 million in 2024. The market continued to decline steadily, reaching €2.68 million in 2026. The downward trend can be attributed to various factors such as changing consumer preferences, economic conditions, and competitive pressures. Looking ahead, the forecasted market size is expected to further decrease to €1.05 million by 2030, with a CAGR of -19.56% from 2025 to 2030. Despite the challenging market conditions, recent developments indicate a shift towards sustainability initiatives and technological advancements in product offerings, which could potentially drive future growth in the Sweden Quinones Market.
Sweden Quinones Market: Production & Trade Performance (2019-2025)
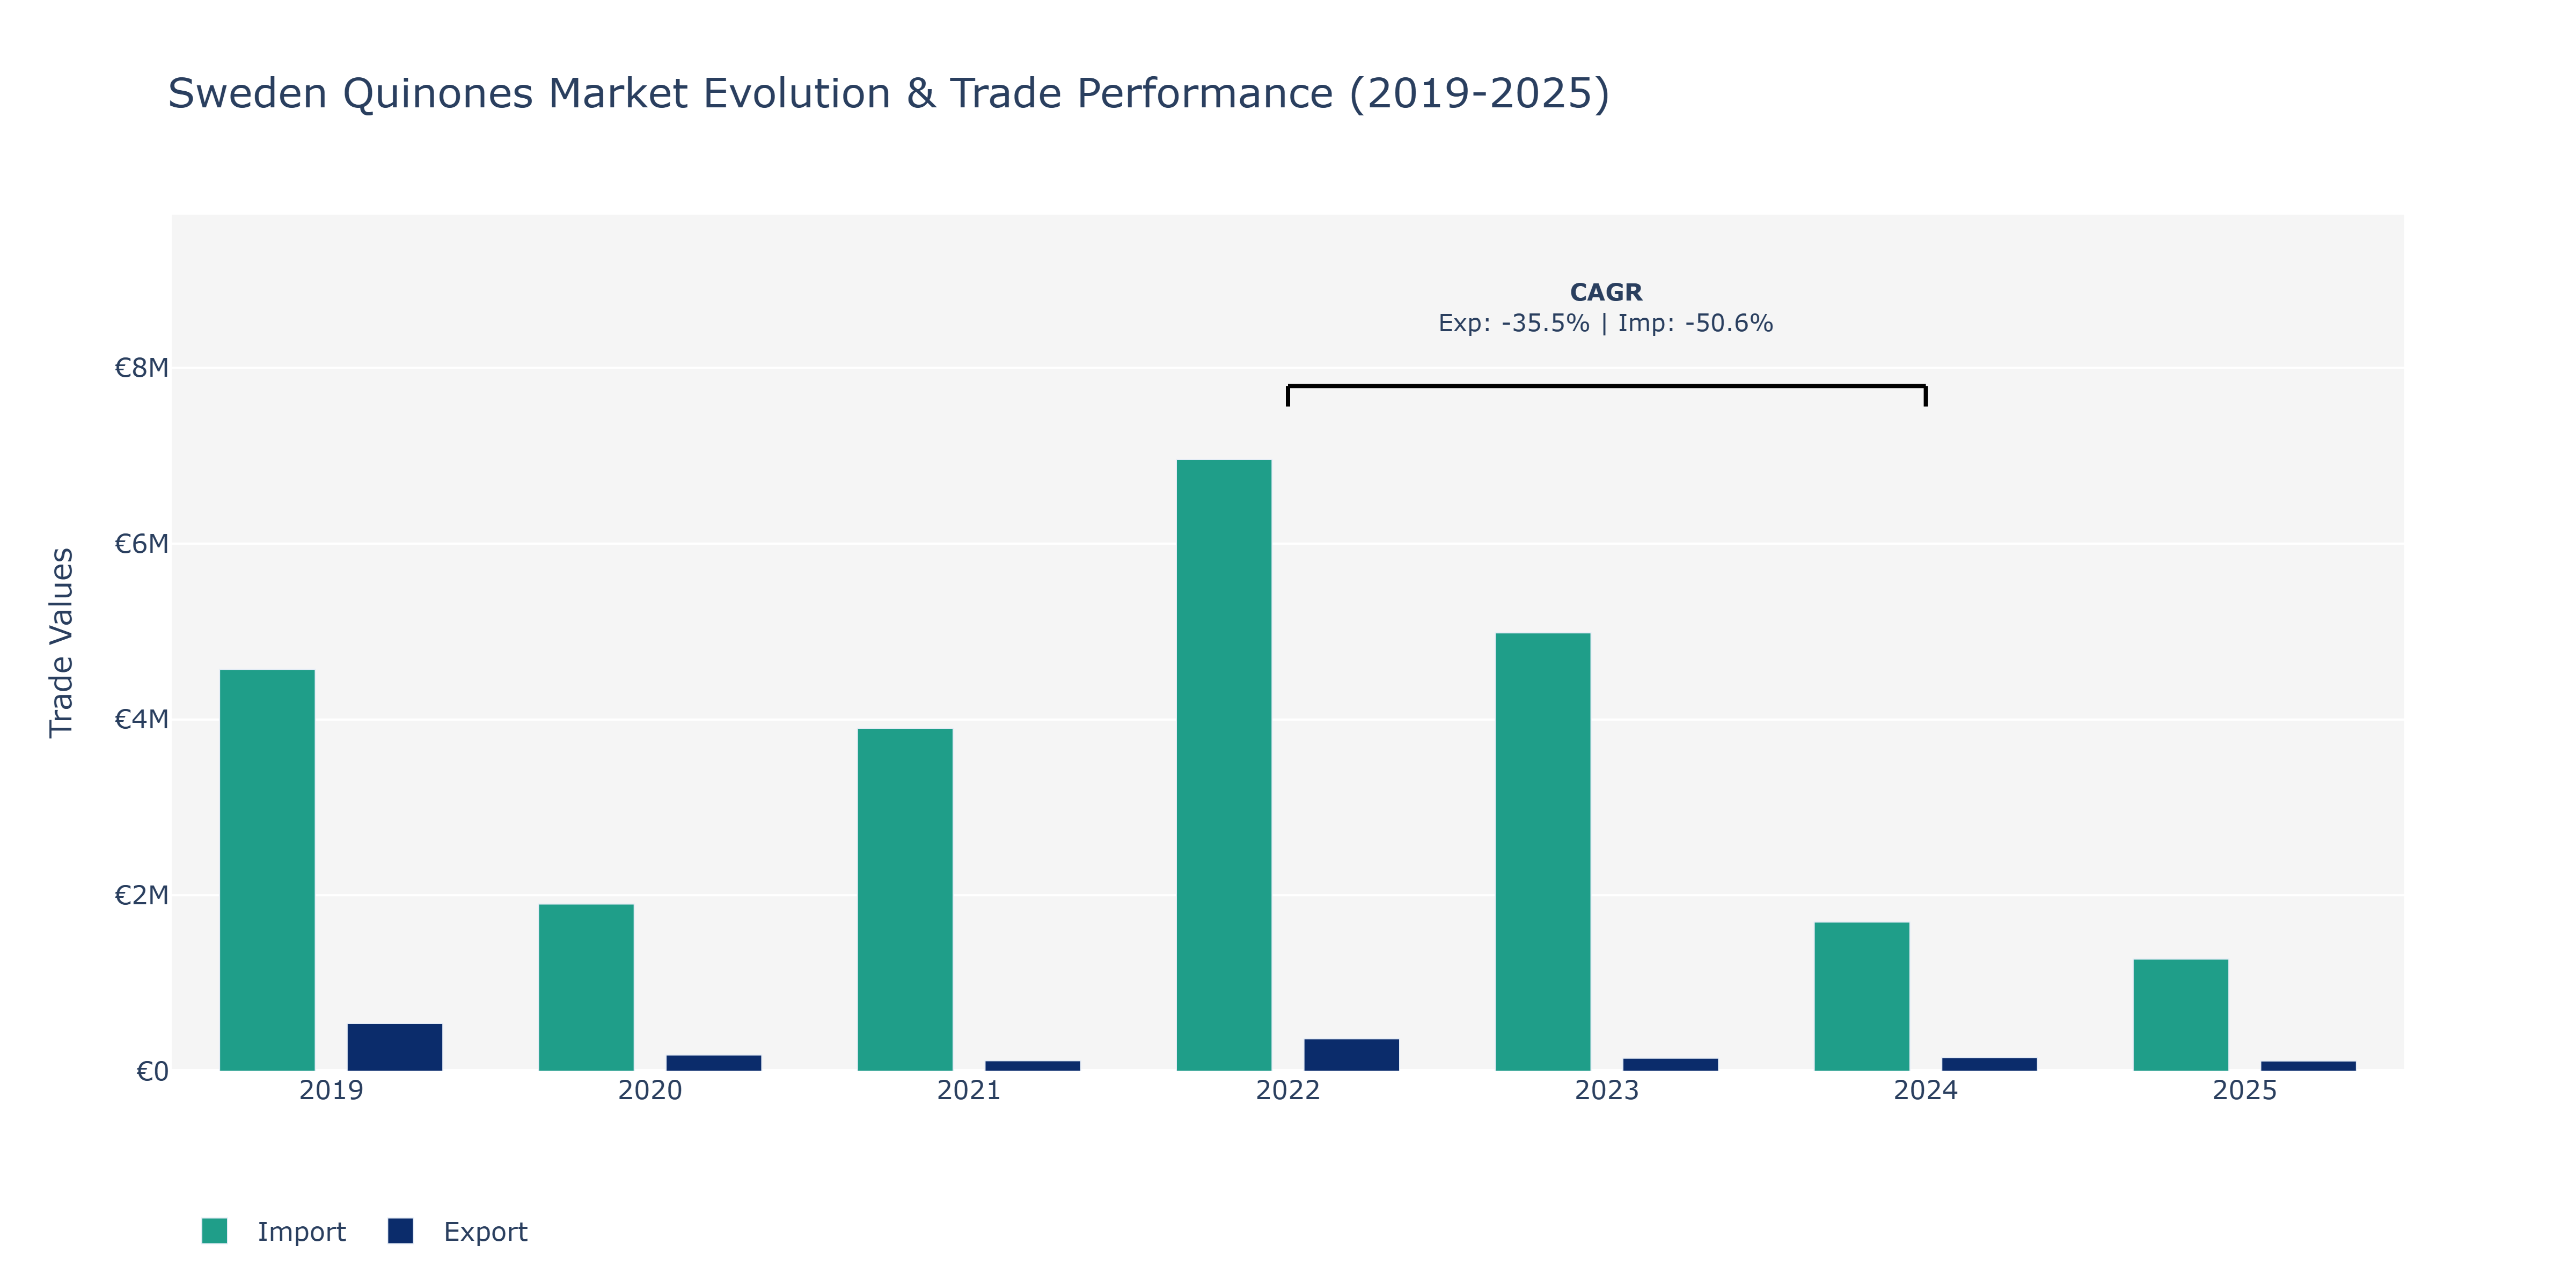
The Sweden Quinones Market experienced fluctuations in both exports and imports from 2019 to 2025. In 2019, imports were predominant at €4.57 million, while exports stood at €0.54 million. However, by 2020, there was a noticeable decline in both exports and imports, with exports plummeting to €0.18 million and imports decreasing to €1.9 million. The market saw a sharp increase in imports in 2022, reaching €6.96 million, whereas exports also surged to €0.37 million in the same year. The peak point for imports was observed in 2023 at €4.99 million, whereas exports peaked in 2019. The sharp declines in exports and imports in 2021 highlighted market volatility, possibly influenced by global economic conditions. Factors such as changes in demand, regulatory policies, and international trade relationships could have impacted these fluctuations. The CAGR data for exports and imports between 2022 and 2024 reflect a substantial negative trend, indicating challenges within the market that may require strategic interventions to stabilize trade dynamics in the coming years.
Key Highlights of the Report:
- Sweden Quinones Market Outlook
- Market Size of Sweden Quinones Market, 2025
- Forecast of Sweden Quinones Market, 2032
- Historical Data and Forecast of Sweden Quinones Revenues & Volume for the Period 2022 - 2032F
- Sweden Quinones Market Trend Evolution
- Sweden Quinones Market Drivers and Challenges
- Sweden Quinones Price Trends
- Sweden Quinones Porter`s Five Forces
- Sweden Quinones Industry Life Cycle
- Historical Data and Forecast of Sweden Quinones Market Revenues & Volume By Type for the Period 2022 - 2032F
- Historical Data and Forecast of Sweden Quinones Market Revenues & Volume By Benzene Quinone for the Period 2022 - 2032F
- Historical Data and Forecast of Sweden Quinones Market Revenues & Volume By Naphthalene Quinone for the Period 2022 - 2032F
- Historical Data and Forecast of Sweden Quinones Market Revenues & Volume By Anthraquinone for the Period 2022 - 2032F
- Historical Data and Forecast of Sweden Quinones Market Revenues & Volume By Others for the Period 2022 - 2032F
- Historical Data and Forecast of Sweden Quinones Market Revenues & Volume By Application for the Period 2022 - 2032F
- Historical Data and Forecast of Sweden Quinones Market Revenues & Volume By Pharmaceutical for the Period 2022 - 2032F
- Historical Data and Forecast of Sweden Quinones Market Revenues & Volume By Chemical Intermediates for the Period 2022 - 2032F
- Historical Data and Forecast of Sweden Quinones Market Revenues & Volume By Dye Intermediates for the Period 2022 - 2032F
- Historical Data and Forecast of Sweden Quinones Market Revenues & Volume By Others for the Period 2022 - 2032F
- Sweden Quinones Import Export Trade Statistics
- Market Opportunity Assessment By Type
- Market Opportunity Assessment By Application
- Sweden Quinones Top Companies Market Share
- Sweden Quinones Competitive Benchmarking By Technical and Operational Parameters
- Sweden Quinones Company Profiles
- Sweden Quinones Key Strategic Recommendations
Frequently Asked Questions About the Market Study (FAQs):
6Wresearch actively monitors the Sweden Quinones Market and publishes its comprehensive annual report, highlighting emerging trends, growth drivers, revenue analysis, and forecast outlook. Our insights help businesses to make data-backed strategic decisions with ongoing market dynamics. Our analysts track relevent industries related to the Sweden Quinones Market, allowing our clients with actionable intelligence and reliable forecasts tailored to emerging regional needs.
Yes, we provide customisation as per your requirements. To learn more, feel free to contact us on sales@6wresearch.com
1 Executive Summary |
2 Introduction |
2.1 Key Highlights of the Report |
2.2 Report Description |
2.3 Market Scope & Segmentation |
2.4 Research Methodology |
2.5 Assumptions |
3 Sweden Quinones Market Overview |
3.1 Sweden Country Macro Economic Indicators |
3.2 Sweden Quinones Market Revenues & Volume, 2022 & 2032F |
3.3 Sweden Quinones Market - Industry Life Cycle |
3.4 Sweden Quinones Market - Porter's Five Forces |
3.5 Sweden Quinones Market Revenues & Volume Share, By Type, 2022 & 2032F |
3.6 Sweden Quinones Market Revenues & Volume Share, By Application, 2022 & 2032F |
4 Sweden Quinones Market Dynamics |
4.1 Impact Analysis |
4.2 Market Drivers |
4.2.1 Increasing demand for renewable energy sources and sustainable chemicals |
4.2.2 Growing awareness about the environmental impact of traditional energy sources |
4.2.3 Government initiatives and regulations promoting the use of eco-friendly products |
4.3 Market Restraints |
4.3.1 High initial investment costs for quinones production facilities |
4.3.2 Limited availability of raw materials for quinones manufacturing |
4.3.3 Lack of standardized regulations and quality control measures in the quinones market |
5 Sweden Quinones Market Trends |
6 Sweden Quinones Market Segmentations |
6.1 Sweden Quinones Market, By Type |
6.1.1 Overview and Analysis |
6.1.2 Sweden Quinones Market Revenues & Volume, By Benzene Quinone, 2022 - 2032F |
6.1.3 Sweden Quinones Market Revenues & Volume, By Naphthalene Quinone, 2022 - 2032F |
6.1.4 Sweden Quinones Market Revenues & Volume, By Anthraquinone, 2022 - 2032F |
6.1.5 Sweden Quinones Market Revenues & Volume, By Others, 2022 - 2032F |
6.2 Sweden Quinones Market, By Application |
6.2.1 Overview and Analysis |
6.2.2 Sweden Quinones Market Revenues & Volume, By Pharmaceutical, 2022 - 2032F |
6.2.3 Sweden Quinones Market Revenues & Volume, By Chemical Intermediates, 2022 - 2032F |
6.2.4 Sweden Quinones Market Revenues & Volume, By Dye Intermediates, 2022 - 2032F |
6.2.5 Sweden Quinones Market Revenues & Volume, By Others, 2022 - 2032F |
7 Sweden Quinones Market Import-Export Trade Statistics |
7.1 Sweden Quinones Market Export to Major Countries |
7.2 Sweden Quinones Market Imports from Major Countries |
8 Sweden Quinones Market Key Performance Indicators |
8.1 Research and development investments in quinones technology |
8.2 Number of patents filed for quinones production processes |
8.3 Percentage of quinones products meeting sustainability certifications |
8.4 Adoption rate of quinones in key industries |
8.5 Environmental impact assessments for quinones production and usage |
9 Sweden Quinones Market - Opportunity Assessment |
9.1 Sweden Quinones Market Opportunity Assessment, By Type, 2022 & 2032F |
9.2 Sweden Quinones Market Opportunity Assessment, By Application, 2022 & 2032F |
10 Sweden Quinones Market - Competitive Landscape |
10.1 Sweden Quinones Market Revenue Share, By Companies, 2025 |
10.2 Sweden Quinones Market Competitive Benchmarking, By Operating and Technical Parameters |
11 Company Profiles |
12 Recommendations | 13 Disclaimer |
Export potential assessment - trade Analytics for 2030
Export potential enables firms to identify high-growth global markets with greater confidence by combining advanced trade intelligence with a structured quantitative methodology. The framework analyzes emerging demand trends and country-level import patterns while integrating macroeconomic and trade datasets such as GDP and population forecasts, bilateral import–export flows, tariff structures, elasticity differentials between developed and developing economies, geographic distance, and import demand projections. Using weighted trade values from 2020–2024 as the base period to project country-to-country export potential for 2030, these inputs are operationalized through calculated drivers such as gravity model parameters, tariff impact factors, and projected GDP per-capita growth. Through an analysis of hidden potentials, demand hotspots, and market conditions that are most favorable to success, this method enables firms to focus on target countries, maximize returns, and global expansion with data, backed by accuracy.
By factoring in the projected importer demand gap that is currently unmet and could be potential opportunity, it identifies the potential for the Exporter (Country) among 190 countries, against the general trade analysis, which identifies the biggest importer or exporter.
To discover high-growth global markets and optimize your business strategy:
Click Here
Pricing
- Single User License$ 1,995
- Department License$ 2,400
- Site License$ 3,120
- Global License$ 3,795

Search
Thought Leadership and Analyst Meet


Our Clients
Latest Reports
- Canada Cloud CFD Market (2026-2032) | Size & Revenue, Industry, Growth, Competitive Landscape, Forecast, Segmentation, Value, Outlook, Trends, Share, Analysis, Companies
- Taiwan Food Delivery Platform Market (2026-2032) | Companies, Outlook, Analysis, Trends, Value, Revenue, Segmentation, Share, Forecast, Competitive Landscape, Growth, Size & Forecast
- United Kingdom (UK) Long-term Care Insurance Market (2026-2032) | Growth, Share, Consumer Insights, Drivers, Opportunities, Competition, Pricing Analysis, Segments, Restraints, Companies, Competitive, Value, Outlook, Size, Demand, Analysis, Challenges, Strategic Insights, Investment Trends, Revenue, Trends, Supply, Forecast
- United Kingdom (UK) Long Term Care Market (2026-2032) | Companies, Outlook, Analysis, Trends, Value, Revenue, Segmentation, Share, Forecast, Competitive Landscape, Growth, Size & Forecast
- Iraq Insulation and Waterproofing Market (2026-2032) | Outlook, Drivers, Growth, Size, Share, Industry, Revenue, Trends, Demand, Competitive, Strategic Insights, Opportunities, Segments, Companies, Challenges, Strategy, Consumer Insights, Analysis, Investment Trends, Value, Segmentation, Forecast, Restraints
- India Switchgear Market Outlook (2026-2032) | Size, Share, Trends, Growth, Revenue, Forecast, Analysis, Value, Outlook
- Pakistan Contraceptive Implants Market (2025-2031) | Demand, Growth, Size, Share, Industry, Pricing Analysis, Competitive, Strategic Insights, Strategy, Consumer Insights, Analysis, Investment Trends, Opportunities, Revenue, Segments, Value, Segmentation, Supply, Forecast, Restraints, Outlook, Competition, Drivers, Trends, Companies, Challenges
- Sri Lanka Packaging Market (2026-2032) | Outlook, Competition, Drivers, Trends, Demand, Pricing Analysis, Competitive, Strategic Insights, Companies, Challenges, Strategy, Consumer Insights, Analysis, Investment Trends, Opportunities, Growth, Size, Share, Industry, Revenue, Segments, Value, Segmentation, Supply, Forecast, Restraints
- India Kids Watches Market (2026-2032) | Strategy, Consumer Insights, Analysis, Investment Trends, Opportunities, Growth, Size, Share, Industry, Revenue, Segments, Value, Segmentation, Supply, Forecast, Restraints, Outlook, Competition, Drivers, Trends, Demand, Pricing Analysis, Competitive, Strategic Insights, Companies, Challenges
- Saudi Arabia Core Assurance Service Market (2025-2031) | Strategy, Consumer Insights, Analysis, Investment Trends, Opportunities, Growth, Size, Share, Industry, Revenue, Segments, Value, Segmentation, Supply, Forecast, Restraints, Outlook, Competition, Drivers, Trends, Demand, Pricing Analysis, Competitive, Strategic Insights, Companies, Challenges
Industry Events and Analyst Meet

India EV Show 2026

EV tech India Expo 2026

Auto Tech Asia 2026

Battery Tech India 2026

Smart Production Solutions Guangzhou 2026
Whitepaper
- Middle East & Africa Commercial Security Market Click here to view more.
- Middle East & Africa Fire Safety Systems & Equipment Market Click here to view more.
- GCC Drone Market Click here to view more.
- Middle East Lighting Fixture Market Click here to view more.
- GCC Physical & Perimeter Security Market Click here to view more.
6WResearch In News
- Doha a strategic location for EV manufacturing hub: IPA Qatar
- Demand for luxury TVs surging in the GCC, says Samsung
- Empowering Growth: The Thriving Journey of Bangladesh’s Cable Industry
- Demand for luxury TVs surging in the GCC, says Samsung
- Video call with a traditional healer? Once unthinkable, it’s now common in South Africa
- Intelligent Buildings To Smooth GCC’s Path To Net Zero