Sweden Vanadium compounds Market (2025-2031) | Growth, Industry, Revenue, Companies, Trends, Share, Segmentation, Size, Value, Outlook, Analysis & Forecast
Market Forecast By Application (Chemical Catalysts, Pharmaceuticals, Pigments, Glaze) And Competitive Landscape
| Product Code: ETC4811516 | Publication Date: Nov 2023 | Updated Date: Apr 2026 | Product Type: Market Research Report | |
| Publisher: 6Wresearch | Author: Shubham Padhi | No. of Pages: 60 | No. of Figures: 30 | No. of Tables: 5 |
Sweden Vanadium Compounds Market Size (2020-2030)
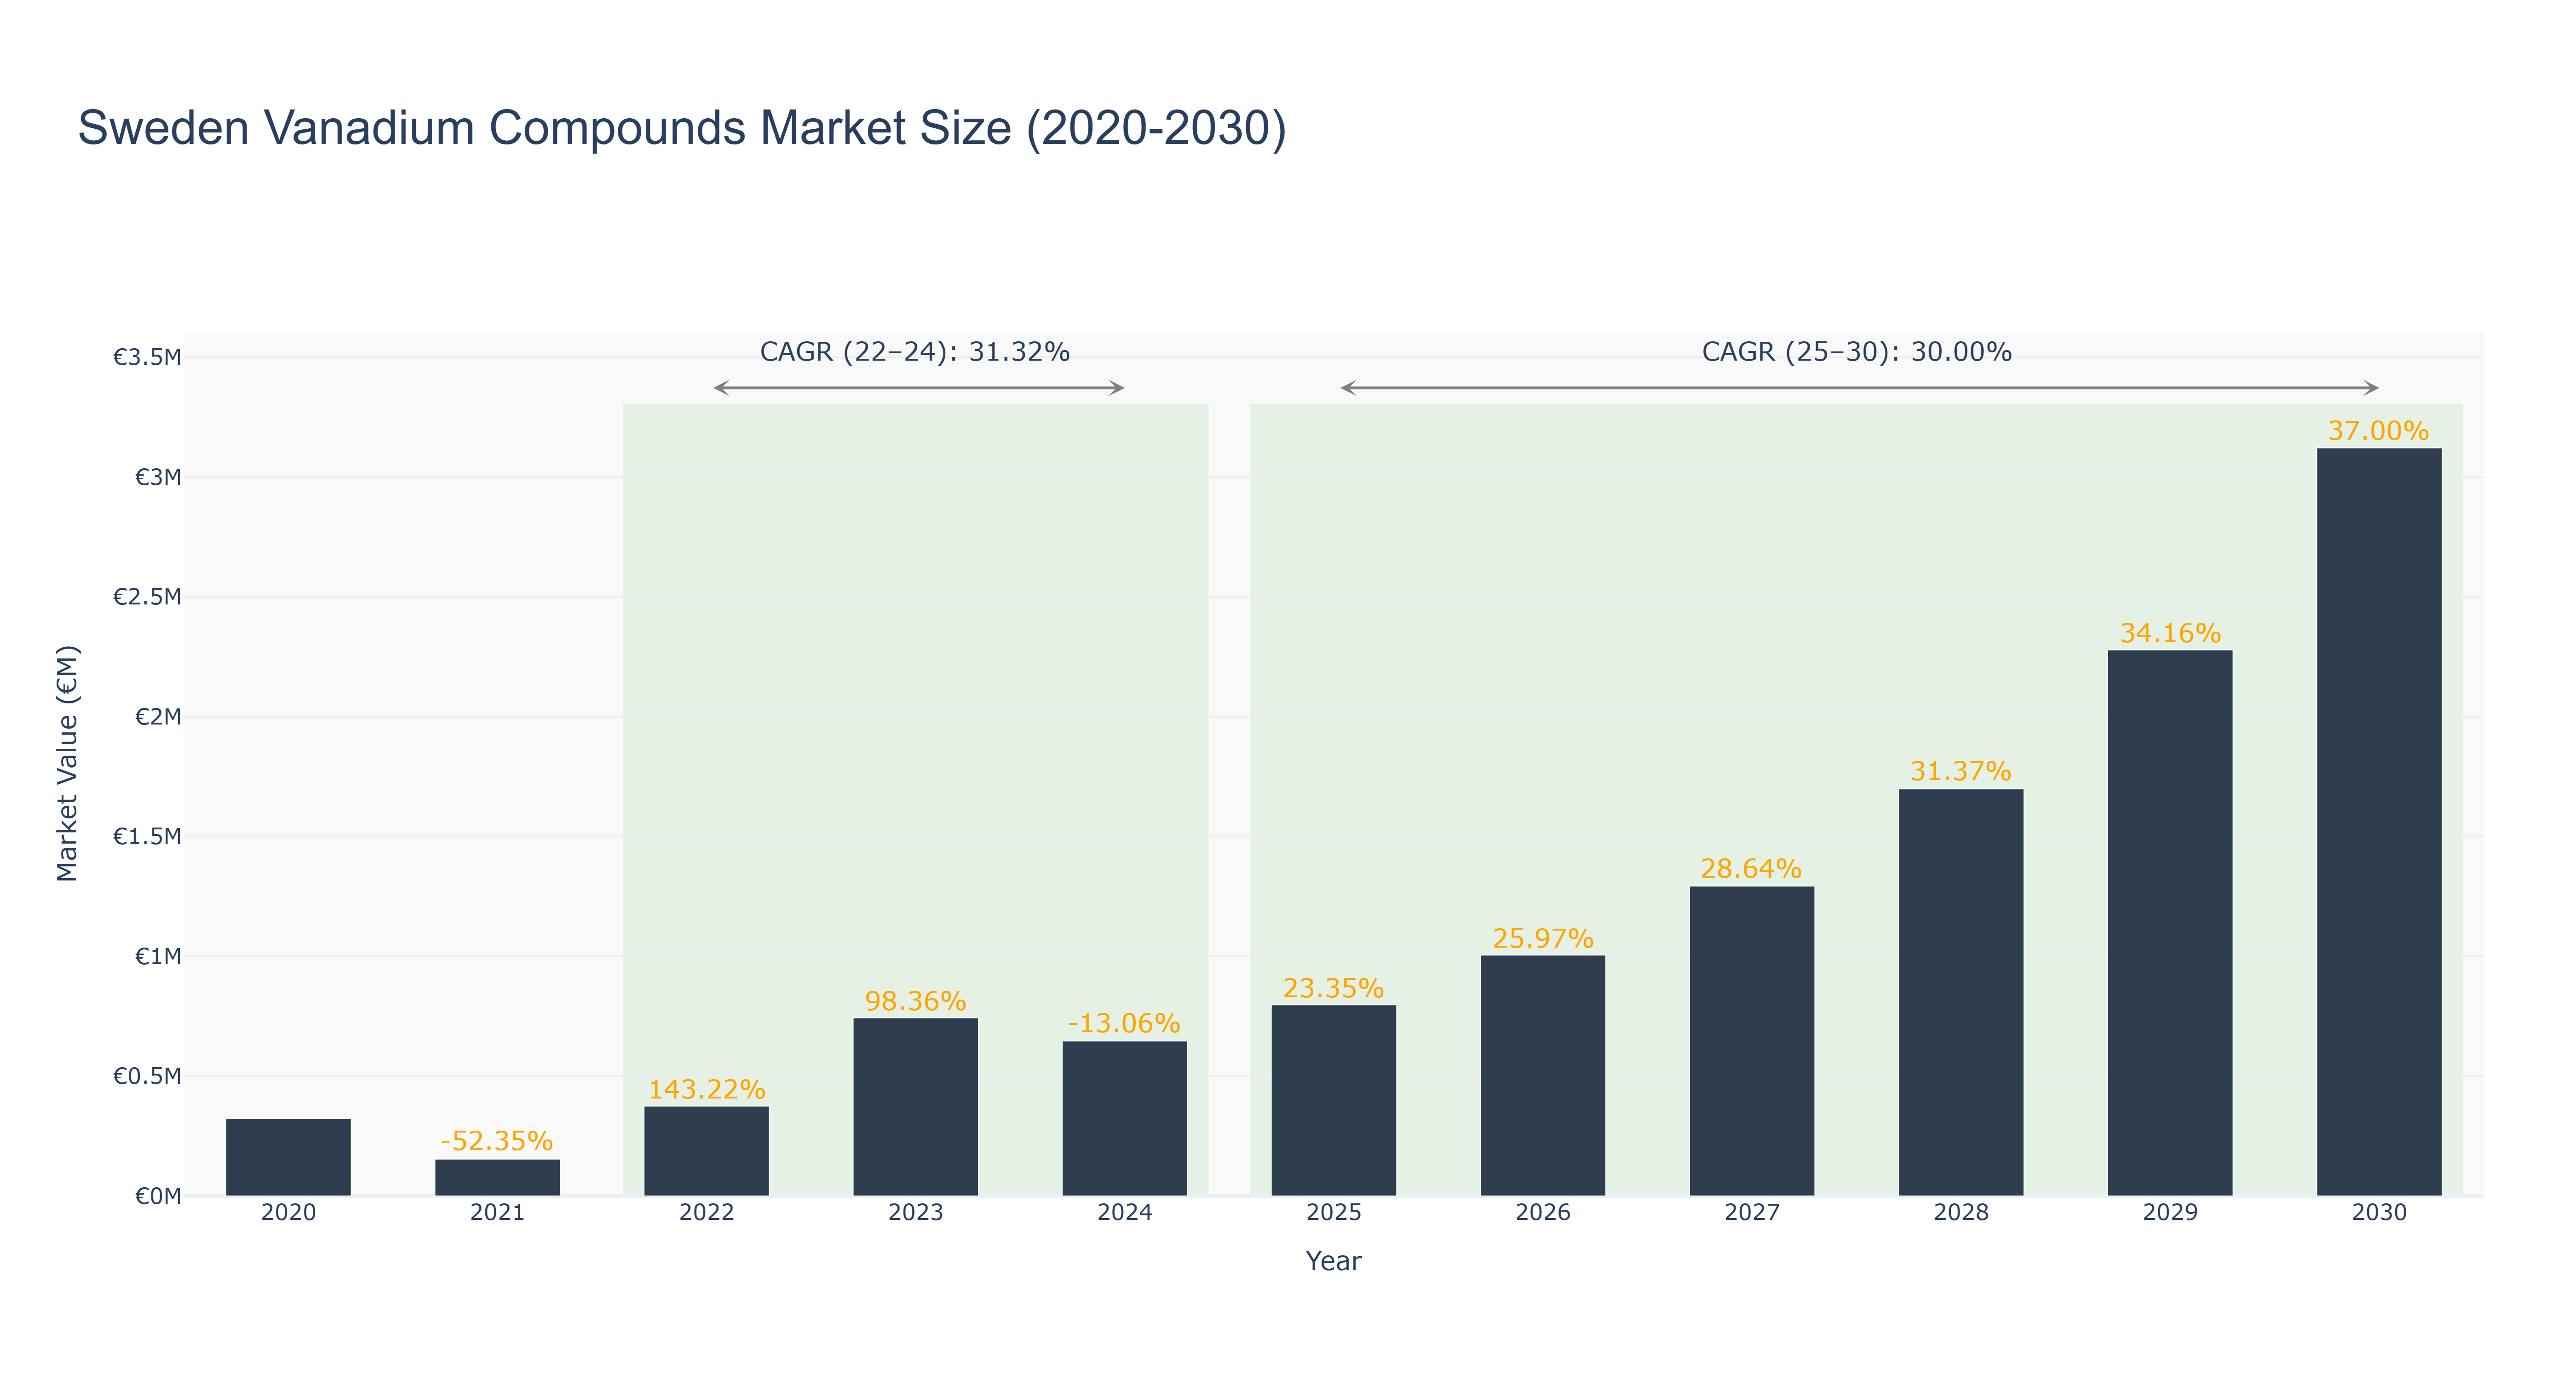
Sweden Vanadium Compounds Market has shown a fluctuating trend over the past decade. The market peaked at €3.12 million in 2030, with a steady growth rate of 37.00% from 2029. However, from 2020 to 2024, the market experienced a decline in size, reaching €0.65 million in 2024 due to a negative growth rate of -13.06%. This downward trend was attributed to economic uncertainties and regulatory challenges. Moving forward, the market is forecasted to grow significantly from 2025 to 2030, with a CAGR of 30.0%. The recent development in the sector includes the launch of innovative vanadium-based energy storage solutions to meet the increasing demand for sustainable energy sources in Sweden. This initiative is expected to drive market growth further by enhancing energy efficiency and grid stability. Industry drivers for the Sweden Vanadium Compounds Market include the rising adoption of renewable energy technologies, government support for clean energy initiatives, and increasing investments in energy storage infrastructure. These factors are driving the demand for vanadium compounds in various applications, such as energy storage systems and steel production, contributing to the market's growth trajectory.
Sweden Vanadium Compounds Market: Production & Trade Performance (2019-2025)
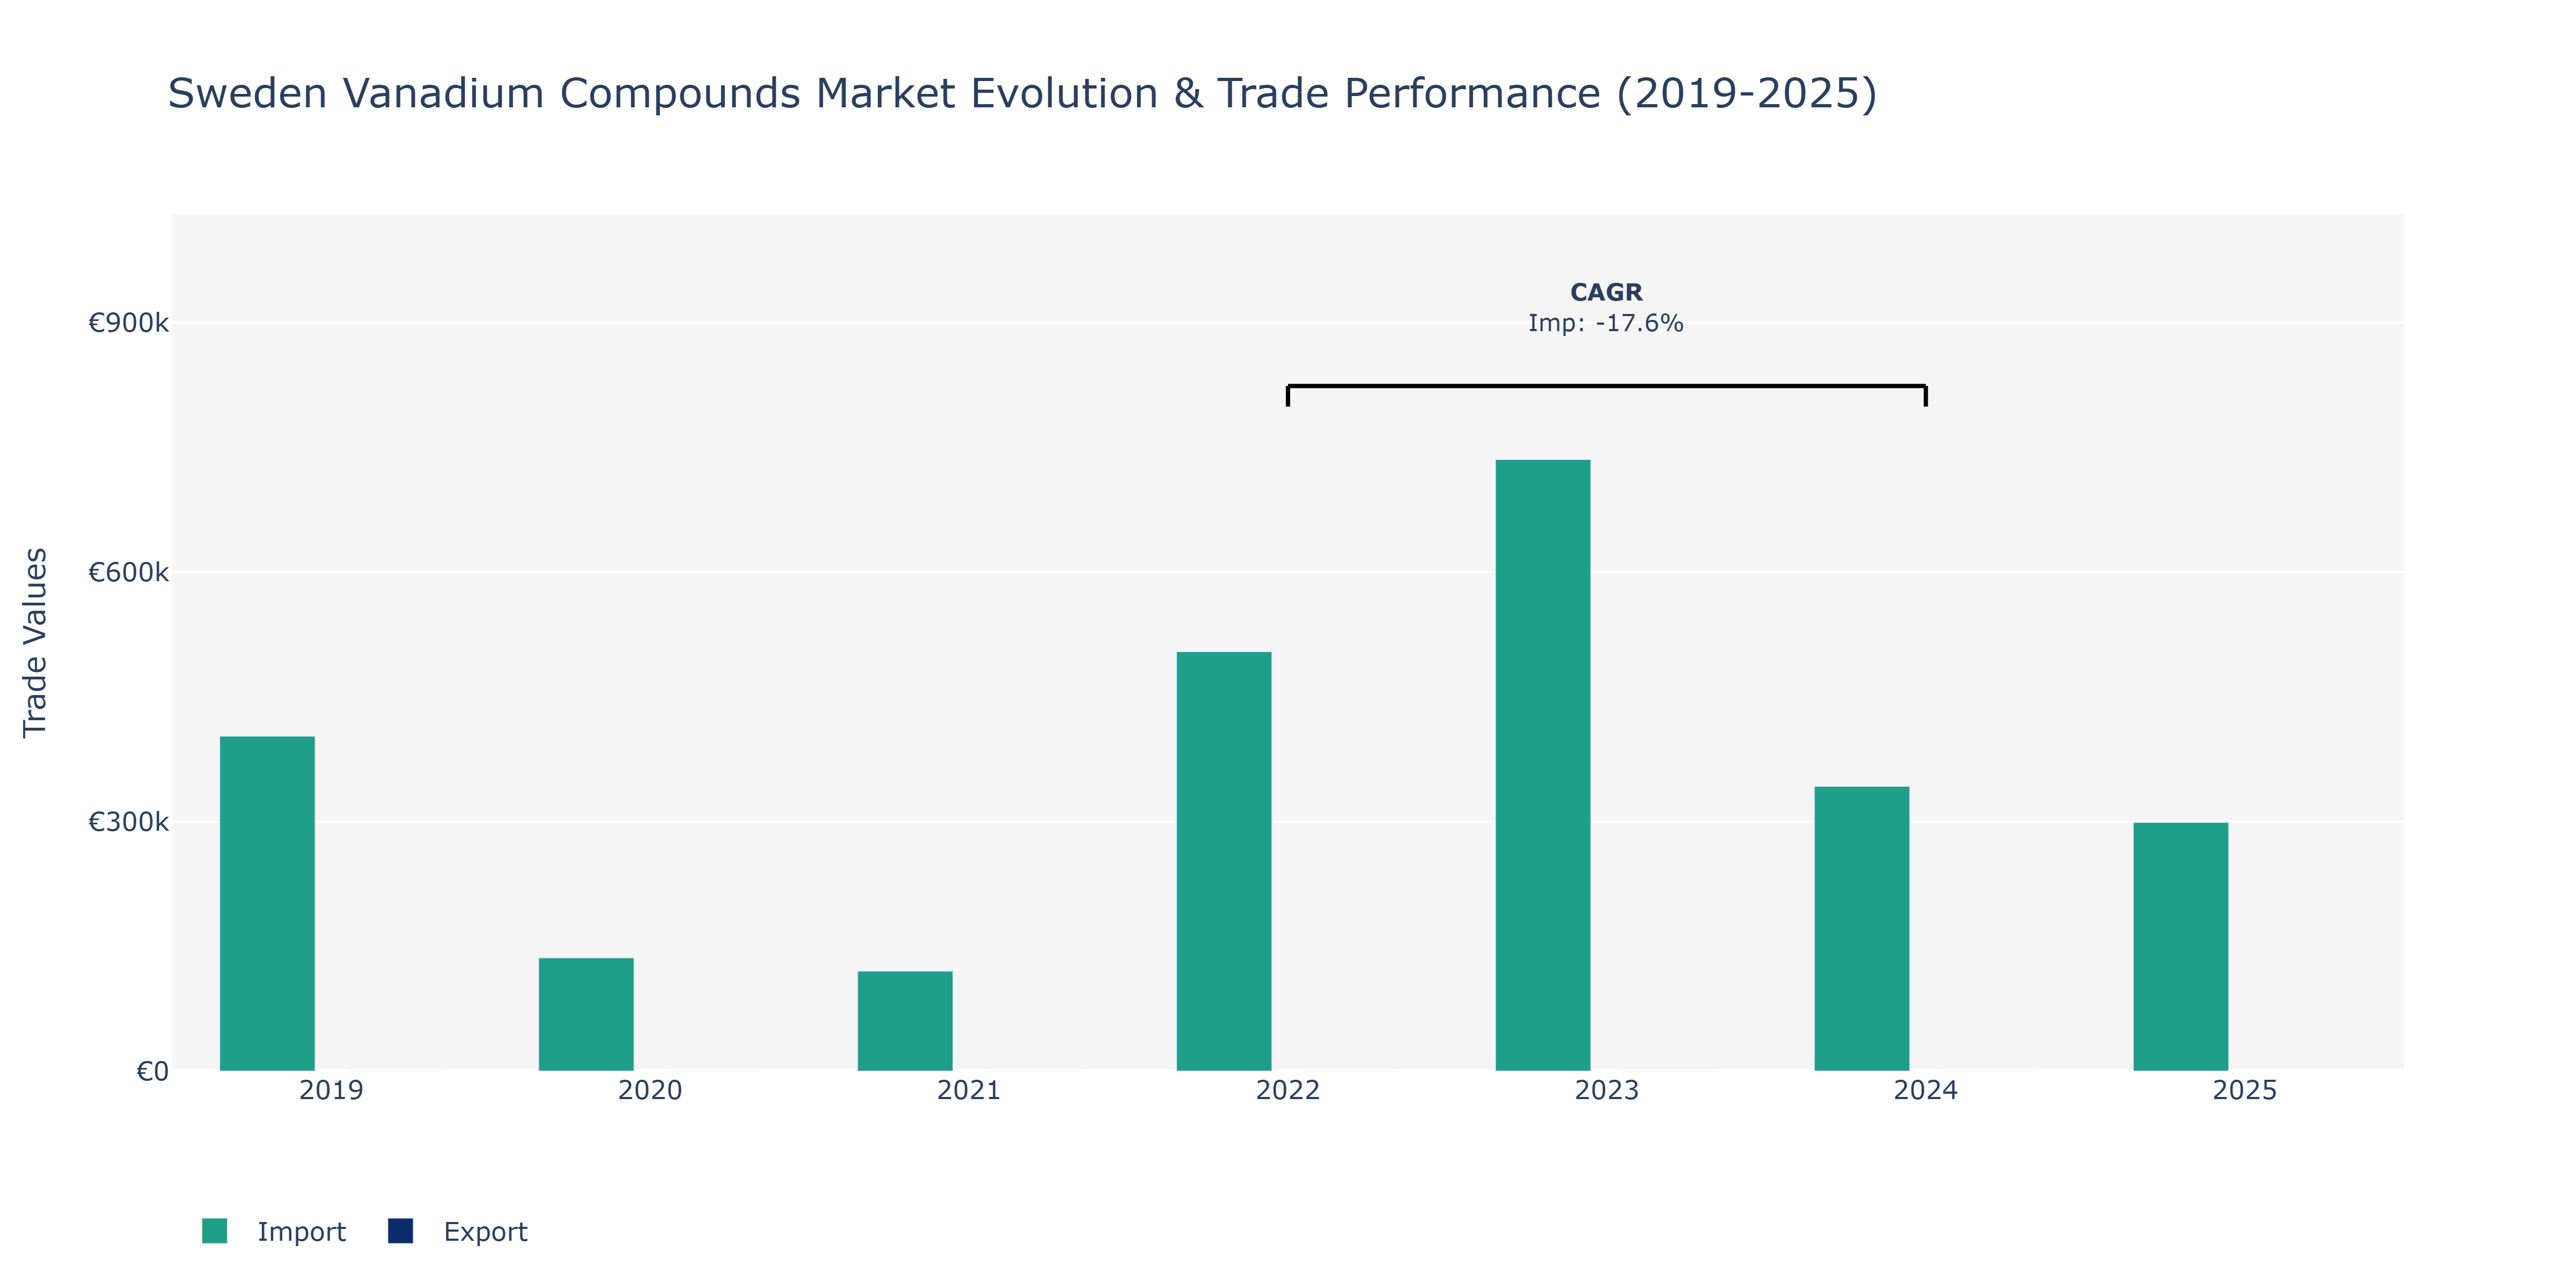
The Sweden Vanadium Compounds Market witnessed notable fluctuations in exports and imports throughout the years analyzed. In 2019, imports stood at approximately €402.96 thousand, indicating a substantial base for market activity. The subsequent year, 2020, saw a significant drop in exports to just €3, while imports decreased to around €136.46 thousand. This decline could be attributed to global economic uncertainties affecting trade dynamics. However, by 2021, imports rebounded to around €120.55 thousand, showcasing resilience in market demand. The year 2022 marked a substantial spike in imports to €504.54 thousand, potentially driven by increased industrial applications of vanadium compounds. Notably, in 2023 and 2024, exports displayed a fluctuating trend, with values of €98 and €1, respectively. The consistent rise in imports until 2025, reaching approximately €299.19 thousand, suggests a sustained need for vanadium compounds in various sectors. The observed fluctuations emphasize the market's sensitivity to external factors, highlighting the importance of strategic planning to navigate uncertainties in global trade environments.
Key Highlights of the Report:
- Sweden Vanadium compounds Market Outlook
- Market Size of Sweden Vanadium compounds Market, 2024
- Forecast of Sweden Vanadium compounds Market, 2031
- Historical Data and Forecast of Sweden Vanadium compounds Revenues & Volume for the Period 2021-2031
- Sweden Vanadium compounds Market Trend Evolution
- Sweden Vanadium compounds Market Drivers and Challenges
- Sweden Vanadium compounds Price Trends
- Sweden Vanadium compounds Porter`s Five Forces
- Sweden Vanadium compounds Industry Life Cycle
- Historical Data and Forecast of Sweden Vanadium compounds Market Revenues & Volume By Application for the Period 2021-2031
- Historical Data and Forecast of Sweden Vanadium compounds Market Revenues & Volume By Chemical Catalysts for the Period 2021-2031
- Historical Data and Forecast of Sweden Vanadium compounds Market Revenues & Volume By Pharmaceuticals for the Period 2021-2031
- Historical Data and Forecast of Sweden Vanadium compounds Market Revenues & Volume By Pigments for the Period 2021-2031
- Historical Data and Forecast of Sweden Vanadium compounds Market Revenues & Volume By Glaze for the Period 2021-2031
- Sweden Vanadium compounds Import Export Trade Statistics
- Market Opportunity Assessment By Application
- Sweden Vanadium compounds Top Companies Market Share
- Sweden Vanadium compounds Competitive Benchmarking By Technical and Operational Parameters
- Sweden Vanadium compounds Company Profiles
- Sweden Vanadium compounds Key Strategic Recommendations
Frequently Asked Questions About the Market Study (FAQs):
6Wresearch actively monitors the Sweden Vanadium compounds Market and publishes its comprehensive annual report, highlighting emerging trends, growth drivers, revenue analysis, and forecast outlook. Our insights help businesses to make data-backed strategic decisions with ongoing market dynamics. Our analysts track relevent industries related to the Sweden Vanadium compounds Market, allowing our clients with actionable intelligence and reliable forecasts tailored to emerging regional needs.
Yes, we provide customisation as per your requirements. To learn more, feel free to contact us on sales@6wresearch.com
1 Executive Summary |
2 Introduction |
2.1 Key Highlights of the Report |
2.2 Report Description |
2.3 Market Scope & Segmentation |
2.4 Research Methodology |
2.5 Assumptions |
3 Sweden Vanadium compounds Market Overview |
3.1 Sweden Country Macro Economic Indicators |
3.2 Sweden Vanadium compounds Market Revenues & Volume, 2021 & 2031F |
3.3 Sweden Vanadium compounds Market - Industry Life Cycle |
3.4 Sweden Vanadium compounds Market - Porter's Five Forces |
3.5 Sweden Vanadium compounds Market Revenues & Volume Share, By Application, 2021 & 2031F |
4 Sweden Vanadium compounds Market Dynamics |
4.1 Impact Analysis |
4.2 Market Drivers |
4.2.1 Increasing demand for renewable energy sources, leading to higher adoption of energy storage solutions using vanadium compounds. |
4.2.2 Growing focus on sustainable development and green technologies, driving the use of vanadium compounds in energy storage systems and catalysts. |
4.2.3 Technological advancements in vanadium redox flow batteries, enhancing the efficiency and performance of energy storage solutions. |
4.3 Market Restraints |
4.3.1 Volatility in vanadium prices due to supply-demand imbalances and geopolitical factors impacting the overall cost of vanadium compounds. |
4.3.2 Regulatory challenges and environmental concerns related to the production and disposal of vanadium compounds. |
4.3.3 Competition from alternative energy storage technologies and materials, posing a threat to the market growth of vanadium compounds. |
5 Sweden Vanadium compounds Market Trends |
6 Sweden Vanadium compounds Market Segmentations |
6.1 Sweden Vanadium compounds Market, By Application |
6.1.1 Overview and Analysis |
6.1.2 Sweden Vanadium compounds Market Revenues & Volume, By Chemical Catalysts, 2021-2031F |
6.1.3 Sweden Vanadium compounds Market Revenues & Volume, By Pharmaceuticals, 2021-2031F |
6.1.4 Sweden Vanadium compounds Market Revenues & Volume, By Pigments, 2021-2031F |
6.1.5 Sweden Vanadium compounds Market Revenues & Volume, By Glaze, 2021-2031F |
7 Sweden Vanadium compounds Market Import-Export Trade Statistics |
7.1 Sweden Vanadium compounds Market Export to Major Countries |
7.2 Sweden Vanadium compounds Market Imports from Major Countries |
8 Sweden Vanadium compounds Market Key Performance Indicators |
8.1 Research and development investments in vanadium compound technologies. |
8.2 Efficiency improvements in vanadium redox flow batteries. |
8.3 Adoption rate of vanadium compounds in energy storage projects. |
8.4 Environmental impact assessments and sustainability certifications for vanadium compound production. |
8.5 Innovation rate in vanadium compound applications. |
9 Sweden Vanadium compounds Market - Opportunity Assessment |
9.1 Sweden Vanadium compounds Market Opportunity Assessment, By Application, 2021 & 2031F |
10 Sweden Vanadium compounds Market - Competitive Landscape |
10.1 Sweden Vanadium compounds Market Revenue Share, By Companies, 2024 |
10.2 Sweden Vanadium compounds Market Competitive Benchmarking, By Operating and Technical Parameters |
11 Company Profiles |
12 Recommendations | 13 Disclaimer |
Global Go To Market Strategy - 2030
Export potential enables firms to identify high-growth global markets with greater confidence by combining advanced trade intelligence with a structured quantitative methodology. The framework analyzes emerging demand trends and country-level import patterns while integrating macroeconomic and trade datasets such as GDP and population forecasts, bilateral import–export flows, tariff structures, elasticity differentials between developed and developing economies, geographic distance, and import demand projections. Using weighted trade values from 2020–2024 as the base period to project country-to-country export potential for 2030, these inputs are operationalized through calculated drivers such as gravity model parameters, tariff impact factors, and projected GDP per-capita growth. Through an analysis of hidden potentials, demand hotspots, and market conditions that are most favorable to success, this method enables firms to focus on target countries, maximize returns, and global expansion with data, backed by accuracy.
By factoring in the projected importer demand gap that is currently unmet and could be potential opportunity, it identifies the potential for the Exporter (Country) among 190 countries, against the general trade analysis, which identifies the biggest importer or exporter.
To discover high-growth global markets and optimize your business strategy:
Click Here
Pricing
- Single User License$ 1,995
- Department License$ 2,400
- Site License$ 3,120
- Global License$ 3,795

Leadership Perspectives from Industry Events
Search
Thought Leadership and Analyst Meet


Our Clients
6WResearch In News
- Doha a strategic location for EV manufacturing hub: IPA Qatar
- Demand for luxury TVs surging in the GCC, says Samsung
- Empowering Growth: The Thriving Journey of Bangladesh’s Cable Industry
- Demand for luxury TVs surging in the GCC, says Samsung
- Video call with a traditional healer? Once unthinkable, it’s now common in South Africa
- Intelligent Buildings To Smooth GCC’s Path To Net Zero
Latest Reports
- Taiwan Airport Wireless Infrastructure Market (2026-2032)
- Vietnam Airport Wireless Infrastructure Market (2026-2032)
- Thailand Airport Wireless Infrastructure Market (2026-2032)
- South Korea Airport Wireless Infrastructure Market (2026-2032)
- Romania Airport Wireless Infrastructure Market (2026-2032)
- Qatar Airport Wireless Infrastructure Market (2026-2032)
- Philippines Airport Wireless Infrastructure Market (2026-2032)
- Japan Airport Wireless Infrastructure Market (2026-2032)
- Taiwan Airport Winter Services Market (2026-2032)
- Vietnam Airport Winter Services Market (2026-2032)
Industry Events and Analyst Meet

HIMTEX 2026

India Refining Summit 2026

India EV Show 2026

EV tech India Expo 2026

Auto Tech Asia 2026
Whitepaper
- Middle East & Africa Commercial Security Market Click here to view more.
- Middle East & Africa Fire Safety Systems & Equipment Market Click here to view more.
- GCC Drone Market Click here to view more.
- Middle East Lighting Fixture Market Click here to view more.
- GCC Physical & Perimeter Security Market Click here to view more.