Switzerland Bunker Fuel Market (2026-2032) | Analysis, Value, Outlook, Segmentation, Revenue, Share, Companies, Industry, Trends, Forecast, Growth & Size
Market Forecast By Type (High Sulfur Fuel Oil, Low Sulfur Fuel Oil, Marine Gas Oil, Others), By Commerical Distributor (Oil Majors, Large Independent, Small Independent) And Competitive Landscape
| Product Code: ETC4823620 | Publication Date: Nov 2023 | Updated Date: Mar 2026 | Product Type: Market Research Report | |
| Publisher: 6Wresearch | Author: Sachin Kumar Rai | No. of Pages: 60 | No. of Figures: 30 | No. of Tables: 5 |
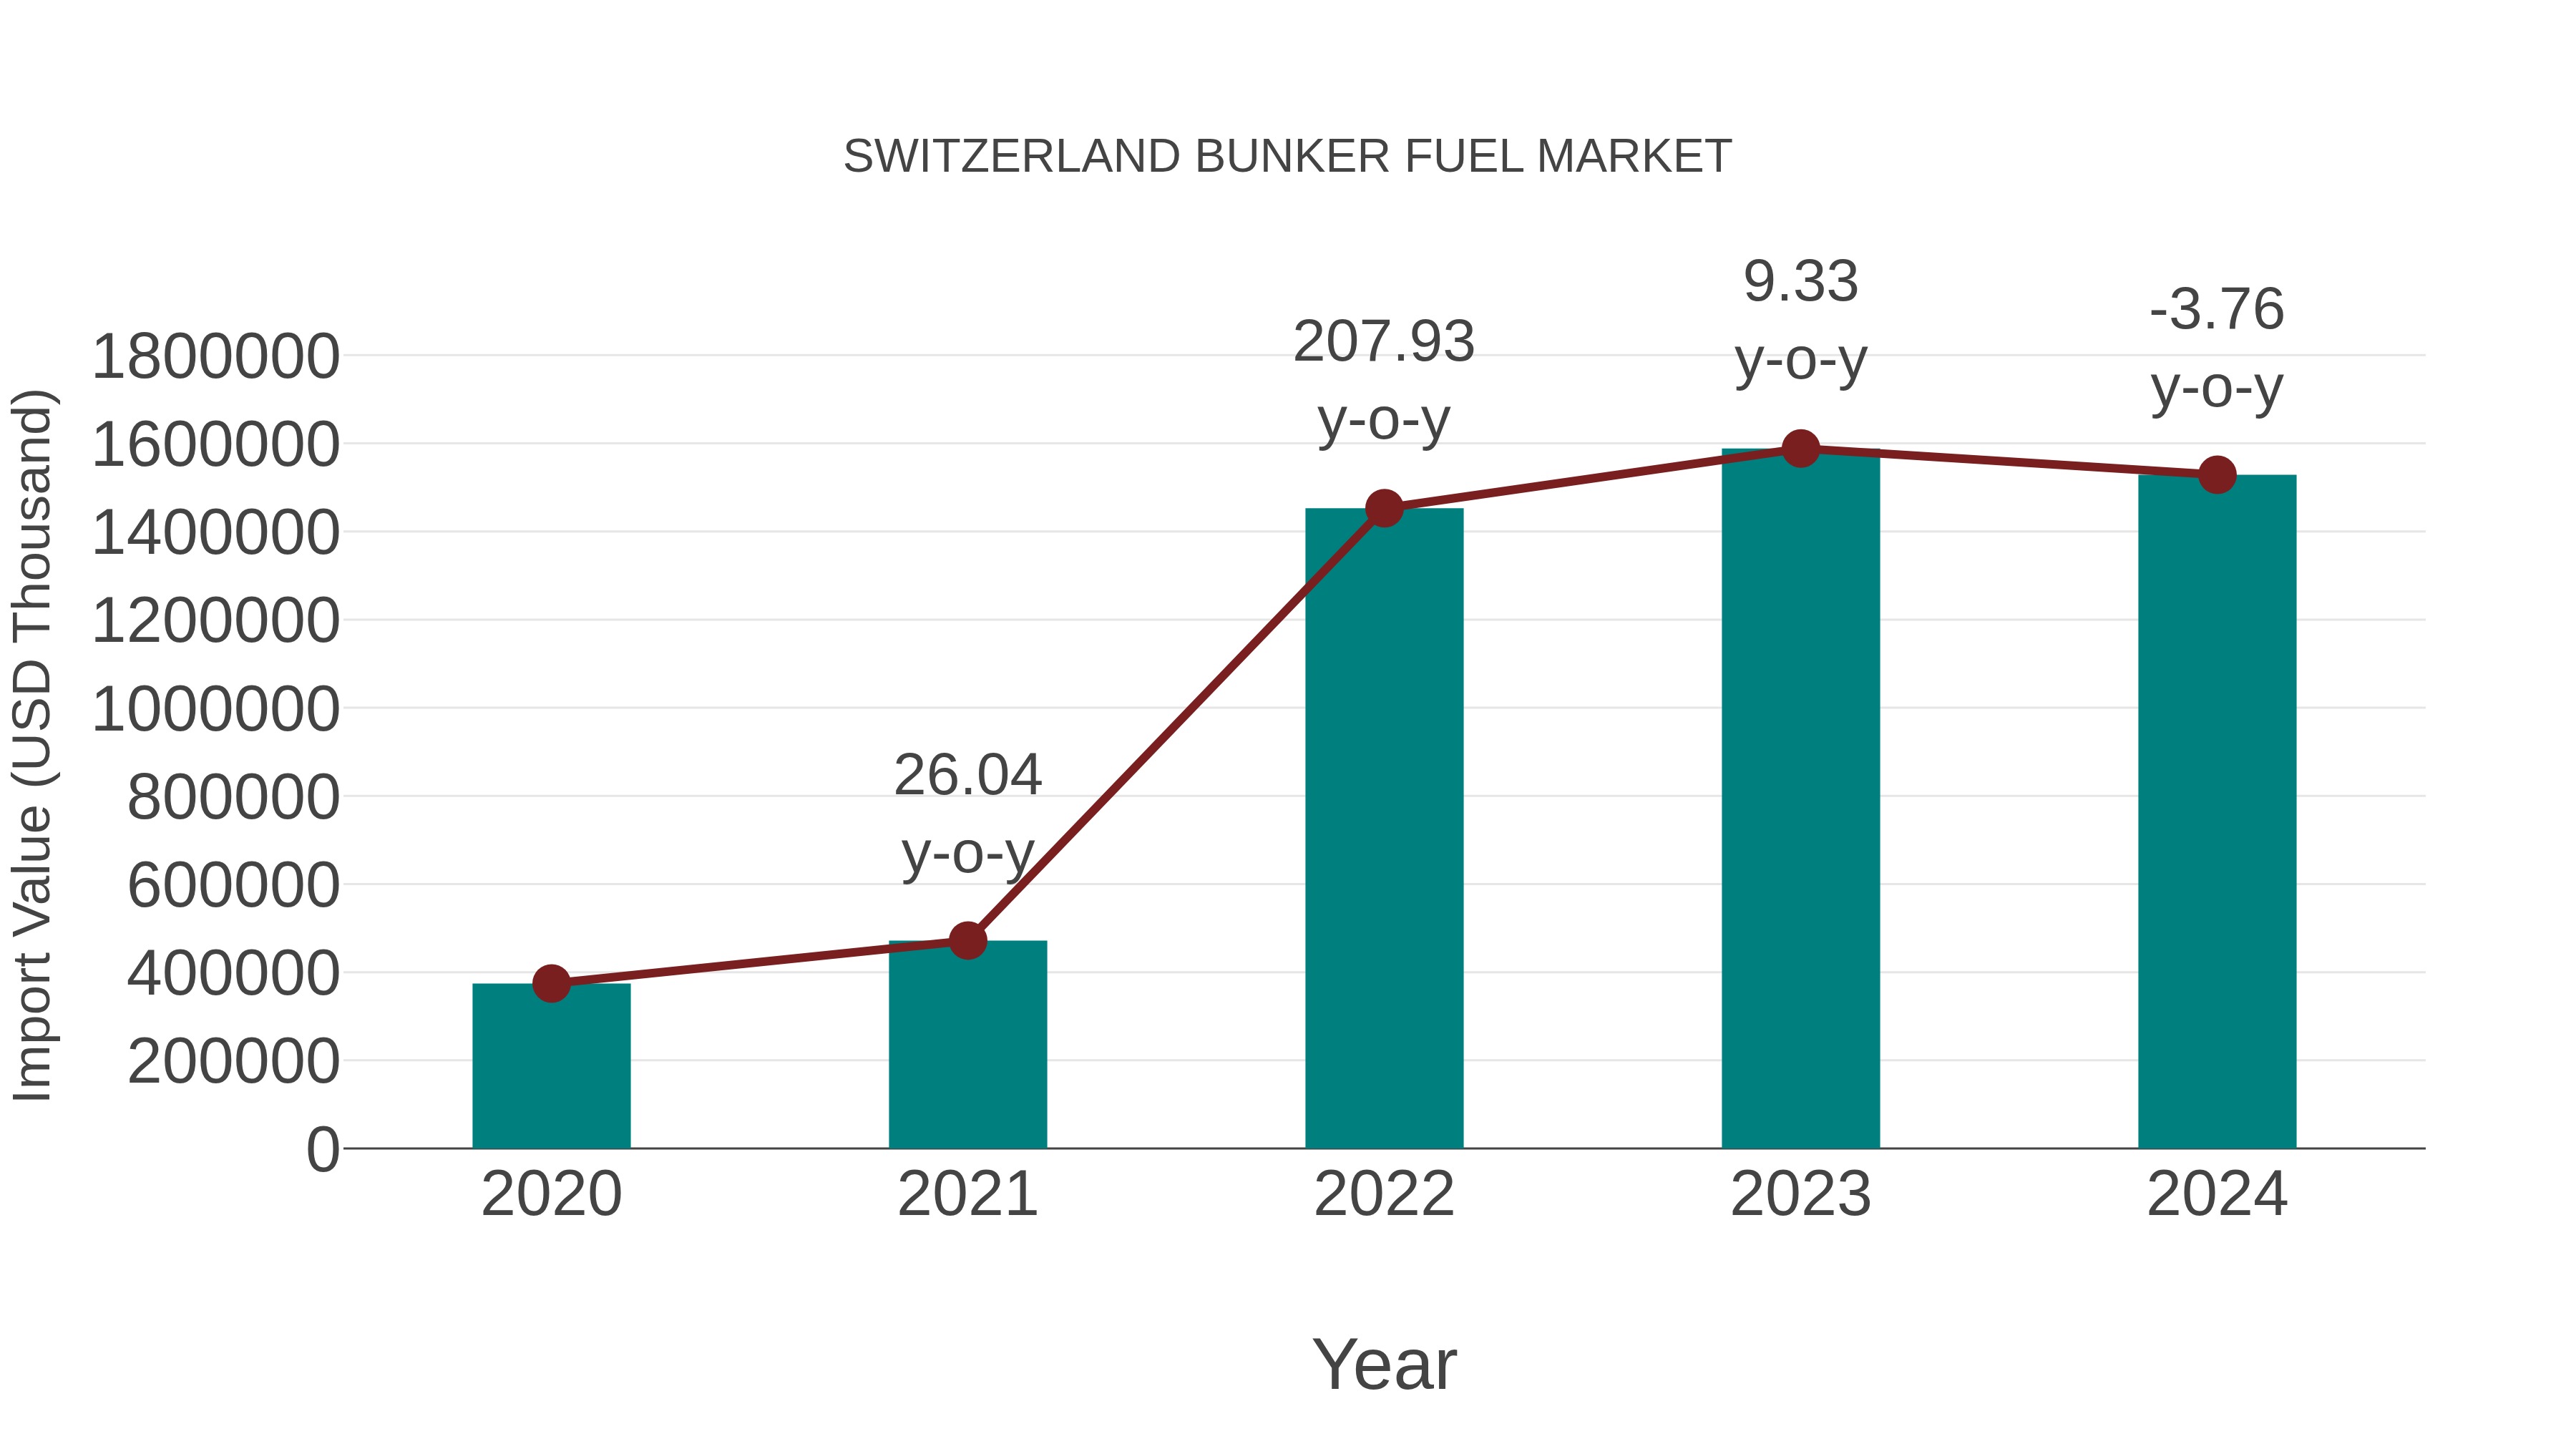
Switzerland Bunker Fuel Market: Import Trend Analysis
Switzerland import trend for bunker fuel experienced a -3.76% growth rate from 2023 to 2024. The compound annual growth rate (CAGR) for 2020-2024 stood at 42.15%. This fluctuation could be attributed to shifts in global energy demands impacting bunker fuel trade dynamics.
Switzerland Bunker Fuel Market Overview
The bunker fuel market in Switzerland is influenced by the country`s strategic position in global shipping and its efforts to transition toward more sustainable energy sources. While traditionally reliant on fossil fuels, the shipping industry is facing increasing pressure to reduce emissions, prompting a gradual shift toward alternative fuels. As a result, there is a growing interest in low-sulfur bunker fuels and other cleaner alternatives that comply with international regulations. Additionally, Switzerland`s commitment to environmental sustainability is driving investments in research and development of green technologies that aim to reduce the ecological impact of maritime activities.
Drivers of the market
The bunker fuel market in Switzerland is driven by the steady demand for maritime transportation and the need for compliant fuel solutions amid tightening environmental regulations. As international shipping standards evolve, ship operators are increasingly investing in cleaner and more efficient bunker fuels to meet emission targets. This transition is further supported by advancements in fuel technology, which are enhancing the performance and sustainability of bunker fuels used in maritime operations.
Challenges of the market
The bunker fuel market in Switzerland faces challenges stemming from increasing environmental regulations aimed at reducing sulfur emissions. These regulations require costly upgrades to fuel production processes and have spurred demand for cleaner alternatives like liquefied natural gas (LNG). Additionally, the fluctuating global oil prices directly impact the profitability of bunker fuel suppliers. The shift towards renewable energy and more efficient shipping technologies also poses a long-term challenge to the market.
Government Policy of the market
Switzerlands bunker fuel market is shaped by environmental regulations, especially concerning greenhouse gas emissions and maritime fuel quality. While Switzerland is landlocked, it is involved in international shipping and follows global standards like the IMO 2020 regulation, which limits sulfur content in marine fuels. The Swiss government also supports the transition to cleaner fuel alternatives, including LNG and biofuels, as part of its broader environmental and climate policies.
Key Highlights of the Report:
- Switzerland Bunker Fuel Market Outlook
- Market Size of Switzerland Bunker Fuel Market, 2025
- Forecast of Switzerland Bunker Fuel Market, 2032
- Historical Data and Forecast of Switzerland Bunker Fuel Revenues & Volume for the Period 2022-2032F
- Switzerland Bunker Fuel Market Trend Evolution
- Switzerland Bunker Fuel Market Drivers and Challenges
- Switzerland Bunker Fuel Price Trends
- Switzerland Bunker Fuel Porter`s Five Forces
- Switzerland Bunker Fuel Industry Life Cycle
- Historical Data and Forecast of Switzerland Bunker Fuel Market Revenues & Volume By Type for the Period 2022-2032F
- Historical Data and Forecast of Switzerland Bunker Fuel Market Revenues & Volume By High Sulfur Fuel Oil for the Period 2022-2032F
- Historical Data and Forecast of Switzerland Bunker Fuel Market Revenues & Volume By Low Sulfur Fuel Oil for the Period 2022-2032F
- Historical Data and Forecast of Switzerland Bunker Fuel Market Revenues & Volume By Marine Gas Oil for the Period 2022-2032F
- Historical Data and Forecast of Switzerland Bunker Fuel Market Revenues & Volume By Others for the Period 2022-2032F
- Historical Data and Forecast of Switzerland Bunker Fuel Market Revenues & Volume By Commerical Distributor for the Period 2022-2032F
- Historical Data and Forecast of Switzerland Bunker Fuel Market Revenues & Volume By Oil Majors for the Period 2022-2032F
- Historical Data and Forecast of Switzerland Bunker Fuel Market Revenues & Volume By Large Independent for the Period 2022-2032F
- Historical Data and Forecast of Switzerland Bunker Fuel Market Revenues & Volume By Small Independent for the Period 2022-2032F
- Switzerland Bunker Fuel Import Export Trade Statistics
- Market Opportunity Assessment By Type
- Market Opportunity Assessment By Commerical Distributor
- Switzerland Bunker Fuel Top Companies Market Share
- Switzerland Bunker Fuel Competitive Benchmarking By Technical and Operational Parameters
- Switzerland Bunker Fuel Company Profiles
- Switzerland Bunker Fuel Key Strategic Recommendations
Switzerland Bunker Fuel Market (2026-2032): FAQs
6Wresearch actively monitors the Switzerland Bunker Fuel Market and publishes its comprehensive annual report, highlighting emerging trends, growth drivers, revenue analysis, and forecast outlook. Our insights help businesses to make data-backed strategic decisions with ongoing market dynamics. Our analysts track relevent industries related to the Switzerland Bunker Fuel Market, allowing our clients with actionable intelligence and reliable forecasts tailored to emerging regional needs.
Yes, we provide customisation as per your requirements. To learn more, feel free to contact us on sales@6wresearch.com
1 Executive Summary |
2 Introduction |
2.1 Key Highlights of the Report |
2.2 Report Description |
2.3 Market Scope & Segmentation |
2.4 Research Methodology |
2.5 Assumptions |
3 Switzerland Bunker Fuel Market Overview |
3.1 Switzerland Country Macro Economic Indicators |
3.2 Switzerland Bunker Fuel Market Revenues & Volume, 2022 & 2032F |
3.3 Switzerland Bunker Fuel Market - Industry Life Cycle |
3.4 Switzerland Bunker Fuel Market - Porter's Five Forces |
3.5 Switzerland Bunker Fuel Market Revenues & Volume Share, By Type, 2022 & 2032F |
3.6 Switzerland Bunker Fuel Market Revenues & Volume Share, By Commerical Distributor, 2022 & 2032F |
4 Switzerland Bunker Fuel Market Dynamics |
4.1 Impact Analysis |
4.2 Market Drivers |
4.2.1 Increasing demand for energy in Switzerland |
4.2.2 Growth in maritime transport activities in the region |
4.2.3 Stringent environmental regulations promoting the use of cleaner bunker fuel options |
4.3 Market Restraints |
4.3.1 Volatility in crude oil prices impacting bunker fuel costs |
4.3.2 Competition from alternative energy sources |
4.3.3 Infrastructure limitations for efficient bunkering operations in Switzerland |
5 Switzerland Bunker Fuel Market Trends |
6 Switzerland Bunker Fuel Market Segmentations |
6.1 Switzerland Bunker Fuel Market, By Type |
6.1.1 Overview and Analysis |
6.1.2 Switzerland Bunker Fuel Market Revenues & Volume, By High Sulfur Fuel Oil, 2022-2032F |
6.1.3 Switzerland Bunker Fuel Market Revenues & Volume, By Low Sulfur Fuel Oil, 2022-2032F |
6.1.4 Switzerland Bunker Fuel Market Revenues & Volume, By Marine Gas Oil, 2022-2032F |
6.1.5 Switzerland Bunker Fuel Market Revenues & Volume, By Others, 2022-2032F |
6.2 Switzerland Bunker Fuel Market, By Commerical Distributor |
6.2.1 Overview and Analysis |
6.2.2 Switzerland Bunker Fuel Market Revenues & Volume, By Oil Majors, 2022-2032F |
6.2.3 Switzerland Bunker Fuel Market Revenues & Volume, By Large Independent, 2022-2032F |
6.2.4 Switzerland Bunker Fuel Market Revenues & Volume, By Small Independent, 2022-2032F |
7 Switzerland Bunker Fuel Market Import-Export Trade Statistics |
7.1 Switzerland Bunker Fuel Market Export to Major Countries |
7.2 Switzerland Bunker Fuel Market Imports from Major Countries |
8 Switzerland Bunker Fuel Market Key Performance Indicators |
8.1 Average sulfur content in bunker fuel consumed in Switzerland |
8.2 Number of vessels using LNG as a bunker fuel in Swiss ports |
8.3 Investment in research and development of sustainable bunker fuel alternatives |
9 Switzerland Bunker Fuel Market - Opportunity Assessment |
9.1 Switzerland Bunker Fuel Market Opportunity Assessment, By Type, 2022 & 2032F |
9.2 Switzerland Bunker Fuel Market Opportunity Assessment, By Commerical Distributor, 2022 & 2032F |
10 Switzerland Bunker Fuel Market - Competitive Landscape |
10.1 Switzerland Bunker Fuel Market Revenue Share, By Companies, 2025 |
10.2 Switzerland Bunker Fuel Market Competitive Benchmarking, By Operating and Technical Parameters |
11 Company Profiles |
12 Recommendations | 13 Disclaimer |
Export potential assessment - trade Analytics for 2030
Export potential enables firms to identify high-growth global markets with greater confidence by combining advanced trade intelligence with a structured quantitative methodology. The framework analyzes emerging demand trends and country-level import patterns while integrating macroeconomic and trade datasets such as GDP and population forecasts, bilateral import–export flows, tariff structures, elasticity differentials between developed and developing economies, geographic distance, and import demand projections. Using weighted trade values from 2020–2024 as the base period to project country-to-country export potential for 2030, these inputs are operationalized through calculated drivers such as gravity model parameters, tariff impact factors, and projected GDP per-capita growth. Through an analysis of hidden potentials, demand hotspots, and market conditions that are most favorable to success, this method enables firms to focus on target countries, maximize returns, and global expansion with data, backed by accuracy.
By factoring in the projected importer demand gap that is currently unmet and could be potential opportunity, it identifies the potential for the Exporter (Country) among 190 countries, against the general trade analysis, which identifies the biggest importer or exporter.
To discover high-growth global markets and optimize your business strategy:
Click Here
Pricing
- Single User License$ 1,995
- Department License$ 2,400
- Site License$ 3,120
- Global License$ 3,795

Search
Thought Leadership and Analyst Meet


Our Clients
Latest Reports
- United Kingdom (UK) Long-term Care Insurance Market (2026-2032) | Growth, Share, Consumer Insights, Drivers, Opportunities, Competition, Pricing Analysis, Segments, Restraints, Companies, Competitive, Value, Outlook, Size, Demand, Analysis, Challenges, Strategic Insights, Investment Trends, Revenue, Trends, Supply, Forecast
- United Kingdom (UK) Long Term Care Market (2026-2032) | Companies, Outlook, Analysis, Trends, Value, Revenue, Segmentation, Share, Forecast, Competitive Landscape, Growth, Size & Forecast
- Iraq Insulation and Waterproofing Market (2026-2032) | Outlook, Drivers, Growth, Size, Share, Industry, Revenue, Trends, Demand, Competitive, Strategic Insights, Opportunities, Segments, Companies, Challenges, Strategy, Consumer Insights, Analysis, Investment Trends, Value, Segmentation, Forecast, Restraints
- India Switchgear Market Outlook (2026-2032) | Size, Share, Trends, Growth, Revenue, Forecast, Analysis, Value, Outlook
- Pakistan Contraceptive Implants Market (2025-2031) | Demand, Growth, Size, Share, Industry, Pricing Analysis, Competitive, Strategic Insights, Strategy, Consumer Insights, Analysis, Investment Trends, Opportunities, Revenue, Segments, Value, Segmentation, Supply, Forecast, Restraints, Outlook, Competition, Drivers, Trends, Companies, Challenges
- Sri Lanka Packaging Market (2026-2032) | Outlook, Competition, Drivers, Trends, Demand, Pricing Analysis, Competitive, Strategic Insights, Companies, Challenges, Strategy, Consumer Insights, Analysis, Investment Trends, Opportunities, Growth, Size, Share, Industry, Revenue, Segments, Value, Segmentation, Supply, Forecast, Restraints
- India Kids Watches Market (2026-2032) | Strategy, Consumer Insights, Analysis, Investment Trends, Opportunities, Growth, Size, Share, Industry, Revenue, Segments, Value, Segmentation, Supply, Forecast, Restraints, Outlook, Competition, Drivers, Trends, Demand, Pricing Analysis, Competitive, Strategic Insights, Companies, Challenges
- Saudi Arabia Core Assurance Service Market (2025-2031) | Strategy, Consumer Insights, Analysis, Investment Trends, Opportunities, Growth, Size, Share, Industry, Revenue, Segments, Value, Segmentation, Supply, Forecast, Restraints, Outlook, Competition, Drivers, Trends, Demand, Pricing Analysis, Competitive, Strategic Insights, Companies, Challenges
- Romania Uninterruptible Power Supply (UPS) Market (2026-2032) | Industry, Analysis, Revenue, Size, Forecast, Outlook, Value, Trends, Share, Growth & Companies
- Saudi Arabia Car Window Tinting Film, Paint Protection Film (PPF), and Ceramic Coating Market (2025-2031) | Strategy, Consumer Insights, Analysis, Investment Trends, Opportunities, Growth, Size, Share, Industry, Revenue, Segments, Value, Segmentation, Supply, Forecast, Restraints, Outlook, Competition, Drivers, Trends, Demand, Pricing Analysis, Competitive, Strategic Insights, Companies, Challenges
Industry Events and Analyst Meet

India EV Show 2026

EV tech India Expo 2026

Auto Tech Asia 2026

Battery Tech India 2026

Smart Production Solutions Guangzhou 2026
Whitepaper
- Middle East & Africa Commercial Security Market Click here to view more.
- Middle East & Africa Fire Safety Systems & Equipment Market Click here to view more.
- GCC Drone Market Click here to view more.
- Middle East Lighting Fixture Market Click here to view more.
- GCC Physical & Perimeter Security Market Click here to view more.
6WResearch In News
- Doha a strategic location for EV manufacturing hub: IPA Qatar
- Demand for luxury TVs surging in the GCC, says Samsung
- Empowering Growth: The Thriving Journey of Bangladesh’s Cable Industry
- Demand for luxury TVs surging in the GCC, says Samsung
- Video call with a traditional healer? Once unthinkable, it’s now common in South Africa
- Intelligent Buildings To Smooth GCC’s Path To Net Zero