Switzerland Lactose Market (2026-2032) | Segmentation, Forecast, Size, Analysis, Companies, Industry, Outlook, Trends, Revenue, Growth, Share & Value
Market Forecast By Form (Powder, Granule), By Application (Food and Beverages, Confectionery, Animal Feed, Pharmaceutical, Cosmetics, Others) And Competitive Landscape
| Product Code: ETC4698201 | Publication Date: Nov 2023 | Updated Date: Mar 2026 | Product Type: Market Research Report | |
| Publisher: 6Wresearch | Author: Shubham Deep | No. of Pages: 60 | No. of Figures: 30 | No. of Tables: 5 |
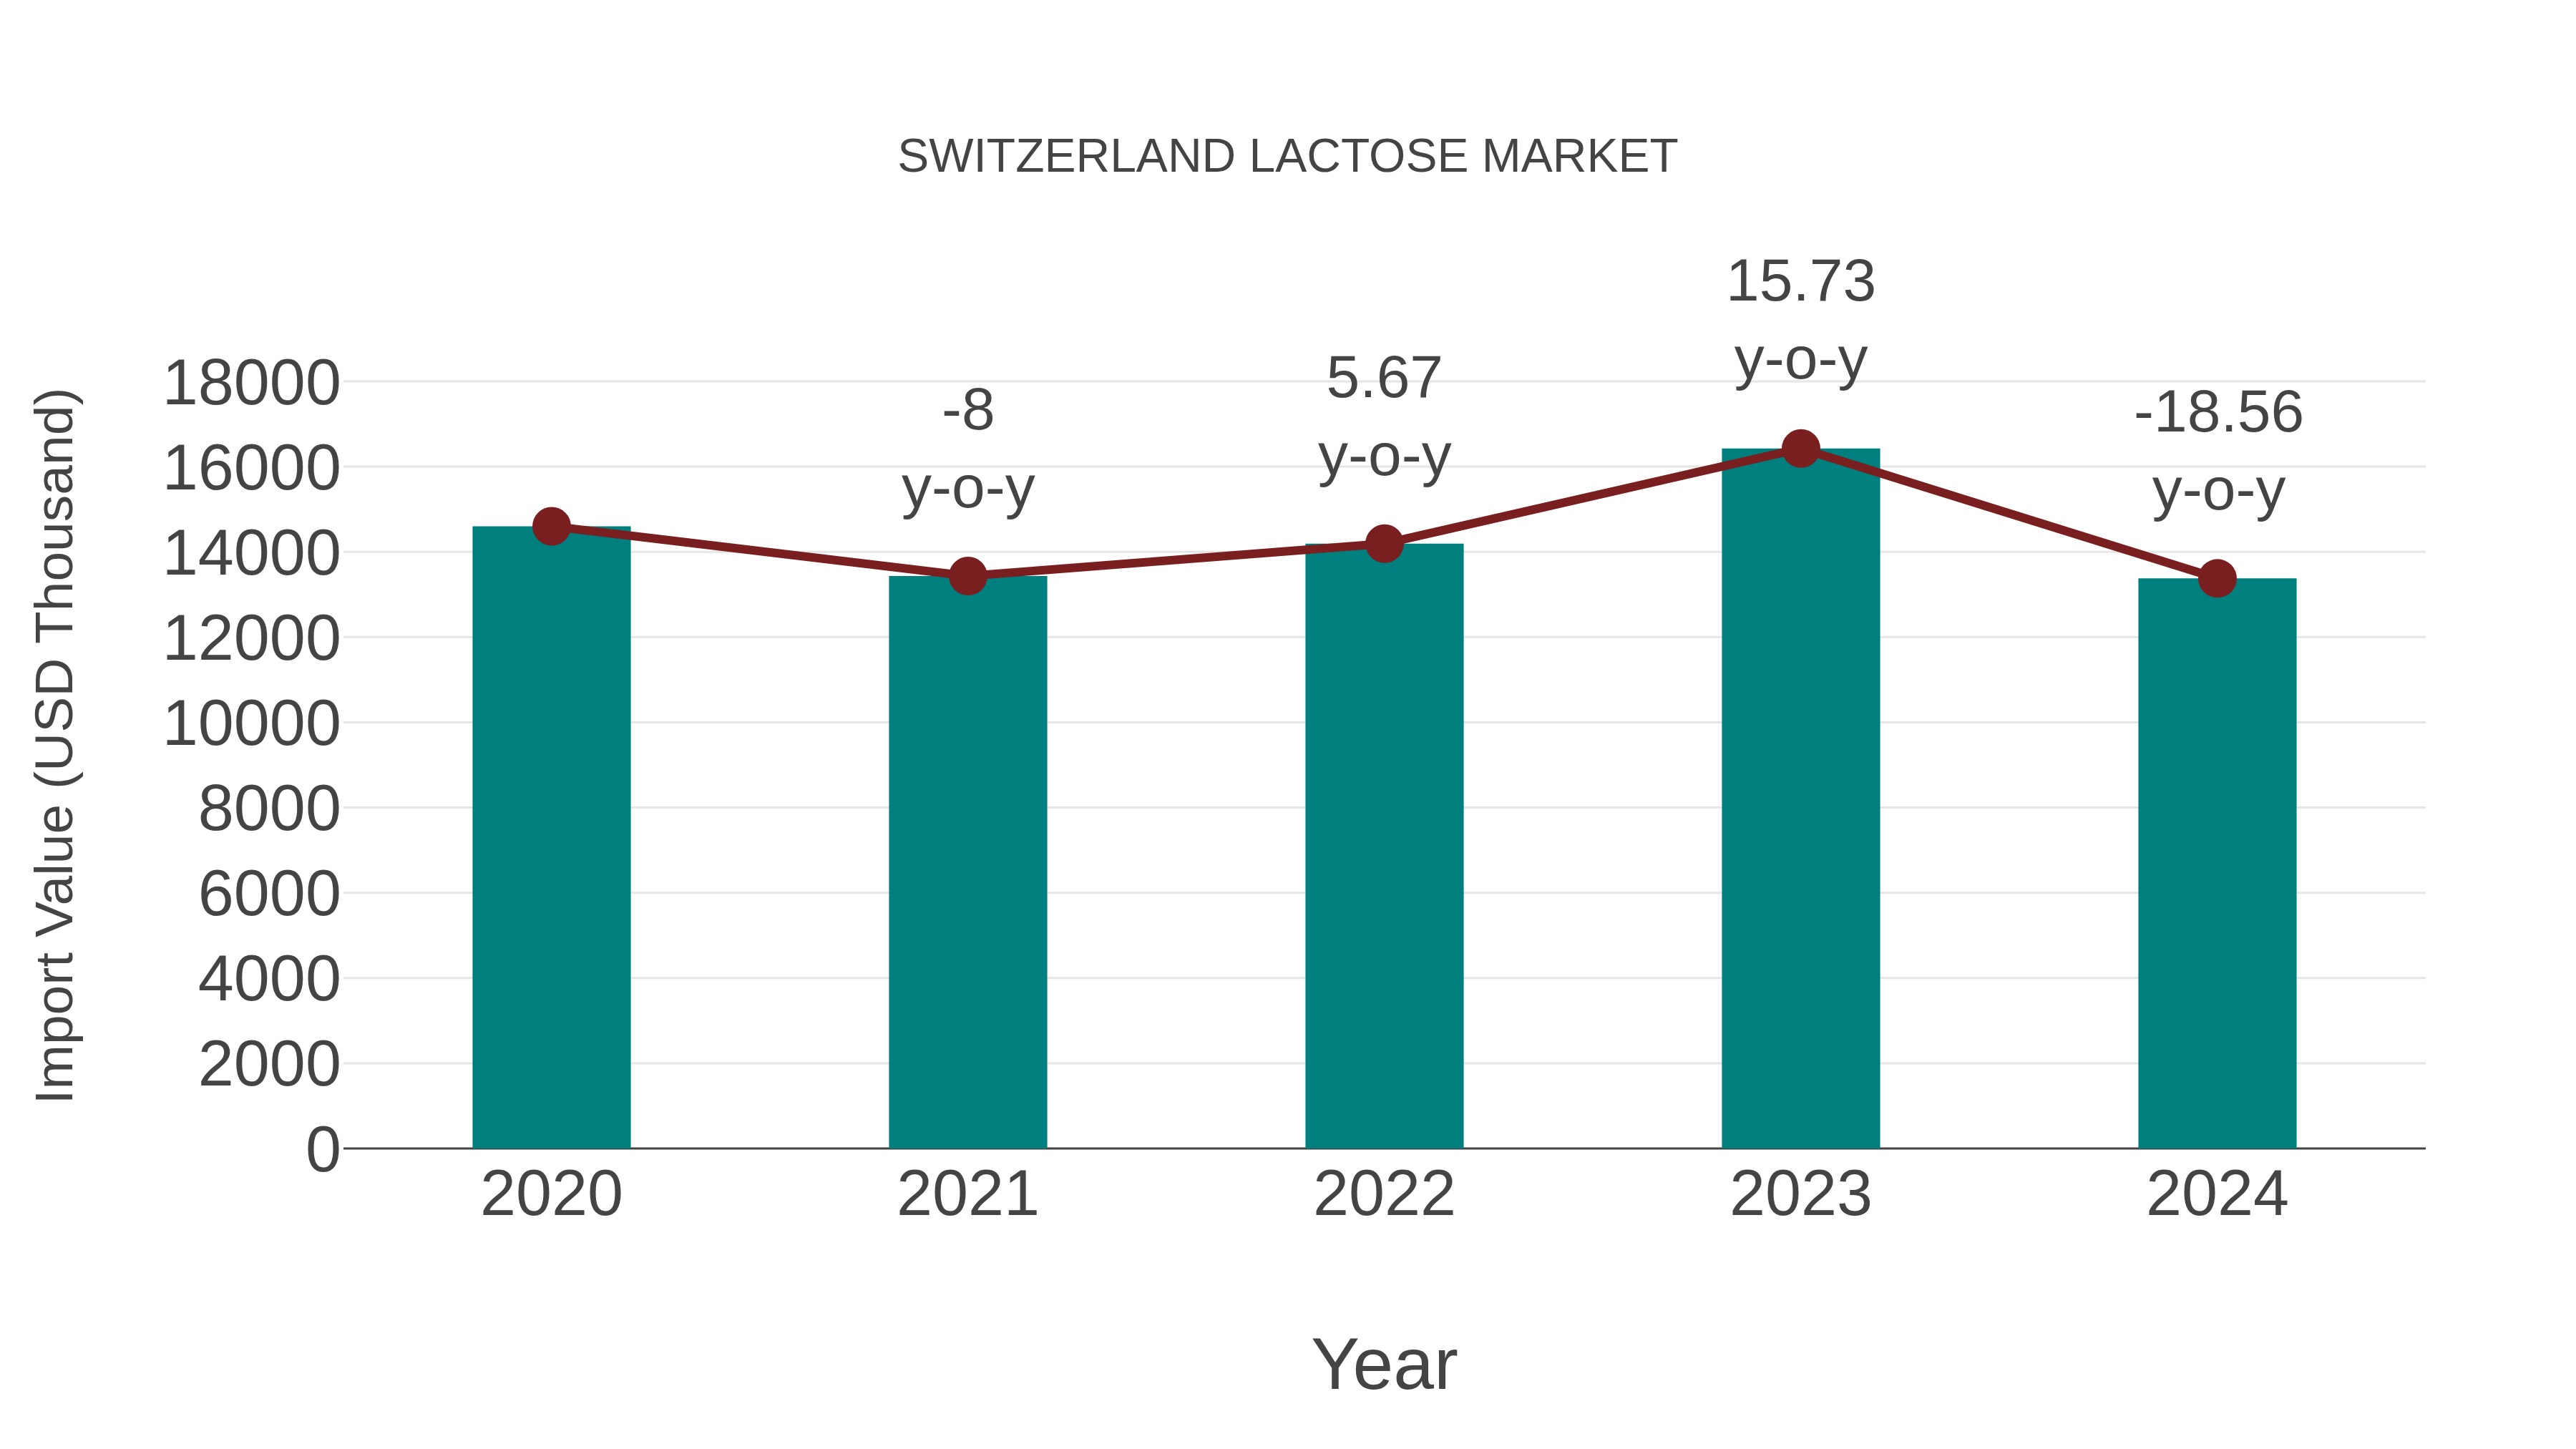
Switzerland Lactose Market: Import Trend Analysis
Switzerland import trend for the lactose market showed a decline, with a growth rate of -18.56% from 2023 to 2024. The compound annual growth rate (CAGR) for 2020-2024 was -2.16%. This decrease could be attributed to shifts in consumer preferences towards lactose-free alternatives.
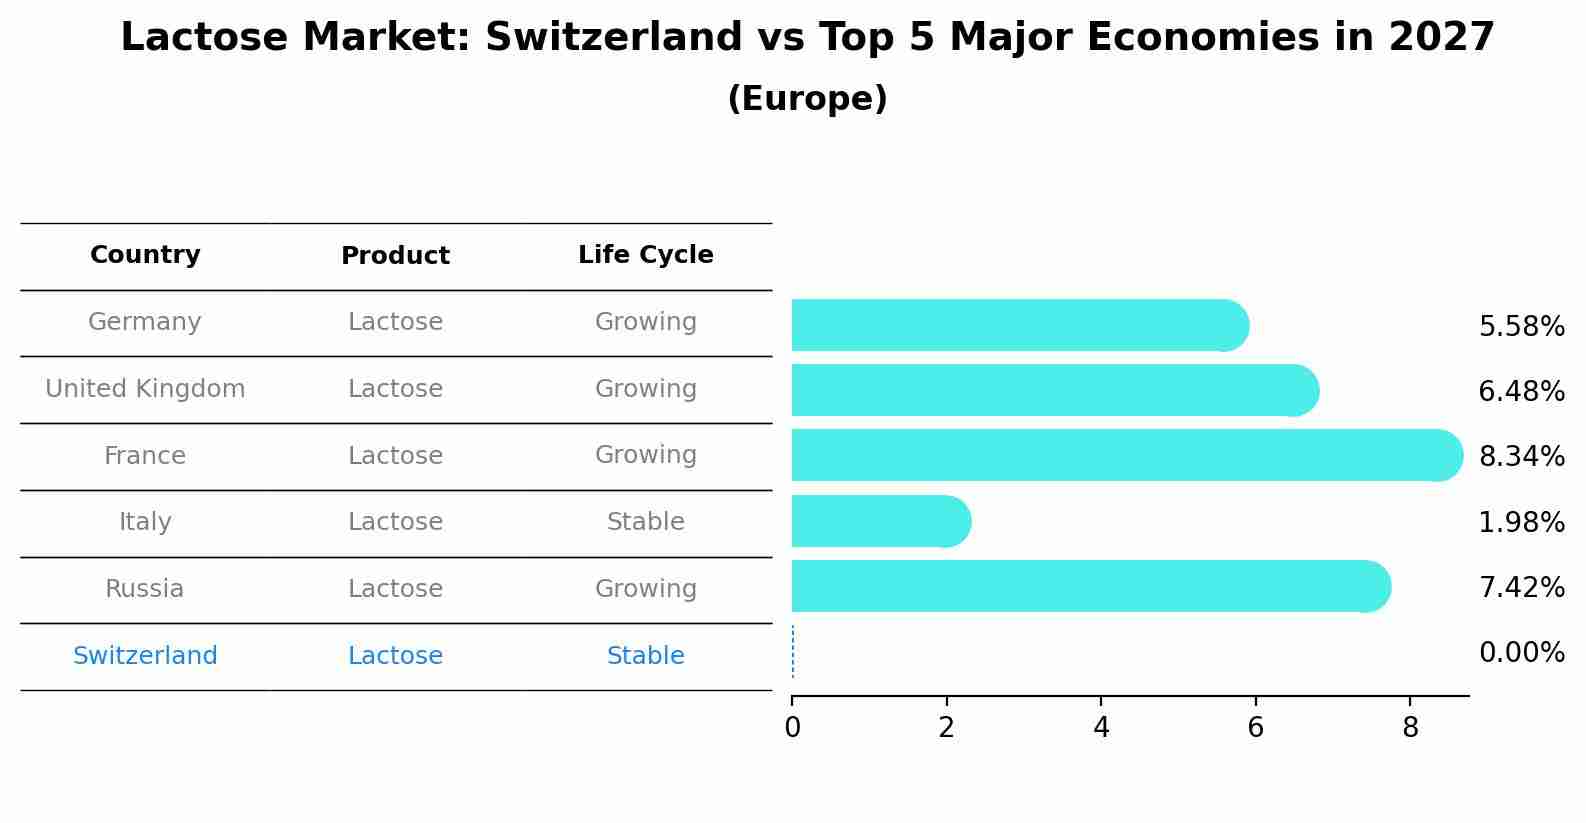
Lactose Market: Switzerland vs Top 5 Major Economies in 2027 (Europe)
In the Europe region, the Lactose market in Switzerland is projected to expand at a stable growth rate of 0.00% by 2027. The largest economy is Germany, followed by United Kingdom, France, Italy and Russia.
Switzerland Lactose Market Overview
The lactose market in Switzerland is primarily driven by its use in the food and pharmaceutical industries. Lactose is a common ingredient in dairy products, nutritional supplements, and as a filler in medications. However, the rising prevalence of lactose intolerance is influencing market dynamics, leading to an increased demand for lactose-free products. This trend presents both challenges and opportunities for manufacturers as they adapt their offerings to meet changing consumer preferences.
Drivers of the market
The lactose market in Switzerland is primarily driven by its widespread use in the food and pharmaceutical industries. Lactose serves as a sweetener and filler in various food products and is also utilized in the production of pharmaceuticals and nutraceuticals. The growing trend of functional foods and the increasing demand for dairy products contribute significantly to the lactose market`s expansion.
Challenges of the market
The lactose market is impacted by changing consumer preferences towards dairy-free and plant-based alternatives. As more consumers adopt lactose-free diets, traditional lactose products may experience declining demand. This shift presents challenges for producers who must diversify their product lines to cater to evolving market needs. Additionally, the market is affected by fluctuating prices of raw materials, such as milk, which can impact profit margins. Regulatory challenges related to food labeling and health claims further complicate marketing strategies.
Government Policy of the market
Lactose production and distribution in Switzerland are regulated to ensure product quality and safety. The government sets guidelines for lactose processing to prevent contamination and promote good manufacturing practices. Additionally, policies are in place to support the dairy industry, encouraging sustainable practices in lactose production. Research initiatives funded by the government aim to develop new lactose-based products and enhance processing techniques.
Key Highlights of the Report:
- Switzerland Lactose Market Outlook
- Market Size of Switzerland Lactose Market, 2025
- Forecast of Switzerland Lactose Market, 2032
- Historical Data and Forecast of Switzerland Lactose Revenues & Volume for the Period 2022-2032F
- Switzerland Lactose Market Trend Evolution
- Switzerland Lactose Market Drivers and Challenges
- Switzerland Lactose Price Trends
- Switzerland Lactose Porter`s Five Forces
- Switzerland Lactose Industry Life Cycle
- Historical Data and Forecast of Switzerland Lactose Market Revenues & Volume By Form for the Period 2022-2032F
- Historical Data and Forecast of Switzerland Lactose Market Revenues & Volume By Powder for the Period 2022-2032F
- Historical Data and Forecast of Switzerland Lactose Market Revenues & Volume By Granule for the Period 2022-2032F
- Historical Data and Forecast of Switzerland Lactose Market Revenues & Volume By Application for the Period 2022-2032F
- Historical Data and Forecast of Switzerland Lactose Market Revenues & Volume By Food and Beverages for the Period 2022-2032F
- Historical Data and Forecast of Switzerland Lactose Market Revenues & Volume By Confectionery for the Period 2022-2032F
- Historical Data and Forecast of Switzerland Lactose Market Revenues & Volume By Animal Feed for the Period 2022-2032F
- Historical Data and Forecast of Switzerland Lactose Market Revenues & Volume By Pharmaceutical for the Period 2022-2032F
- Historical Data and Forecast of Switzerland Lactose Market Revenues & Volume By Cosmeticsfor the Period 2022-2032F
- Historical Data and Forecast of Switzerland Lactose Market Revenues & Volume By Others for the Period 2022-2032F
- Switzerland Lactose Import Export Trade Statistics
- Market Opportunity Assessment By Form
- Market Opportunity Assessment By Application
- Switzerland Lactose Top Companies Market Share
- Switzerland Lactose Competitive Benchmarking By Technical and Operational Parameters
- Switzerland Lactose Company Profiles
- Switzerland Lactose Key Strategic Recommendations
Switzerland Lactose Market (2026-2032): FAQs
6Wresearch actively monitors the Switzerland Lactose Market and publishes its comprehensive annual report, highlighting emerging trends, growth drivers, revenue analysis, and forecast outlook. Our insights help businesses to make data-backed strategic decisions with ongoing market dynamics. Our analysts track relevent industries related to the Switzerland Lactose Market, allowing our clients with actionable intelligence and reliable forecasts tailored to emerging regional needs.
Yes, we provide customisation as per your requirements. To learn more, feel free to contact us on sales@6wresearch.com
1 Executive Summary |
2 Introduction |
2.1 Key Highlights of the Report |
2.2 Report Description |
2.3 Market Scope & Segmentation |
2.4 Research Methodology |
2.5 Assumptions |
3 Switzerland Lactose Market Overview |
3.1 Switzerland Country Macro Economic Indicators |
3.2 Switzerland Lactose Market Revenues & Volume, 2022 & 2032F |
3.3 Switzerland Lactose Market - Industry Life Cycle |
3.4 Switzerland Lactose Market - Porter's Five Forces |
3.5 Switzerland Lactose Market Revenues & Volume Share, By Form, 2022 & 2032F |
3.6 Switzerland Lactose Market Revenues & Volume Share, By Application, 2022 & 2032F |
4 Switzerland Lactose Market Dynamics |
4.1 Impact Analysis |
4.2 Market Drivers |
4.2.1 Increasing awareness about lactose intolerance and related health issues |
4.2.2 Growing demand for lactose-free products in the food and beverage industry |
4.2.3 Rising consumer preference for clean label and natural products |
4.3 Market Restraints |
4.3.1 High cost of lactose-free products compared to conventional products |
4.3.2 Limited availability of lactose-free options in certain regions or stores |
4.3.3 Challenges in taste and texture of lactose-free products compared to traditional products |
5 Switzerland Lactose Market Trends |
6 Switzerland Lactose Market Segmentations |
6.1 Switzerland Lactose Market, By Form |
6.1.1 Overview and Analysis |
6.1.2 Switzerland Lactose Market Revenues & Volume, By Powder, 2022-2032F |
6.1.3 Switzerland Lactose Market Revenues & Volume, By Granule, 2022-2032F |
6.2 Switzerland Lactose Market, By Application |
6.2.1 Overview and Analysis |
6.2.2 Switzerland Lactose Market Revenues & Volume, By Food and Beverages, 2022-2032F |
6.2.3 Switzerland Lactose Market Revenues & Volume, By Confectionery, 2022-2032F |
6.2.4 Switzerland Lactose Market Revenues & Volume, By Animal Feed, 2022-2032F |
6.2.5 Switzerland Lactose Market Revenues & Volume, By Pharmaceutical, 2022-2032F |
6.2.6 Switzerland Lactose Market Revenues & Volume, By Cosmetics? , 2022-2032F |
6.2.7 Switzerland Lactose Market Revenues & Volume, By Others, 2022-2032F |
7 Switzerland Lactose Market Import-Export Trade Statistics |
7.1 Switzerland Lactose Market Export to Major Countries |
7.2 Switzerland Lactose Market Imports from Major Countries |
8 Switzerland Lactose Market Key Performance Indicators |
8.1 Percentage increase in sales of lactose-free products |
8.2 Number of new product launches in the lactose-free segment |
8.3 Consumer satisfaction ratings for lactose-free products |
8.4 Number of lactose intolerance diagnoses in Switzerland |
8.5 Percentage of households buying lactose-free products |
9 Switzerland Lactose Market - Opportunity Assessment |
9.1 Switzerland Lactose Market Opportunity Assessment, By Form, 2022 & 2032F |
9.2 Switzerland Lactose Market Opportunity Assessment, By Application, 2022 & 2032F |
10 Switzerland Lactose Market - Competitive Landscape |
10.1 Switzerland Lactose Market Revenue Share, By Companies, 2025 |
10.2 Switzerland Lactose Market Competitive Benchmarking, By Operating and Technical Parameters |
11 Company Profiles |
12 Recommendations | 13 Disclaimer |
Global Go To Market Strategy - 2030
Export potential enables firms to identify high-growth global markets with greater confidence by combining advanced trade intelligence with a structured quantitative methodology. The framework analyzes emerging demand trends and country-level import patterns while integrating macroeconomic and trade datasets such as GDP and population forecasts, bilateral import–export flows, tariff structures, elasticity differentials between developed and developing economies, geographic distance, and import demand projections. Using weighted trade values from 2020–2024 as the base period to project country-to-country export potential for 2030, these inputs are operationalized through calculated drivers such as gravity model parameters, tariff impact factors, and projected GDP per-capita growth. Through an analysis of hidden potentials, demand hotspots, and market conditions that are most favorable to success, this method enables firms to focus on target countries, maximize returns, and global expansion with data, backed by accuracy.
By factoring in the projected importer demand gap that is currently unmet and could be potential opportunity, it identifies the potential for the Exporter (Country) among 190 countries, against the general trade analysis, which identifies the biggest importer or exporter.
To discover high-growth global markets and optimize your business strategy:
Click Here
Pricing
- Single User License$ 1,995
- Department License$ 2,400
- Site License$ 3,120
- Global License$ 3,795

Leadership Perspectives from Industry Events
Search
Thought Leadership and Analyst Meet


Our Clients
6WResearch In News
- Doha a strategic location for EV manufacturing hub: IPA Qatar
- Demand for luxury TVs surging in the GCC, says Samsung
- Empowering Growth: The Thriving Journey of Bangladesh’s Cable Industry
- Demand for luxury TVs surging in the GCC, says Samsung
- Video call with a traditional healer? Once unthinkable, it’s now common in South Africa
- Intelligent Buildings To Smooth GCC’s Path To Net Zero
Latest Reports
- Taiwan Airport Wireless Infrastructure Market (2026-2032)
- Vietnam Airport Wireless Infrastructure Market (2026-2032)
- Thailand Airport Wireless Infrastructure Market (2026-2032)
- South Korea Airport Wireless Infrastructure Market (2026-2032)
- Romania Airport Wireless Infrastructure Market (2026-2032)
- Qatar Airport Wireless Infrastructure Market (2026-2032)
- Philippines Airport Wireless Infrastructure Market (2026-2032)
- Japan Airport Wireless Infrastructure Market (2026-2032)
- Taiwan Airport Winter Services Market (2026-2032)
- Vietnam Airport Winter Services Market (2026-2032)
Industry Events and Analyst Meet

HIMTEX 2026

India Refining Summit 2026

India EV Show 2026

EV tech India Expo 2026

Auto Tech Asia 2026
Whitepaper
- Middle East & Africa Commercial Security Market Click here to view more.
- Middle East & Africa Fire Safety Systems & Equipment Market Click here to view more.
- GCC Drone Market Click here to view more.
- Middle East Lighting Fixture Market Click here to view more.
- GCC Physical & Perimeter Security Market Click here to view more.