Taiwan Aqua Inputs and Supplements Market (2026-2032) | Size & Revenue, Outlook, Industry, Trends, Analysis, Competitive Landscape, Companies, Forecast, Share, Value, Segmentation, Growth
Market Forecast By End-Use (Feed and Disease Management, Water Management, Soil Management), By Product Type (Probiotics, Vitamins and Mineral Supplement, Growth Promoter, Disinfectant, Oxygen Enhancer, Zeolite, Immunostimulant) And Competitive Landscape
| Product Code: ETC9621855 | Publication Date: Sep 2024 | Updated Date: Jun 2026 | Product Type: Market Research Report | |
| Publisher: 6Wresearch | Author: Sumit Sagar | No. of Pages: 70 | No. of Figures: 35 | No. of Tables: 5 |
Taiwan Aqua Inputs and Supplements Market Growth Rate
According to 6Wresearch internal database and industry insights, the Taiwan Aqua Inputs and Supplements Market is expected to grow at a compound annual growth rate (CAGR) of 7.9% during the forecast period (2026–2032).
Five-Year Growth Trajectory of Taiwan Aqua Inputs and Supplements Market with Core.
Table below highlights the year-wise growth rate of Taiwan Aqua Inputs and Supplements Market the with key drivers: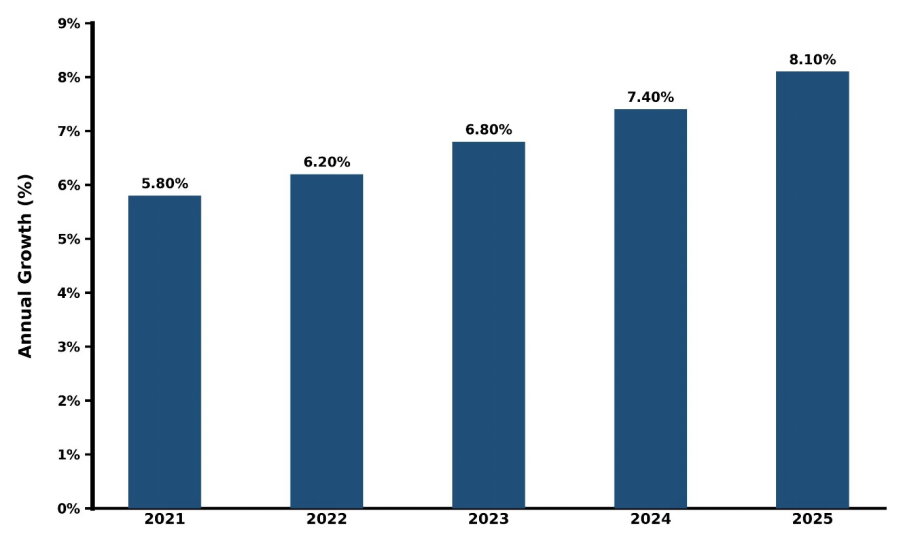
Below is an evaluation of year-wise growth rate along with growth drivers:
| Years | Est. Annual Growth (%) | Growth Drivers |
| 2021 | 5.8% | Recovery in aquaculture production and stable seafood demand from domestic consumption. |
| 2022 | 6.2% | Rising adoption of improved feed formulations and water quality management solutions. |
| 2023 | 6.8% | Expansion of shrimp and fish farming operations and increasing export-oriented aquaculture. |
| 2024 | 7.4% | Growing use of probiotics, enzymes, and functional feed additives to improve yield efficiency. |
| 2025 | 8.1% | Government-backed sustainable aquaculture initiatives and modernization of fish farming systems. |
Topics Covered in the Taiwan Aqua Inputs and Supplements Market Report
The Taiwan Aqua Inputs and Supplements Market report primarily covers segmentation by product type, and end use. The report also evaluates emerging technologies in aquaculture nutrition, disease management solutions, and sustainable water treatment systems.
Taiwan Aqua Inputs and Supplements Market Highlights
| Report Name | Taiwan Aqua Inputs and Supplements Market |
| Forecast period | 2026-2032 |
| CAGR | 7.9% |
| Growing Sector | Aquaculture & Fisheries |
Taiwan Aqua Inputs and Supplements Market Synopsis
The Taiwan Aqua Inputs and Supplements Market is going to grow during the forecast period due to sustainable aquaculture practices, rising seafood consumption, export-driven aquaculture production, and advancements in aquatic nutrition(that includes probiotics, feed enzymes, and immunity-enhancing additives). Inclusion of biotechnology, precision aquaculture systems, and improved water quality monitoring solutions contribute to increase in farm productivity, reduce mortality rates, and thus it will enhance overall yield efficiency across aquaculture operations in Taiwan.
Evaluation of Growth Drivers in Taiwan Aqua Inputs and Supplements Market (2026–2032)
Below are some major drivers and their influence on the market dynamics:
| Drivers | Primary Segment Affected | Why It Matters (Evidence) |
| Expansion of Aquaculture Industry | Fish & Shrimp Farming | Increasing seafood demand and export-oriented production boosts input consumption. |
| Adoption of Functional Feed Additives | Aqua Nutrition | Probiotics, enzymes, and amino acids improve growth rate and disease resistance. |
| Sustainable Farming Practices | Environmental Management | Focus on reducing antibiotic use and improving water quality drives supplement demand. |
| Technological Advancements | Smart Aquaculture | IoT-based monitoring and precision feeding systems enhance efficiency. |
| Government Support & Regulations | Fisheries Sector | Policies promoting sustainable aquaculture and food safety standards accelerate adoption. |
The Taiwan Aqua Inputs and Supplements Market is supposedly grow at 7.9% CAGR (2026–2032). Rising demand for seafood, expansion of aquaculture production (particularly fish and shrimp farming), growing adoption of functional feed additives such as probiotics, vitamins, and immunostimulants (improve productivity and diseases resistance) is driving the Taiwan Aqua Inputs and Supplements Industry growth. By focusing more on sustainable aquaculture practices, strict food safety regulations, and reduction on use of antibiotic will support organic market expansion.
Evaluation of Restraints in Taiwan Aqua Inputs and Supplements Market
Below are some major restraints and their influence on the market dynamics:
| Restraints | Primary Segment Affected | What This Means (Evidence) |
| High Cost of Advanced Inputs | Small-Scale Fish Farmers | Premium feed additives and supplements may limit adoption among smaller farms. |
| Disease Uprising Risks | Aquaculture Production | Sudden outbreaks can disrupt production cycles and reduce consumption stability. |
| Environmental Regulations | Feed & Chemical Inputs | Strict environmental compliance can restrict certain chemical-based supplements. |
| Confined Technical Awareness | Rural Aquaculture Farms | Lack of training in modern aquaculture techniques slows adoption of advanced inputs. |
| Reliance on Supply Chain | Import-Dependent Inputs | Dependency on imported feed ingredients can create price fluctuations. |
Taiwan Aqua Inputs and Supplements Market Challenges
In spite of growth in industry, Taiwan Aqua Inputs and Supplements Market face several challenges such as high reliance on imported raw materials, changing feed ingredient prices, disease outbreaks in aquaculture farms, and increasing environmental compliance pressures. Increasing cost of advanced feed additives, probiotics, and water treatment solutions is restricting small and medium farmers to adopt. Also, confined technical advancements in modern aquaculture system making it difficult to tackle already existed problems.
Taiwan Aqua Inputs and Supplements Market Trends
Listed below are some of the major trends in the Taiwan Aqua Inputs and Supplements Market:
- Shift Toward Functional Feed Additives: Adoption of probiotics, enzymes, and immunity boosters is improving fish health by increasing diseases resistance.
- Expansion of Sustainable Aquaculture Practices: Environmental awareness leads to better water quality by restricting antibiotic use.
- Growth in Export-Oriented Aquaculture: Farmers are adopting high quality feed inputs to meet the international safety standards.
- Rise of Bio-Based and Organic Inputs: Organic seafood production leads to increase the demand for bio-based supplements.
Investment Opportunities in the Taiwan Aqua Inputs and Supplements Market
Given below are key investment opportunities in the Taiwan Aqua Inputs and Supplements Market:
- Functional Feed Additives & Nutrition Solutions: Growing demand for high-yield aquaculture production is paving way for investment in probiotics and enzymes.
- Sustainable Aquaculture Inputs: Taiwan’s sustainable aquaculture sector encourage funding in eco-friendly alternatives such as bio-based supplements.
- Smart Aquaculture Integration: IoT- enabled monitoring systems with real-time farm management will increase efficiency in aqua production.
- Aquaculture Health Management Solutions: Diseases prevention supplements such as vaccines, immune-boosting supplements will engage more employment in this sector.
Top 5 Leading Players in Taiwan Aqua Inputs and Supplements Market
Stated below are some of the leading companies holding significant share in the Taiwan Aqua Inputs and Supplements Market:
1. Cargill, Incorporated
| Company Name | Cargill, Incorporated |
|---|---|
| Established Year | 1865 |
| Headquarters | Minneapolis, Minnesota, USA |
| Website | Click Here |
Cargill Inc. is a global leader in aquatic feed additives and nutrition solutions, with a strong presence in Taiwan.
2. Grobest Group
| Company Name | Grobest Group |
|---|---|
| Established Year | 1974 |
| Headquarters | Taiwan |
| Website | Click Here |
Grobest Group is a leading Taiwan-based aquaculture nutrition company specializing in functional aquafeed and advanced feed solutions.
3. Uni-President Enterprises Corp.
| Company Name | Uni-President Enterprises Corp. |
|---|---|
| Established Year | 1967 |
| Headquarters | Tainan, Taiwan |
| Website | Click Here |
Uni-President Enterprises Corp. is a dominant Taiwanese company with a strong presence in aquatic feed and nutrient inputs.
4. Charoen Pokphand Foods
| Company Name | Charoen Pokphand Foods |
|---|---|
| Established Year | 1978 |
| Headquarters | Bangkok, Thailand |
| Website | Click Here |
Charoen Pokphand Foods (CP Taiwan) is a key supplier of advanced feed additives and aquaculture technology
5. Skretting (Nutreco)
| Company Name | Skretting (Nutreco) |
|---|---|
| Established Year | 1899 |
| Headquarters | Stavanger, Norway |
| Website | Click Here |
Skretting is a global leader in high-quality nutritional solutions and aquafeed additives. It supports intensive aquaculture systems with scientifically formulated feed products.
Government Initiatives Being Implemented in the Taiwan Aqua Inputs and Supplements Market
Taiwan’s government is actively engaging in blue economy and sustainable fisheries and agricultural by various policies. Some of the policies are - modernization programs, biosecurity regulations, and eco-friendly farming practices. Government is also supporting in research and development with industry-academia collaboration and subsidies for sustainable fed and water treatment accelerates innovation across the aquaculture sector. This strengthens productivity, environmental compliance, and long-term industry investments. Government is trying to convert aquaculture into smart aquaculture by adoption of advance input and supplements.
Future Insights of the Taiwan Aqua Inputs and Supplements Market
The Taiwan Aqua Inputs and Supplements Market will make consistent growth. Increase in export-oriented aquaculture and strict food safety standards will push more high-quality aqua inputs. And when combined with biotechnology, probiotics, and functional feed additives will boost feed conversion efficiency, fish health, and diseases resistance. And integration of smart farming technologies, water quality monitoring systems(IoT integrated), and precision feeding solutions is going to create high-value opportunity across the aquaculture value chain.
Market Segmentation Analysis
The report offers a comprehensive study of the following market segments and their leading categories in the Taiwan Aqua Inputs and Supplements Market:
By Product Type – Functional Feed Additives Dominate the Market
According to Surbhi, Senior Research Analyst at 6Wresearch, increasing demand for probiotics, enzymes, amino acids, and immunity-boosting supplements makes functional feed additives the most widely used product category. These inputs significantly improve growth performance, disease resistance, and feed utilization efficiency in aquaculture systems.
By End Use – Fish Farming Dominates the Market
Fish farming remains the leading end-use segment in Taiwan due to strong domestic seafood demand and export-oriented aquaculture production. Shrimp and marine fish farming also contribute significantly to market demand.
Key Attractiveness of the Report:
- 10 Years of Market Numbers
- Historical Data Starting from 2022 to 2025
- Base Year: 2025
- Forecast Data until 2032
- Key Performance Indicators Impacting the Market
- Major Upcoming Developments and Projects
Key Highlights of the Report:
- Taiwan Aqua Inputs and Supplements Market Outlook
- Market Size of Taiwan Aqua Inputs and Supplements Market, 2025
- Forecast of Taiwan Aqua Inputs and Supplements Market, 2032
- Historical Data and Forecast of Taiwan Aqua Inputs and Supplements Revenues & Volume for the Period 2022- 2032
- Taiwan Aqua Inputs and Supplements Market Trend Evolution
- Taiwan Aqua Inputs and Supplements Market Drivers and Challenges
- Taiwan Aqua Inputs and Supplements Price Trends
- Taiwan Aqua Inputs and Supplements Porter's Five Forces
- Taiwan Aqua Inputs and Supplements Industry Life Cycle
- Historical Data and Forecast of Taiwan Aqua Inputs and Supplements Market Revenues & Volume By End-Use for the Period 2022- 2032
- Historical Data and Forecast of Taiwan Aqua Inputs and Supplements Market Revenues & Volume By Feed and Disease Management for the Period 2022- 2032
- Historical Data and Forecast of Taiwan Aqua Inputs and Supplements Market Revenues & Volume By Water Management for the Period 2022- 2032
- Historical Data and Forecast of Taiwan Aqua Inputs and Supplements Market Revenues & Volume By Soil Management for the Period 2022- 2032
- Historical Data and Forecast of Taiwan Aqua Inputs and Supplements Market Revenues & Volume By Product Type for the Period 2022- 2032
- Historical Data and Forecast of Taiwan Aqua Inputs and Supplements Market Revenues & Volume By Probiotics for the Period 2022- 2032
- Historical Data and Forecast of Taiwan Aqua Inputs and Supplements Market Revenues & Volume By Vitamins and Mineral Supplement for the Period 2022- 2032
- Historical Data and Forecast of Taiwan Aqua Inputs and Supplements Market Revenues & Volume By Growth Promoter for the Period 2022- 2032
- Historical Data and Forecast of Taiwan Aqua Inputs and Supplements Market Revenues & Volume By Disinfectant for the Period 2022- 2032
- Historical Data and Forecast of Taiwan Aqua Inputs and Supplements Market Revenues & Volume By Oxygen Enhancer for the Period 2022- 2032
- Historical Data and Forecast of Taiwan Aqua Inputs and Supplements Market Revenues & Volume By Zeolite for the Period 2022- 2032
- Historical Data and Forecast of Taiwan Aqua Inputs and Supplements Market Revenues & Volume by Immunostimulant for the Period 2022- 2032
- Taiwan Aqua Inputs and Supplements Import Export Trade Statistics
- Market Opportunity Assessment By End-Use
- Market Opportunity Assessment By Product Type
- Taiwan Aqua Inputs and Supplements Top Companies Market Share
- Taiwan Aqua Inputs and Supplements Competitive Benchmarking By Technical and Operational Parameters
- Taiwan Aqua Inputs and Supplements Company Profiles
- Taiwan Aqua Inputs and Supplements Key Strategic Recommendations
Market Covered
The report offers an extensive study of the following market segments:
By End-Use
- Feed and Disease Management
- Water Management
- Soil Management
By Product Type
- Probiotics
- Vitamins and Mineral Supplements
- Growth Promoters
- Disinfectants
- Oxygen Enhancers
- Zeolite
- Immunostimulants
Taiwan Aqua Inputs and Supplements Market (2026-2032): FAQs
Taiwan Aqua Inputs and Supplements Market is anticipated to grow at a CAGR of 7.9% during the forecast period (2026–2032).
The market growth is challenged by high dependency on imported raw materials, and disease outbreaks in aquaculture farms.
The Taiwanese government is promoting sustainable aquaculture practices through biosecurity regulations and initiatives to reduce antibiotic usage.
Some of the leading players in the market are Cargill Inc., Skretting (Nutreco), Grobest Group, and Charoen Pokphand Foods (CP Taiwan).
6Wresearch actively monitors the Taiwan Aqua Inputs and Supplements Market and publishes its comprehensive annual report, highlighting emerging trends, growth drivers, revenue analysis, and forecast outlook. Our insights help businesses to make data-backed strategic decisions with ongoing market dynamics. Our analysts track relevent industries related to the Taiwan Aqua Inputs and Supplements Market, allowing our clients with actionable intelligence and reliable forecasts tailored to emerging regional needs.
Yes, we provide customisation as per your requirements. To learn more, feel free to contact us on sales@6wresearch.com
| 1 Executive Summary |
| 2 Introduction |
| 2.1 Key Highlights of the Report |
| 2.2 Report Description |
| 2.3 Market Scope & Segmentation |
| 2.4 Research Methodology |
| 2.5 Assumptions |
| 3 Taiwan Aqua Inputs and Supplements Market Overview |
| 3.1 Taiwan Country Macro Economic Indicators |
| 3.2 Taiwan Aqua Inputs and Supplements Market Revenues & Volume, 2022 & 2032F |
| 3.3 Taiwan Aqua Inputs and Supplements Market - Industry Life Cycle |
| 3.4 Taiwan Aqua Inputs and Supplements Market - Porter's Five Forces |
| 3.5 Taiwan Aqua Inputs and Supplements Market Revenues & Volume Share, By End-Use, 2022 & 2032F |
| 3.6 Taiwan Aqua Inputs and Supplements Market Revenues & Volume Share, By Product Type, 2022 & 2032F |
| 4 Taiwan Aqua Inputs and Supplements Market Dynamics |
| 4.1 Impact Analysis |
| 4.2 Market Drivers |
| 4.2.1 Increasing demand for high-quality seafood products |
| 4.2.2 Growing awareness about the benefits of aqua inputs and supplements in aquaculture |
| 4.2.3 Government support and initiatives to boost the aquaculture industry in Taiwan |
| 4.3 Market Restraints |
| 4.3.1 Environmental concerns related to the use of aqua inputs and supplements |
| 4.3.2 Fluctuating prices of raw materials for aqua inputs and supplements |
| 4.3.3 Stringent regulations and compliance requirements in the aquaculture sector |
| 5 Taiwan Aqua Inputs and Supplements Market Trends |
| 6 Taiwan Aqua Inputs and Supplements Market, By Types |
| 6.1 Taiwan Aqua Inputs and Supplements Market, By End-Use |
| 6.1.1 Overview and Analysis |
| 6.1.2 Taiwan Aqua Inputs and Supplements Market Revenues & Volume, By End-Use, 2022- 2032F |
| 6.1.3 Taiwan Aqua Inputs and Supplements Market Revenues & Volume, By Feed and Disease Management, 2022- 2032F |
| 6.1.4 Taiwan Aqua Inputs and Supplements Market Revenues & Volume, By Water Management, 2022- 2032F |
| 6.1.5 Taiwan Aqua Inputs and Supplements Market Revenues & Volume, By Soil Management, 2022- 2032F |
| 6.2 Taiwan Aqua Inputs and Supplements Market, By Product Type |
| 6.2.1 Overview and Analysis |
| 6.2.2 Taiwan Aqua Inputs and Supplements Market Revenues & Volume, By Probiotics, 2022- 2032F |
| 6.2.3 Taiwan Aqua Inputs and Supplements Market Revenues & Volume, By Vitamins and Mineral Supplement, 2022- 2032F |
| 6.2.4 Taiwan Aqua Inputs and Supplements Market Revenues & Volume, By Growth Promoter, 2022- 2032F |
| 6.2.5 Taiwan Aqua Inputs and Supplements Market Revenues & Volume, By Disinfectant, 2022- 2032F |
| 6.2.6 Taiwan Aqua Inputs and Supplements Market Revenues & Volume, By Oxygen Enhancer, 2022- 2032F |
| 6.2.7 Taiwan Aqua Inputs and Supplements Market Revenues & Volume, By Zeolite, 2022- 2032F |
| 7 Taiwan Aqua Inputs and Supplements Market Import-Export Trade Statistics |
| 7.1 Taiwan Aqua Inputs and Supplements Market Export to Major Countries |
| 7.2 Taiwan Aqua Inputs and Supplements Market Imports from Major Countries |
| 8 Taiwan Aqua Inputs and Supplements Market Key Performance Indicators |
| 8.1 Percentage increase in adoption of sustainable aquaculture practices |
| 8.2 Growth in research and development investments in aqua inputs and supplements technology |
| 8.3 Improvement in aquaculture productivity and efficiency metrics |
| 9 Taiwan Aqua Inputs and Supplements Market - Opportunity Assessment |
| 9.1 Taiwan Aqua Inputs and Supplements Market Opportunity Assessment, By End-Use, 2022 & 2032F |
| 9.2 Taiwan Aqua Inputs and Supplements Market Opportunity Assessment, By Product Type, 2022 & 2032F |
| 10 Taiwan Aqua Inputs and Supplements Market - Competitive Landscape |
| 10.1 Taiwan Aqua Inputs and Supplements Market Revenue Share, By Companies, 2025 |
| 10.2 Taiwan Aqua Inputs and Supplements Market Competitive Benchmarking, By Operating and Technical Parameters |
| 11 Company Profiles |
| 12 Recommendations |
| 13 Disclaimer |
Global Go To Market Strategy - 2030
Export potential enables firms to identify high-growth global markets with greater confidence by combining advanced trade intelligence with a structured quantitative methodology. The framework analyzes emerging demand trends and country-level import patterns while integrating macroeconomic and trade datasets such as GDP and population forecasts, bilateral import–export flows, tariff structures, elasticity differentials between developed and developing economies, geographic distance, and import demand projections. Using weighted trade values from 2020–2024 as the base period to project country-to-country export potential for 2030, these inputs are operationalized through calculated drivers such as gravity model parameters, tariff impact factors, and projected GDP per-capita growth. Through an analysis of hidden potentials, demand hotspots, and market conditions that are most favorable to success, this method enables firms to focus on target countries, maximize returns, and global expansion with data, backed by accuracy.
By factoring in the projected importer demand gap that is currently unmet and could be potential opportunity, it identifies the potential for the Exporter (Country) among 190 countries, against the general trade analysis, which identifies the biggest importer or exporter.
To discover high-growth global markets and optimize your business strategy:
Click Here
Pricing
- Single User License$ 1,995
- Department License$ 2,400
- Site License$ 3,120
- Global License$ 3,795

Leadership Perspectives from Industry Events
Search
Thought Leadership and Analyst Meet


Our Clients
6WResearch In News
- Doha a strategic location for EV manufacturing hub: IPA Qatar
- Demand for luxury TVs surging in the GCC, says Samsung
- Empowering Growth: The Thriving Journey of Bangladesh’s Cable Industry
- Demand for luxury TVs surging in the GCC, says Samsung
- Video call with a traditional healer? Once unthinkable, it’s now common in South Africa
- Intelligent Buildings To Smooth GCC’s Path To Net Zero
Latest Reports
- Taiwan Airport Wireless Infrastructure Market (2026-2032)
- Vietnam Airport Wireless Infrastructure Market (2026-2032)
- Thailand Airport Wireless Infrastructure Market (2026-2032)
- South Korea Airport Wireless Infrastructure Market (2026-2032)
- Romania Airport Wireless Infrastructure Market (2026-2032)
- Qatar Airport Wireless Infrastructure Market (2026-2032)
- Philippines Airport Wireless Infrastructure Market (2026-2032)
- Japan Airport Wireless Infrastructure Market (2026-2032)
- Taiwan Airport Winter Services Market (2026-2032)
- Vietnam Airport Winter Services Market (2026-2032)
Industry Events and Analyst Meet

HIMTEX 2026

India Refining Summit 2026

India EV Show 2026

EV tech India Expo 2026

Auto Tech Asia 2026
Whitepaper
- Middle East & Africa Commercial Security Market Click here to view more.
- Middle East & Africa Fire Safety Systems & Equipment Market Click here to view more.
- GCC Drone Market Click here to view more.
- Middle East Lighting Fixture Market Click here to view more.
- GCC Physical & Perimeter Security Market Click here to view more.