Tanzania Bioactive Ingredients & Product Market (2026-2032) Outlook | Analysis, Revenue, Share, Value, Forecast, Size, Industry, Companies, Trends & Growth
Market Forecast By Ingredient (Probiotics, Proteins, Plant Extracts, Minerals, Vitamins, Fibers, Carotenoids), By Type (Prebiotics, Probiotics, Amino acids, peptides & proteins, Omega 3 & structured lipids, Phytochemicals & plant extracts, Minerals, Vitamins, Fibers & specialty carbohydrates), By Application (Functional food, Functional beverages, Dietary supplements, Animal nutrition, Personal care) And Competitive Landscape
| Product Code: ETC4600676 | Publication Date: Jul 2023 | Updated Date: Mar 2026 | Product Type: Report | |
| Publisher: 6Wresearch | Author: Ravi Bhandari | No. of Pages: 85 | No. of Figures: 45 | No. of Tables: 25 |
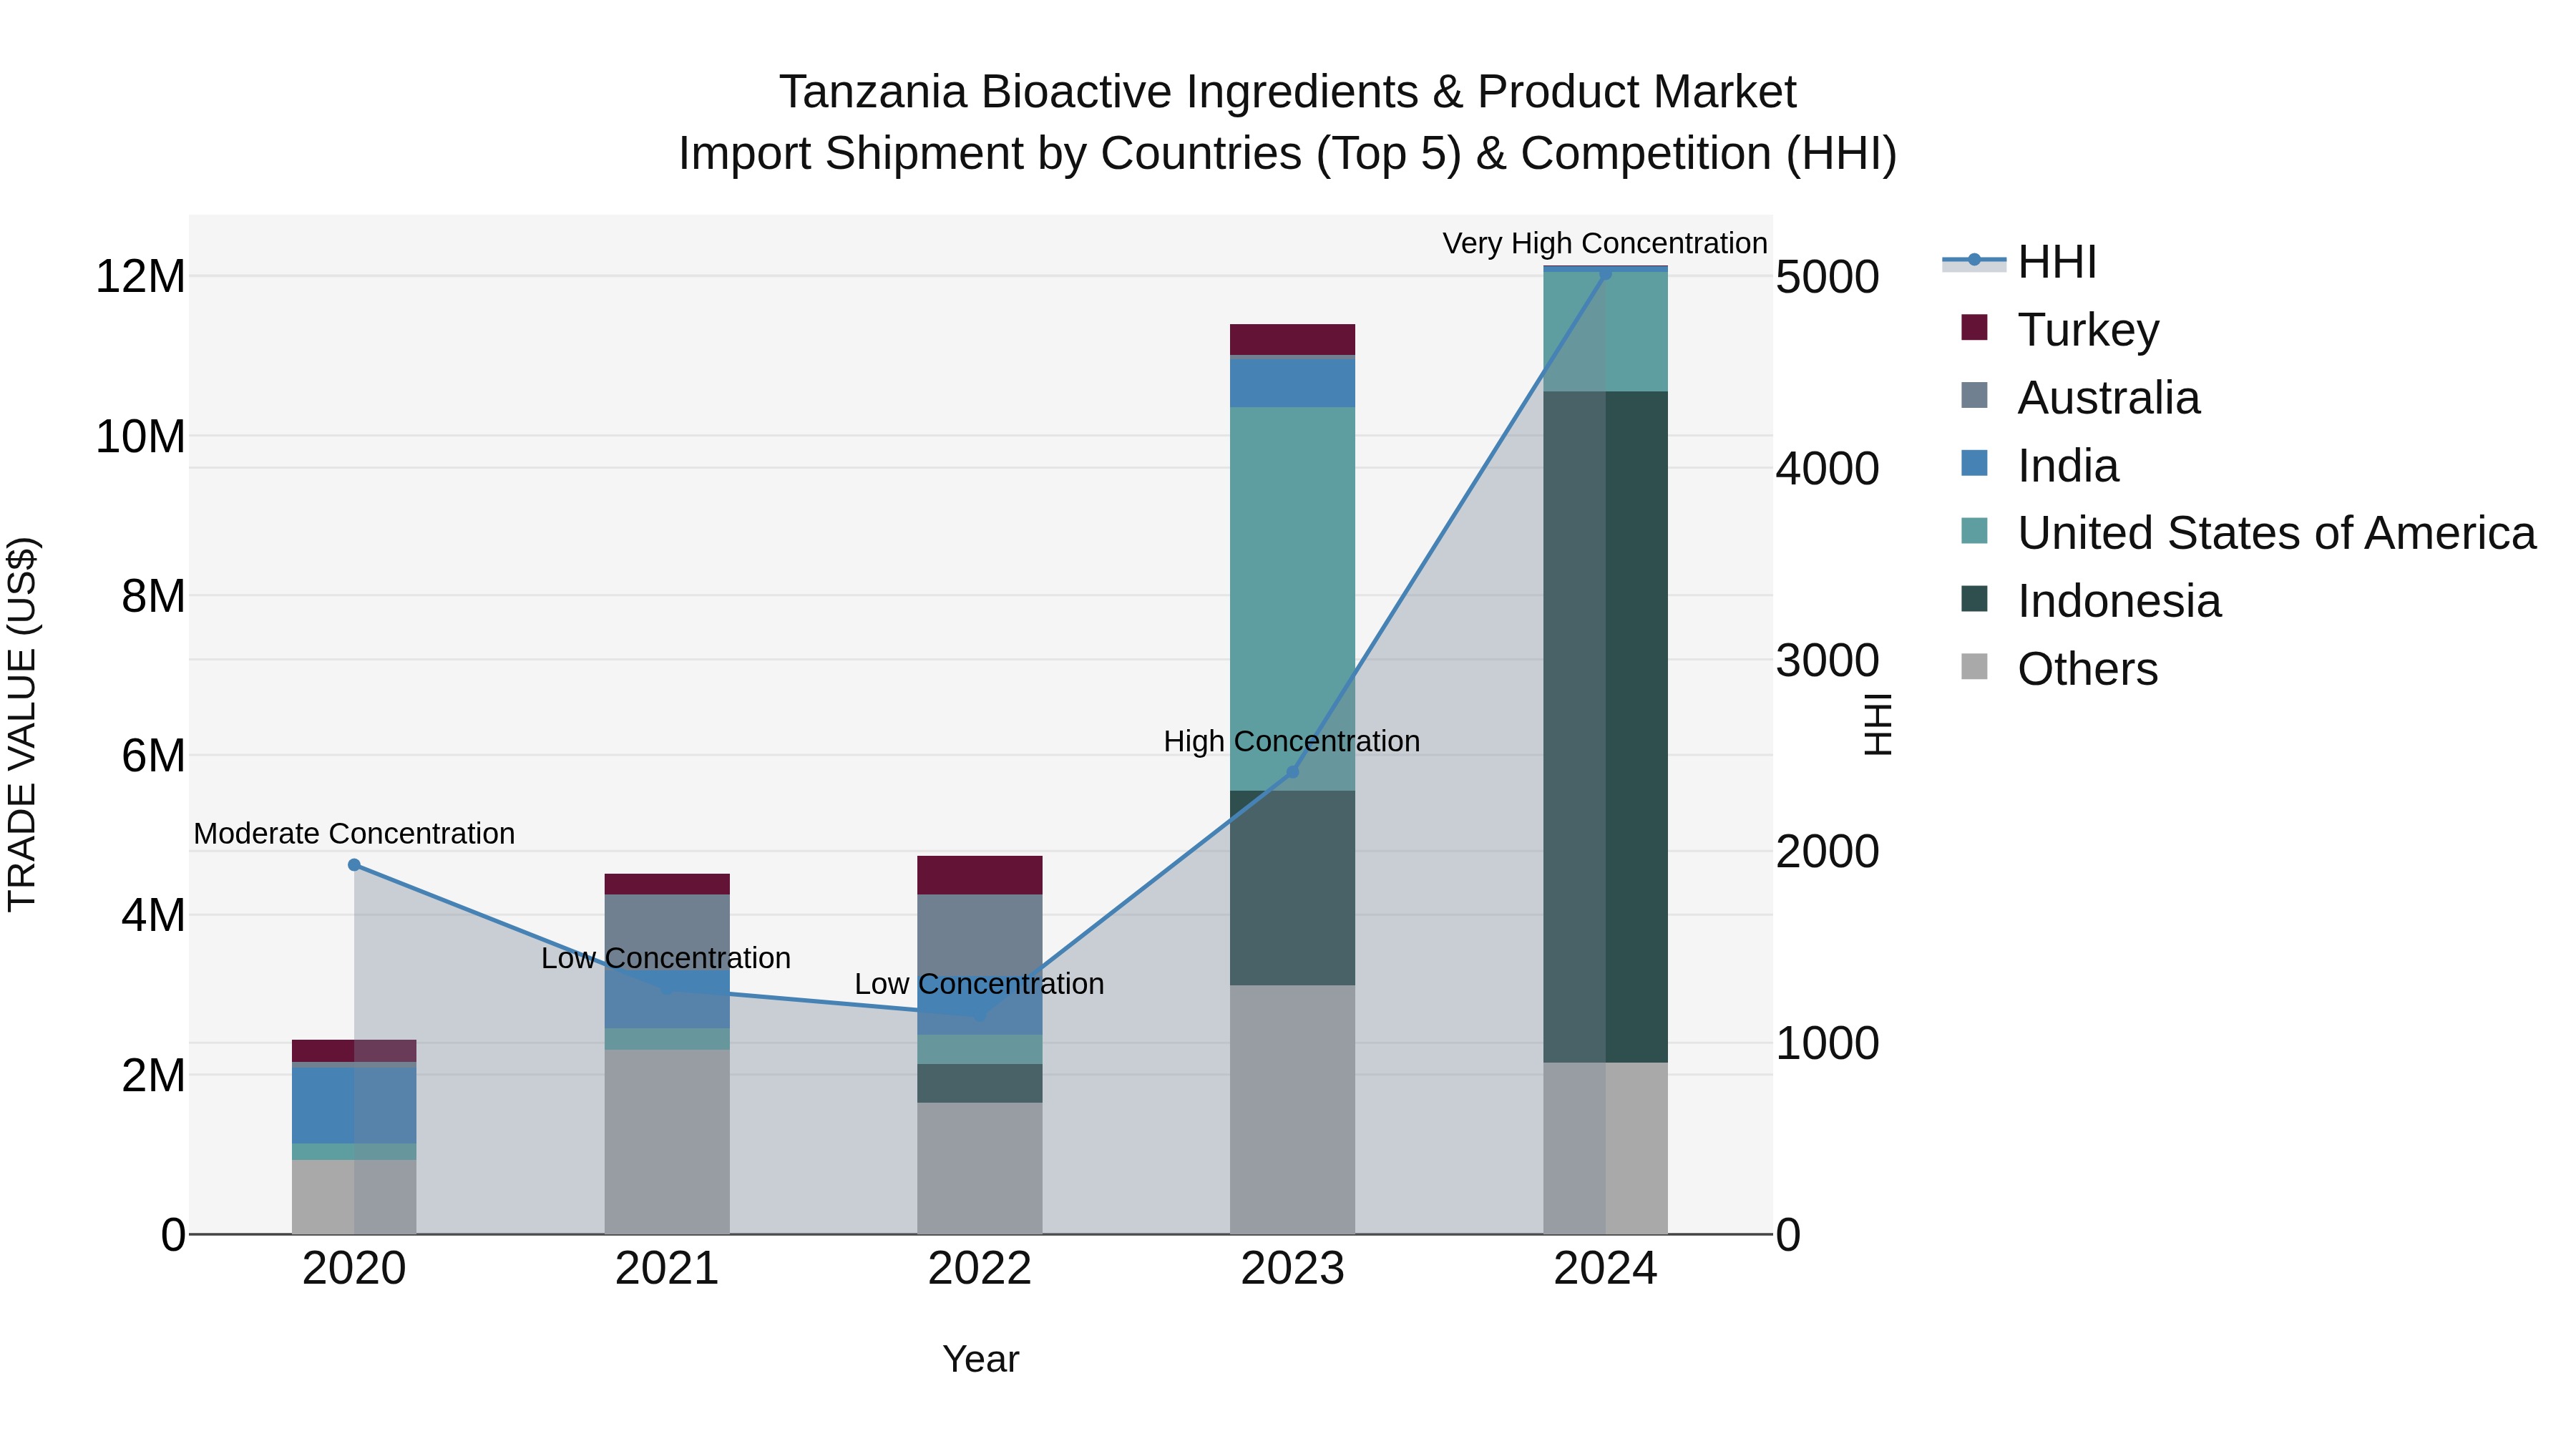
Tanzania Bioactive Ingredients & Product Market: Top 5 Importing Countries and Market Competition (HHI) Analysis
The import shipments of bioactive ingredients and products in Tanzania have shown remarkable growth, with a high Herfindahl-Hirschman Index (HHI) indicating increased market concentration. The top exporting countries to Tanzania in 2024 include Indonesia, USA, South Africa, Eswatini, and Hong Kong. With a notable Compound Annual Growth Rate (CAGR) of 49.42% from 2020 to 2024 and a growth rate of 6.43% from 2023 to 2024, the bioactive ingredients market in Tanzania is experiencing significant expansion and diversification, showcasing promising opportunities for both local and international suppliers.
Key Highlights of the Report:
- Tanzania Bioactive Ingredients & Product Market Outlook
- Market Size of Tanzania Bioactive Ingredients & Product Market, 2025
- Forecast of Tanzania Bioactive Ingredients & Product Market, 2032
- Historical Data and Forecast of Tanzania Bioactive Ingredients & Product Revenues & Volume for the Period 2022 - 2032F
- Tanzania Bioactive Ingredients & Product Market Trend Evolution
- Tanzania Bioactive Ingredients & Product Market Drivers and Challenges
- Tanzania Bioactive Ingredients & Product Price Trends
- Tanzania Bioactive Ingredients & Product Porter's Five Forces
- Tanzania Bioactive Ingredients & Product Industry Life Cycle
- Historical Data and Forecast of Tanzania Bioactive Ingredients & Product Market Revenues & Volume By Ingredient for the Period 2022 - 2032F
- Historical Data and Forecast of Tanzania Bioactive Ingredients & Product Market Revenues & Volume By Probiotics for the Period 2022 - 2032F
- Historical Data and Forecast of Tanzania Bioactive Ingredients & Product Market Revenues & Volume By Proteins for the Period 2022 - 2032F
- Historical Data and Forecast of Tanzania Bioactive Ingredients & Product Market Revenues & Volume By Plant Extracts for the Period 2022 - 2032F
- Historical Data and Forecast of Tanzania Bioactive Ingredients & Product Market Revenues & Volume By Minerals for the Period 2022 - 2032F
- Historical Data and Forecast of Tanzania Bioactive Ingredients & Product Market Revenues & Volume By Vitamins for the Period 2022 - 2032F
- Historical Data and Forecast of Tanzania Bioactive Ingredients & Product Market Revenues & Volume By Fibers for the Period 2022 - 2032F
- Historical Data and Forecast of Tanzania Bioactive Ingredients & Product Market Revenues & Volume By Carotenoids for the Period 2022 - 2032F
- Historical Data and Forecast of Tanzania Bioactive Ingredients & Product Market Revenues & Volume By Type for the Period 2022 - 2032F
- Historical Data and Forecast of Tanzania Bioactive Ingredients & Product Market Revenues & Volume By Prebiotics for the Period 2022 - 2032F
- Historical Data and Forecast of Tanzania Bioactive Ingredients & Product Market Revenues & Volume By Probiotics for the Period 2022 - 2032F
- Historical Data and Forecast of Tanzania Bioactive Ingredients & Product Market Revenues & Volume By Amino acids, peptides & proteins for the Period 2022 - 2032F
- Historical Data and Forecast of Tanzania Bioactive Ingredients & Product Market Revenues & Volume By Omega 3 & structured lipids for the Period 2022 - 2032F
- Historical Data and Forecast of Tanzania Bioactive Ingredients & Product Market Revenues & Volume By Phytochemicals & plant extracts for the Period 2022 - 2032F
- Historical Data and Forecast of Tanzania Bioactive Ingredients & Product Market Revenues & Volume By Minerals for the Period 2022 - 2032F
- Historical Data and Forecast of Tanzania Bioactive Ingredients & Product Market Revenues & Volume By Vitamins for the Period 2022 - 2032F
- Historical Data and Forecast of Tanzania Bioactive Ingredients & Product Market Revenues & Volume By Fibers & specialty carbohydrates for the Period 2022 - 2032F
- Historical Data and Forecast of Tanzania Bioactive Ingredients & Product Market Revenues & Volume By Application for the Period 2022 - 2032F
- Historical Data and Forecast of Tanzania Bioactive Ingredients & Product Market Revenues & Volume By Functional food for the Period 2022 - 2032F
- Historical Data and Forecast of Tanzania Bioactive Ingredients & Product Market Revenues & Volume By Functional beverages for the Period 2022 - 2032F
- Historical Data and Forecast of Tanzania Bioactive Ingredients & Product Market Revenues & Volume By Dietary supplements for the Period 2022 - 2032F
- Historical Data and Forecast of Tanzania Bioactive Ingredients & Product Market Revenues & Volume By Animal nutrition for the Period 2022 - 2032F
- Historical Data and Forecast of Tanzania Bioactive Ingredients & Product Market Revenues & Volume By Personal care for the Period 2022 - 2032F
- Tanzania Bioactive Ingredients & Product Import Export Trade Statistics
- Market Opportunity Assessment By Ingredient
- Market Opportunity Assessment By Type
- Market Opportunity Assessment By Application
- Tanzania Bioactive Ingredients & Product Top Companies Market Share
- Tanzania Bioactive Ingredients & Product Competitive Benchmarking By Technical and Operational Parameters
- Tanzania Bioactive Ingredients & Product Company Profiles
- Tanzania Bioactive Ingredients & Product Key Strategic Recommendations
What are the key drivers, challenges, and dynamics shaping the Tanzania bioactive ingredients & product market?
In the Tanzania bioactive ingredients & product market, key drivers include the growing consumer demand for natural and organic products, leading companies like Natural Extracts Industries leveraging local botanical resources for product development. However, challenges such as limited infrastructure and access to technology hinder market growth. Dynamics such as partnerships between local farmers and international companies to improve supply chain efficiency further shape this market.
The Tanzania bioactive ingredients & product market is expected to witness significant growth in the coming years driven by increasing consumer demand for natural and organic products. Companies like Tanzanian Biotech and Herbal Solutions Ltd are actively investing in research and development to introduce innovative bioactive products to cater to this growing market trend. The market direction is likely to shift towards sustainable sourcing practices and product transparency, with a focus on promoting the health and wellness benefits of bioactive ingredients.
The Tanzania bioactive ingredients & product market encompasses a wide range of natural substances derived from plants, animals, or microorganisms that have biological activity and are used in various industries such as pharmaceuticals, cosmetics, and food & beverages. Companies like Tanzanian company Afya Organics specialize in sourcing and producing bioactive ingredients for use in skincare products, supplements, and functional foods. The market is driven by a growing demand for natural and sustainable solutions in consumer products, with Tanzania's rich biodiversity offering a diverse range of bioactive resources for extraction and commercialization.
Businesses in the Tanzania bioactive ingredients & product market have significant opportunities to leverage the country's rich biodiversity to develop innovative products. For example, companies like Akoma Skincare and True Moringa have successfully incorporated bioactive ingredients sourced from Tanzania into their beauty and wellness products, tapping into the growing consumer demand for natural and sustainable solutions. Additionally, partnerships with local farmers and cooperatives can not only ensure a sustainable supply chain but also support community development initiatives, creating a win-win situation for both businesses and local stakeholders.
In recent years, there has been a noticeable shift in consumer preferences towards natural and organic products in Tanzania's bioactive ingredients market. Consumers are increasingly seeking products that are free from synthetic chemicals and additives, leading to the rise of brands like Zara Organics offering a wide range of bioactive skincare products. Additionally, advancements in extraction technologies, such as the use of supercritical CO2 extraction by companies like TanzBioTech, are enabling the production of high-quality bioactive ingredients. On the policy front, the Tanzanian government has been focusing on promoting sustainable agriculture practices and supporting local bioactive ingredient producers through initiatives like the Agricultural Sector Development Program.
6Wresearch actively monitors the Tanzania Bioactive Ingredients & Product Market and publishes its comprehensive annual report, highlighting emerging trends, growth drivers, revenue analysis, and forecast outlook. Our insights help businesses to make data-backed strategic decisions with ongoing market dynamics. Our analysts track relevent industries related to the Tanzania Bioactive Ingredients & Product Market, allowing our clients with actionable intelligence and reliable forecasts tailored to emerging regional needs.
Yes, we provide customisation as per your requirements. To learn more, feel free to contact us on sales@6wresearch.com
1 Executive Summary |
2 Introduction |
2.1 Key Highlights of the Report |
2.2 Report Description |
2.3 Market Scope & Segmentation |
2.4 Research Methodology |
2.5 Assumptions |
3 Tanzania Bioactive Ingredients & Product Market Overview |
3.1 Tanzania Country Macro Economic Indicators |
3.2 Tanzania Bioactive Ingredients & Product Market Revenues & Volume, 2022 & 2032F |
3.3 Tanzania Bioactive Ingredients & Product Market - Industry Life Cycle |
3.4 Tanzania Bioactive Ingredients & Product Market - Porter's Five Forces |
3.5 Tanzania Bioactive Ingredients & Product Market Revenues & Volume Share, By Ingredient, 2022 & 2032F |
3.6 Tanzania Bioactive Ingredients & Product Market Revenues & Volume Share, By Type, 2022 & 2032F |
3.7 Tanzania Bioactive Ingredients & Product Market Revenues & Volume Share, By Application, 2022 & 2032F |
4 Tanzania Bioactive Ingredients & Product Market Dynamics |
4.1 Impact Analysis |
4.2 Market Drivers |
4.2.1 Increasing consumer awareness about health and wellness benefits of bioactive ingredients |
4.2.2 Growing demand for natural and organic products |
4.2.3 Government initiatives promoting the use of bioactive ingredients in various industries |
4.3 Market Restraints |
4.3.1 High production costs associated with sourcing and processing bioactive ingredients |
4.3.2 Lack of standardized regulations for bioactive ingredients and products |
4.3.3 Limited availability of skilled workforce in the bioactive ingredients sector |
5 Tanzania Bioactive Ingredients & Product Market Trends |
6 Tanzania Bioactive Ingredients & Product Market, By Types |
6.1 Tanzania Bioactive Ingredients & Product Market, By Ingredient |
6.1.1 Overview and Analysis |
6.1.2 Tanzania Bioactive Ingredients & Product Market Revenues & Volume, By Ingredient, 2022 - 2032F |
6.1.3 Tanzania Bioactive Ingredients & Product Market Revenues & Volume, By Probiotics, 2022 - 2032F |
6.1.4 Tanzania Bioactive Ingredients & Product Market Revenues & Volume, By Proteins, 2022 - 2032F |
6.1.5 Tanzania Bioactive Ingredients & Product Market Revenues & Volume, By Plant Extracts, 2022 - 2032F |
6.1.6 Tanzania Bioactive Ingredients & Product Market Revenues & Volume, By Minerals, 2022 - 2032F |
6.1.7 Tanzania Bioactive Ingredients & Product Market Revenues & Volume, By Vitamins, 2022 - 2032F |
6.1.8 Tanzania Bioactive Ingredients & Product Market Revenues & Volume, By Fibers, 2022 - 2032F |
6.2 Tanzania Bioactive Ingredients & Product Market, By Type |
6.2.1 Overview and Analysis |
6.2.2 Tanzania Bioactive Ingredients & Product Market Revenues & Volume, By Prebiotics, 2022 - 2032F |
6.2.3 Tanzania Bioactive Ingredients & Product Market Revenues & Volume, By Probiotics, 2022 - 2032F |
6.2.4 Tanzania Bioactive Ingredients & Product Market Revenues & Volume, By Amino acids, peptides & proteins, 2022 - 2032F |
6.2.5 Tanzania Bioactive Ingredients & Product Market Revenues & Volume, By Omega 3 & structured lipids, 2022 - 2032F |
6.2.6 Tanzania Bioactive Ingredients & Product Market Revenues & Volume, By Phytochemicals & plant extracts, 2022 - 2032F |
6.2.7 Tanzania Bioactive Ingredients & Product Market Revenues & Volume, By Minerals, 2022 - 2032F |
6.2.8 Tanzania Bioactive Ingredients & Product Market Revenues & Volume, By Fibers & specialty carbohydrates, 2022 - 2032F |
6.2.9 Tanzania Bioactive Ingredients & Product Market Revenues & Volume, By Fibers & specialty carbohydrates, 2022 - 2032F |
6.3 Tanzania Bioactive Ingredients & Product Market, By Application |
6.3.1 Overview and Analysis |
6.3.2 Tanzania Bioactive Ingredients & Product Market Revenues & Volume, By Functional food, 2022 - 2032F |
6.3.3 Tanzania Bioactive Ingredients & Product Market Revenues & Volume, By Functional beverages, 2022 - 2032F |
6.3.4 Tanzania Bioactive Ingredients & Product Market Revenues & Volume, By Dietary supplements, 2022 - 2032F |
6.3.5 Tanzania Bioactive Ingredients & Product Market Revenues & Volume, By Animal nutrition, 2022 - 2032F |
6.3.6 Tanzania Bioactive Ingredients & Product Market Revenues & Volume, By Personal care, 2022 - 2032F |
7 Tanzania Bioactive Ingredients & Product Market Import-Export Trade Statistics |
7.1 Tanzania Bioactive Ingredients & Product Market Export to Major Countries |
7.2 Tanzania Bioactive Ingredients & Product Market Imports from Major Countries |
8 Tanzania Bioactive Ingredients & Product Market Key Performance Indicators |
8.1 Research and development investment in new bioactive ingredients |
8.2 Number of new product launches incorporating bioactive ingredients |
8.3 Percentage of consumers actively seeking products with bioactive ingredients |
8.4 Adoption rate of bioactive ingredients by key industries in Tanzania |
8.5 Number of partnerships and collaborations between bioactive ingredient suppliers and product manufacturers |
9 Tanzania Bioactive Ingredients & Product Market - Opportunity Assessment |
9.1 Tanzania Bioactive Ingredients & Product Market Opportunity Assessment, By Ingredient, 2022 & 2032F |
9.2 Tanzania Bioactive Ingredients & Product Market Opportunity Assessment, By Type, 2022 & 2032F |
9.3 Tanzania Bioactive Ingredients & Product Market Opportunity Assessment, By Application, 2022 & 2032F |
10 Tanzania Bioactive Ingredients & Product Market - Competitive Landscape |
10.1 Tanzania Bioactive Ingredients & Product Market Revenue Share, By Companies, 2025 |
10.2 Tanzania Bioactive Ingredients & Product Market Competitive Benchmarking, By Operating and Technical Parameters |
11 Company Profiles |
12 Recommendations |
13 Disclaimer |
Global Go To Market Strategy - 2030
Export potential enables firms to identify high-growth global markets with greater confidence by combining advanced trade intelligence with a structured quantitative methodology. The framework analyzes emerging demand trends and country-level import patterns while integrating macroeconomic and trade datasets such as GDP and population forecasts, bilateral import–export flows, tariff structures, elasticity differentials between developed and developing economies, geographic distance, and import demand projections. Using weighted trade values from 2020–2024 as the base period to project country-to-country export potential for 2030, these inputs are operationalized through calculated drivers such as gravity model parameters, tariff impact factors, and projected GDP per-capita growth. Through an analysis of hidden potentials, demand hotspots, and market conditions that are most favorable to success, this method enables firms to focus on target countries, maximize returns, and global expansion with data, backed by accuracy.
By factoring in the projected importer demand gap that is currently unmet and could be potential opportunity, it identifies the potential for the Exporter (Country) among 190 countries, against the general trade analysis, which identifies the biggest importer or exporter.
To discover high-growth global markets and optimize your business strategy:
Click Here
Pricing
- Single User License$ 1,995
- Department License$ 2,400
- Site License$ 3,120
- Global License$ 3,795

Leadership Perspectives from Industry Events
Search
Thought Leadership and Analyst Meet


Our Clients
6WResearch In News
- India Export Attractiveness Tracker 2026
- India Air Conditioner Market Set for Strong Rebound in 2026 After Weather-Led Correction and GST-Driven Recovery: 6Wresearch
- ADAS in India: How Automatic Emergency Braking, Blind Spot Detection & Driver Monitoring are Transforming Road Safety
- Doha a strategic location for EV manufacturing hub: IPA Qatar
- Demand for luxury TVs surging in the GCC, says Samsung
- Empowering Growth: The Thriving Journey of Bangladesh’s Cable Industry
Latest Reports
- Nicaragua RPG Gaming Market (2026-2032)
- New Zealand RPG Gaming Market (2026-2032)
- Netherlands RPG Gaming Market (2026-2032)
- Nauru RPG Gaming Market (2026-2032)
- Namibia RPG Gaming Market (2026-2032)
- Mozambique RPG Gaming Market (2026-2032)
- Montenegro RPG Gaming Market (2026-2032)
- Mongolia RPG Gaming Market (2026-2032)
- Monaco RPG Gaming Market (2026-2032)
- Micronesia RPG Gaming Market (2026-2032)
Industry Events and Analyst Meet

EV India Expo 2026

HIMTEX 2026

India Refining Summit 2026

India EV Show 2026

EV tech India Expo 2026
Whitepaper
- Middle East & Africa Commercial Security Market Click here to view more.
- Middle East & Africa Fire Safety Systems & Equipment Market Click here to view more.
- GCC Drone Market Click here to view more.
- Middle East Lighting Fixture Market Click here to view more.
- GCC Physical & Perimeter Security Market Click here to view more.