Tanzania Bunker Fuel Market (2025-2031) | Companies, Value, Analysis, Trends, Industry, Segmentation, Revenue, Share, Growth, Forecast, Outlook & Size
Market Forecast By Type (High Sulfur Fuel Oil, Low Sulfur Fuel Oil, Marine Gas Oil, Others), By Commerical Distributor (Oil Majors, Large Independent, Small Independent) And Competitive Landscape
| Product Code: ETC4823630 | Publication Date: Nov 2023 | Updated Date: Nov 2025 | Product Type: Market Research Report | |
| Publisher: 6Wresearch | Author: Sachin Kumar Rai | No. of Pages: 60 | No. of Figures: 30 | No. of Tables: 5 |
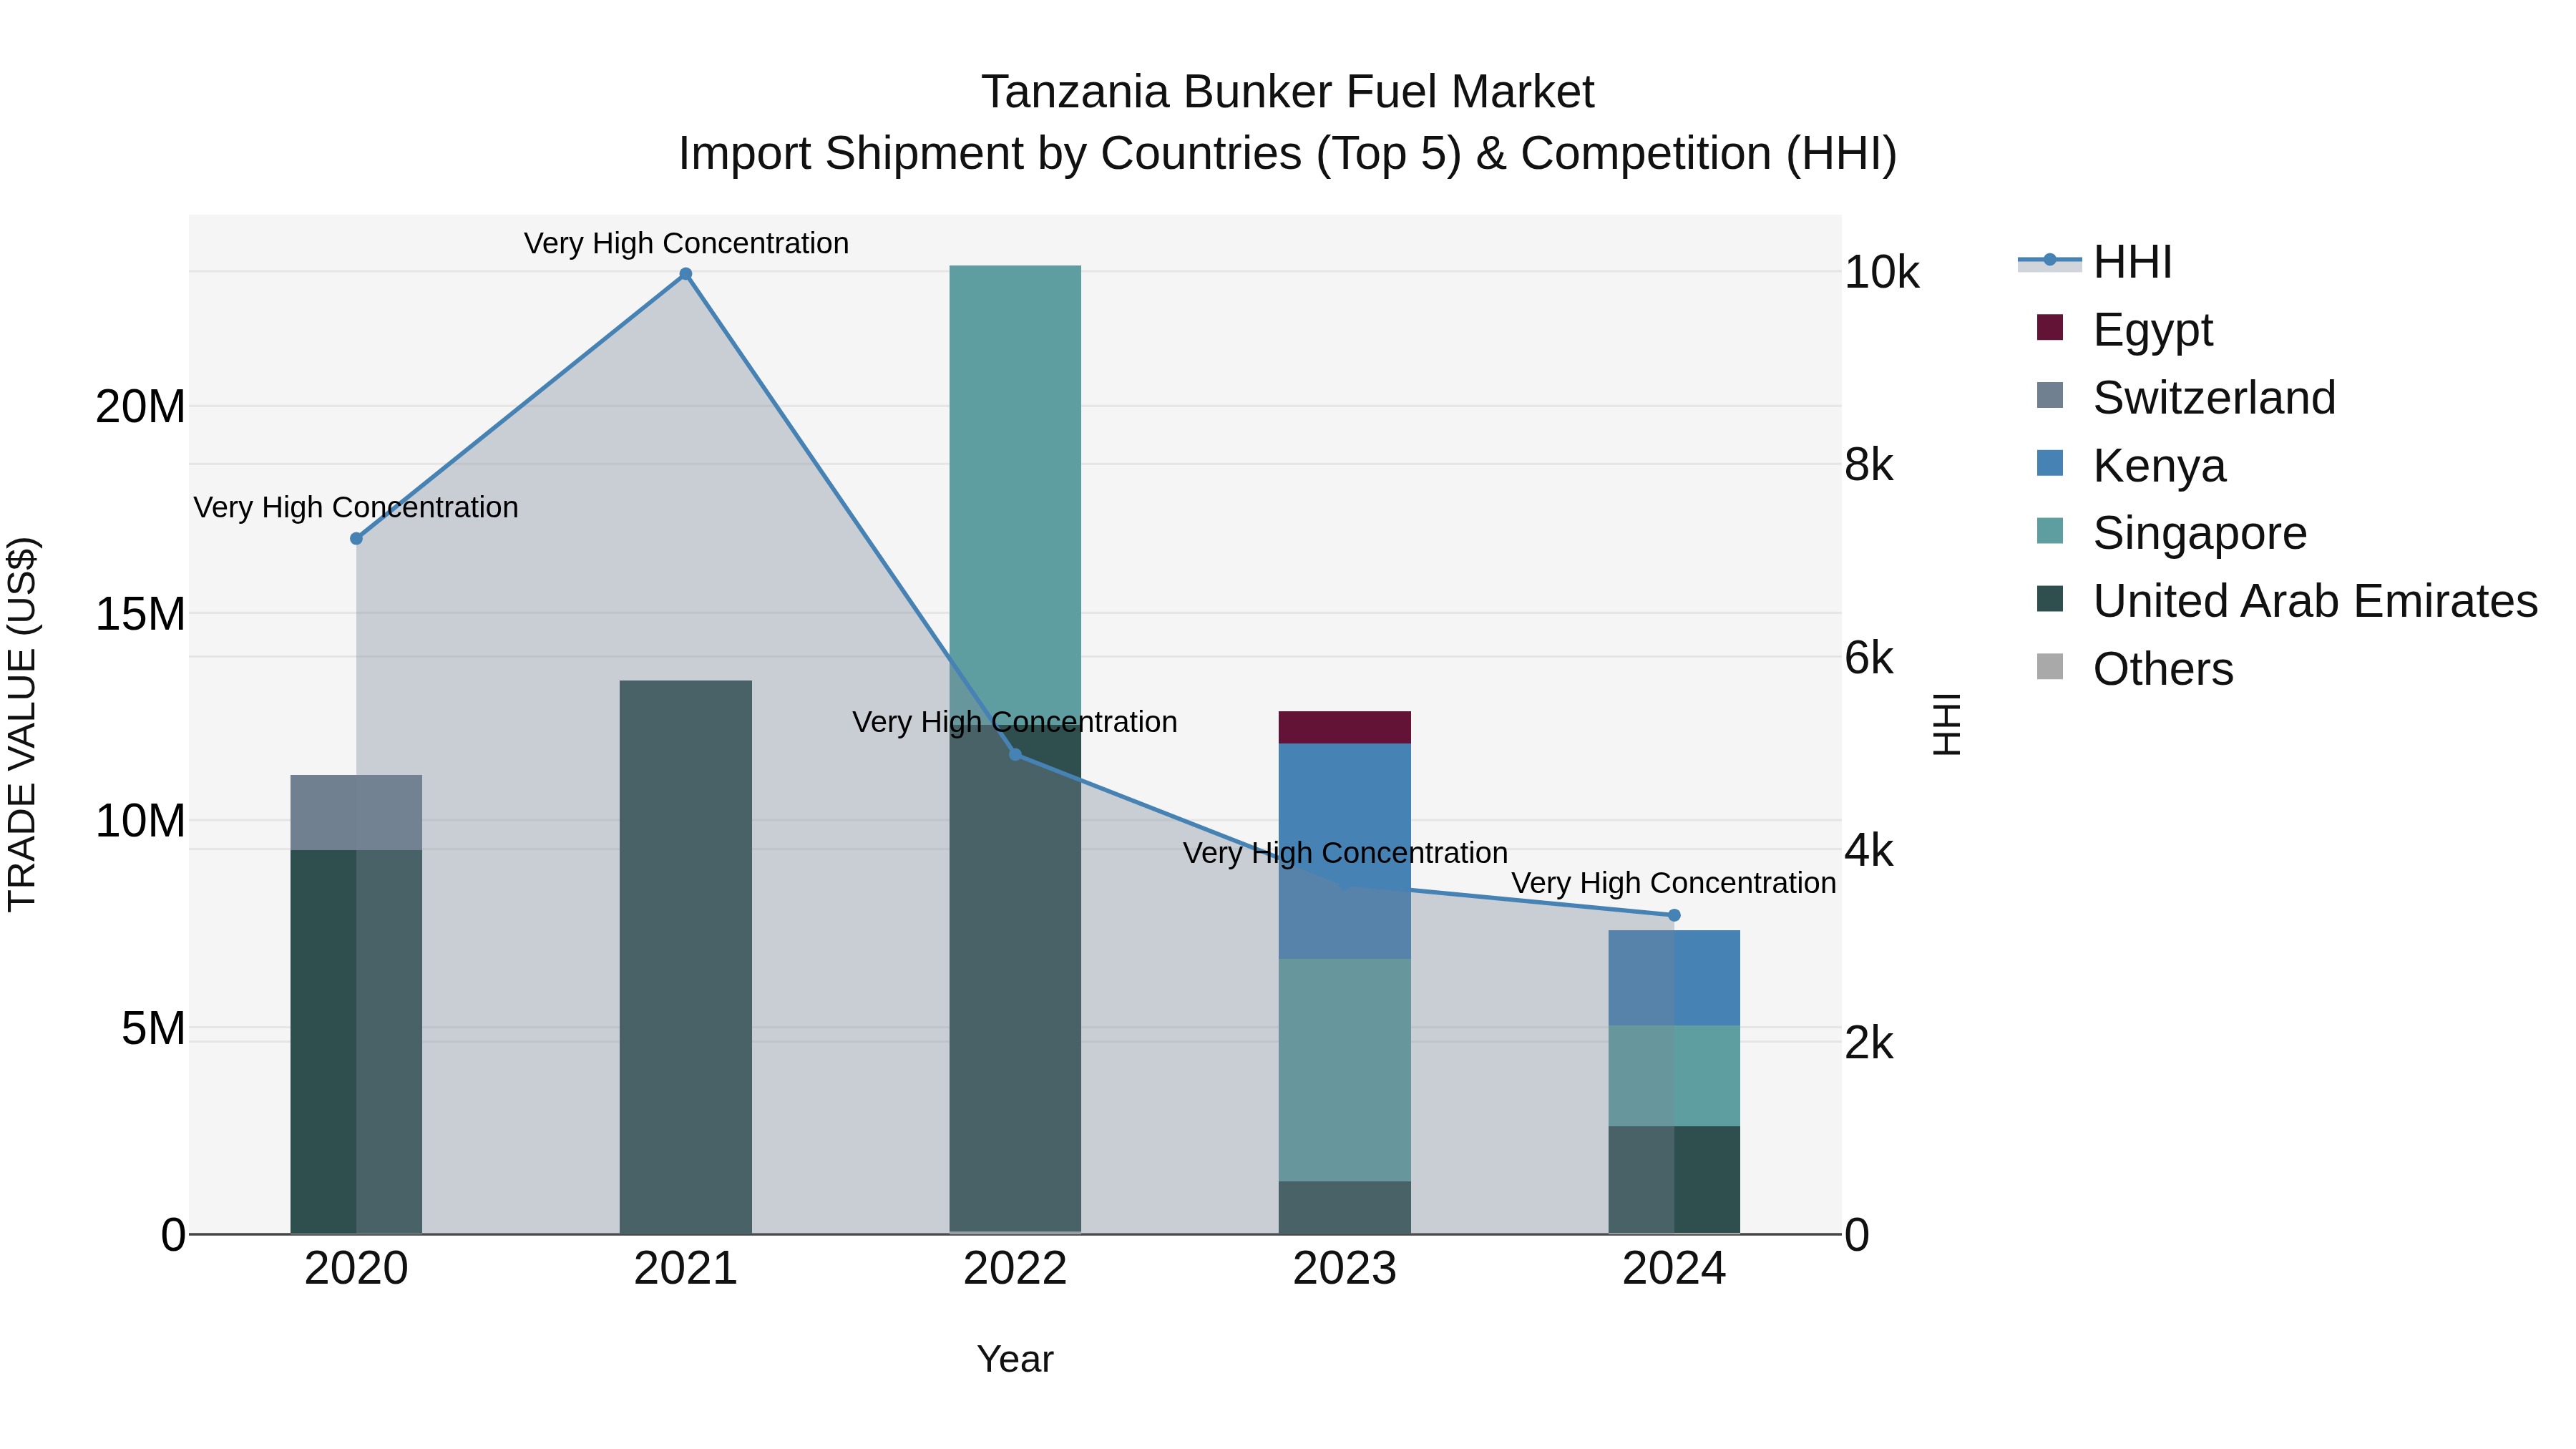
Tanzania Bunker Fuel Market: Top 5 Importing Countries and Market Competition (HHI) Analysis
Tanzania`s bunker fuel import market in 2024 continued to be dominated by key players like United Arab Emirates, Singapore, and China. Despite a high concentration level indicated by the Herfindahl-Hirschman Index (HHI), the market experienced a significant decline with a CAGR of -9.82% from 2020 to 2024. The growth rate in 2024 saw a sharp decrease of -41.94% compared to the previous year, reflecting challenges and changes in the global bunker fuel trade landscape impacting Tanzania`s imports.
Tanzania Bunker Fuel Market Overview
The bunker fuel market in Tanzania caters to the needs of the maritime industry, providing fuel for ships. With Dar es Salaam being a significant port in the region, the market is influenced by the volume of maritime traffic and international trade. Government policies on fuel quality standards and environmental regulations impact the market dynamics, particularly in relation to sulfur content and emissions.
Drivers of the market
The bunker fuel market in Tanzania is driven by the growth of the shipping and maritime industry. The country`s strategic location along major shipping routes in the Indian Ocean increases the demand for bunker fuel. The expansion of the port infrastructure and government initiatives to develop the maritime sector further support market growth. Additionally, the rising global trade and the increasing number of commercial vessels passing through Tanzania ports contribute to the demand for bunker fuel. Environmental regulations and the shift towards cleaner and more efficient fuel types also influence the market dynamics.
Challenges of the market
The Tanzania bunker fuel market encounters multifaceted challenges amid global energy transitions and environmental regulations. As the maritime sector adapts to stricter emissions standards, demand shifts towards cleaner and sustainable fuel alternatives present a pivotal challenge. Balancing compliance with International Maritime Organization (IMO) regulations while ensuring cost-effective operations remains a critical concern for maritime stakeholders. Moreover, fluctuating global oil prices and geopolitical tensions contribute to market volatility, impacting bunker fuel pricing and supply chain resilience. Infrastructure constraints in fuel storage and distribution also pose logistical challenges, affecting supply reliability and operational efficiency in Tanzania ports and coastal regions.
Government Policy of the market
The government regulates the bunker fuel market through policies that address environmental sustainability and maritime safety. Regulations cover fuel quality standards, emissions control, and compliance with international maritime conventions to reduce environmental impact and ensure safe maritime operations.
Key Highlights of the Report:
- Tanzania Bunker Fuel Market Outlook
- Market Size of Tanzania Bunker Fuel Market, 2024
- Forecast of Tanzania Bunker Fuel Market, 2031
- Historical Data and Forecast of Tanzania Bunker Fuel Revenues & Volume for the Period 2021-2031
- Tanzania Bunker Fuel Market Trend Evolution
- Tanzania Bunker Fuel Market Drivers and Challenges
- Tanzania Bunker Fuel Price Trends
- Tanzania Bunker Fuel Porter`s Five Forces
- Tanzania Bunker Fuel Industry Life Cycle
- Historical Data and Forecast of Tanzania Bunker Fuel Market Revenues & Volume By Type for the Period 2021-2031
- Historical Data and Forecast of Tanzania Bunker Fuel Market Revenues & Volume By High Sulfur Fuel Oil for the Period 2021-2031
- Historical Data and Forecast of Tanzania Bunker Fuel Market Revenues & Volume By Low Sulfur Fuel Oil for the Period 2021-2031
- Historical Data and Forecast of Tanzania Bunker Fuel Market Revenues & Volume By Marine Gas Oil for the Period 2021-2031
- Historical Data and Forecast of Tanzania Bunker Fuel Market Revenues & Volume By Others for the Period 2021-2031
- Historical Data and Forecast of Tanzania Bunker Fuel Market Revenues & Volume By Commerical Distributor for the Period 2021-2031
- Historical Data and Forecast of Tanzania Bunker Fuel Market Revenues & Volume By Oil Majors for the Period 2021-2031
- Historical Data and Forecast of Tanzania Bunker Fuel Market Revenues & Volume By Large Independent for the Period 2021-2031
- Historical Data and Forecast of Tanzania Bunker Fuel Market Revenues & Volume By Small Independent for the Period 2021-2031
- Tanzania Bunker Fuel Import Export Trade Statistics
- Market Opportunity Assessment By Type
- Market Opportunity Assessment By Commerical Distributor
- Tanzania Bunker Fuel Top Companies Market Share
- Tanzania Bunker Fuel Competitive Benchmarking By Technical and Operational Parameters
- Tanzania Bunker Fuel Company Profiles
- Tanzania Bunker Fuel Key Strategic Recommendations
Frequently Asked Questions About the Market Study (FAQs):
6Wresearch actively monitors the Tanzania Bunker Fuel Market and publishes its comprehensive annual report, highlighting emerging trends, growth drivers, revenue analysis, and forecast outlook. Our insights help businesses to make data-backed strategic decisions with ongoing market dynamics. Our analysts track relevent industries related to the Tanzania Bunker Fuel Market, allowing our clients with actionable intelligence and reliable forecasts tailored to emerging regional needs.
Yes, we provide customisation as per your requirements. To learn more, feel free to contact us on sales@6wresearch.com
1 Executive Summary |
2 Introduction |
2.1 Key Highlights of the Report |
2.2 Report Description |
2.3 Market Scope & Segmentation |
2.4 Research Methodology |
2.5 Assumptions |
3 Tanzania Bunker Fuel Market Overview |
3.1 Tanzania Country Macro Economic Indicators |
3.2 Tanzania Bunker Fuel Market Revenues & Volume, 2021 & 2031F |
3.3 Tanzania Bunker Fuel Market - Industry Life Cycle |
3.4 Tanzania Bunker Fuel Market - Porter's Five Forces |
3.5 Tanzania Bunker Fuel Market Revenues & Volume Share, By Type, 2021 & 2031F |
3.6 Tanzania Bunker Fuel Market Revenues & Volume Share, By Commerical Distributor, 2021 & 2031F |
4 Tanzania Bunker Fuel Market Dynamics |
4.1 Impact Analysis |
4.2 Market Drivers |
4.2.1 Increasing demand for energy due to economic growth and industrialization |
4.2.2 Growth in maritime trade activities and shipping traffic in Tanzanian ports |
4.2.3 Government investments in infrastructure development and port expansion projects |
4.3 Market Restraints |
4.3.1 Volatility in global oil prices impacting bunker fuel prices |
4.3.2 Stringent environmental regulations and increasing focus on sustainability |
4.3.3 Competition from alternative energy sources and technologies |
5 Tanzania Bunker Fuel Market Trends |
6 Tanzania Bunker Fuel Market Segmentations |
6.1 Tanzania Bunker Fuel Market, By Type |
6.1.1 Overview and Analysis |
6.1.2 Tanzania Bunker Fuel Market Revenues & Volume, By High Sulfur Fuel Oil, 2021-2031F |
6.1.3 Tanzania Bunker Fuel Market Revenues & Volume, By Low Sulfur Fuel Oil, 2021-2031F |
6.1.4 Tanzania Bunker Fuel Market Revenues & Volume, By Marine Gas Oil, 2021-2031F |
6.1.5 Tanzania Bunker Fuel Market Revenues & Volume, By Others, 2021-2031F |
6.2 Tanzania Bunker Fuel Market, By Commerical Distributor |
6.2.1 Overview and Analysis |
6.2.2 Tanzania Bunker Fuel Market Revenues & Volume, By Oil Majors, 2021-2031F |
6.2.3 Tanzania Bunker Fuel Market Revenues & Volume, By Large Independent, 2021-2031F |
6.2.4 Tanzania Bunker Fuel Market Revenues & Volume, By Small Independent, 2021-2031F |
7 Tanzania Bunker Fuel Market Import-Export Trade Statistics |
7.1 Tanzania Bunker Fuel Market Export to Major Countries |
7.2 Tanzania Bunker Fuel Market Imports from Major Countries |
8 Tanzania Bunker Fuel Market Key Performance Indicators |
8.1 Average bunker fuel consumption per vessel in Tanzanian ports |
8.2 Number of new shipping routes established in Tanzanian waters |
8.3 Percentage of vessels using compliant low-sulfur bunker fuel |
9 Tanzania Bunker Fuel Market - Opportunity Assessment |
9.1 Tanzania Bunker Fuel Market Opportunity Assessment, By Type, 2021 & 2031F |
9.2 Tanzania Bunker Fuel Market Opportunity Assessment, By Commerical Distributor, 2021 & 2031F |
10 Tanzania Bunker Fuel Market - Competitive Landscape |
10.1 Tanzania Bunker Fuel Market Revenue Share, By Companies, 2024 |
10.2 Tanzania Bunker Fuel Market Competitive Benchmarking, By Operating and Technical Parameters |
11 Company Profiles |
12 Recommendations | 13 Disclaimer |
Export potential assessment - trade Analytics for 2030
Export potential enables firms to identify high-growth global markets with greater confidence by combining advanced trade intelligence with a structured quantitative methodology. The framework analyzes emerging demand trends and country-level import patterns while integrating macroeconomic and trade datasets such as GDP and population forecasts, bilateral import–export flows, tariff structures, elasticity differentials between developed and developing economies, geographic distance, and import demand projections. Using weighted trade values from 2020–2024 as the base period to project country-to-country export potential for 2030, these inputs are operationalized through calculated drivers such as gravity model parameters, tariff impact factors, and projected GDP per-capita growth. Through an analysis of hidden potentials, demand hotspots, and market conditions that are most favorable to success, this method enables firms to focus on target countries, maximize returns, and global expansion with data, backed by accuracy.
By factoring in the projected importer demand gap that is currently unmet and could be potential opportunity, it identifies the potential for the Exporter (Country) among 190 countries, against the general trade analysis, which identifies the biggest importer or exporter.
To discover high-growth global markets and optimize your business strategy:
Click Here
Pricing
- Single User License$ 1,995
- Department License$ 2,400
- Site License$ 3,120
- Global License$ 3,795

Search
Thought Leadership and Analyst Meet


Our Clients
Latest Reports
- United Kingdom (UK) Long-term Care Insurance Market (2026-2032) | Growth, Share, Consumer Insights, Drivers, Opportunities, Competition, Pricing Analysis, Segments, Restraints, Companies, Competitive, Value, Outlook, Size, Demand, Analysis, Challenges, Strategic Insights, Investment Trends, Revenue, Trends, Supply, Forecast
- United Kingdom (UK) Long Term Care Market (2026-2032) | Companies, Outlook, Analysis, Trends, Value, Revenue, Segmentation, Share, Forecast, Competitive Landscape, Growth, Size & Forecast
- Iraq Insulation and Waterproofing Market (2026-2032) | Outlook, Drivers, Growth, Size, Share, Industry, Revenue, Trends, Demand, Competitive, Strategic Insights, Opportunities, Segments, Companies, Challenges, Strategy, Consumer Insights, Analysis, Investment Trends, Value, Segmentation, Forecast, Restraints
- India Switchgear Market Outlook (2026 - 2032) | Size, Share, Trends, Growth, Revenue, Forecast, Analysis, Value, Outlook
- Pakistan Contraceptive Implants Market (2025-2031) | Demand, Growth, Size, Share, Industry, Pricing Analysis, Competitive, Strategic Insights, Strategy, Consumer Insights, Analysis, Investment Trends, Opportunities, Revenue, Segments, Value, Segmentation, Supply, Forecast, Restraints, Outlook, Competition, Drivers, Trends, Companies, Challenges
- Sri Lanka Packaging Market (2026-2032) | Outlook, Competition, Drivers, Trends, Demand, Pricing Analysis, Competitive, Strategic Insights, Companies, Challenges, Strategy, Consumer Insights, Analysis, Investment Trends, Opportunities, Growth, Size, Share, Industry, Revenue, Segments, Value, Segmentation, Supply, Forecast, Restraints
- India Kids Watches Market (2026-2032) | Strategy, Consumer Insights, Analysis, Investment Trends, Opportunities, Growth, Size, Share, Industry, Revenue, Segments, Value, Segmentation, Supply, Forecast, Restraints, Outlook, Competition, Drivers, Trends, Demand, Pricing Analysis, Competitive, Strategic Insights, Companies, Challenges
- Saudi Arabia Core Assurance Service Market (2025-2031) | Strategy, Consumer Insights, Analysis, Investment Trends, Opportunities, Growth, Size, Share, Industry, Revenue, Segments, Value, Segmentation, Supply, Forecast, Restraints, Outlook, Competition, Drivers, Trends, Demand, Pricing Analysis, Competitive, Strategic Insights, Companies, Challenges
- Romania Uninterruptible Power Supply (UPS) Market (2026-2032) | Industry, Analysis, Revenue, Size, Forecast, Outlook, Value, Trends, Share, Growth & Companies
- Saudi Arabia Car Window Tinting Film, Paint Protection Film (PPF), and Ceramic Coating Market (2025-2031) | Strategy, Consumer Insights, Analysis, Investment Trends, Opportunities, Growth, Size, Share, Industry, Revenue, Segments, Value, Segmentation, Supply, Forecast, Restraints, Outlook, Competition, Drivers, Trends, Demand, Pricing Analysis, Competitive, Strategic Insights, Companies, Challenges
Industry Events and Analyst Meet

India EV Show 2026

EV tech India Expo 2026

Auto Tech Asia 2026

Battery Tech India 2026

Smart Production Solutions Guangzhou 2026
Whitepaper
- Middle East & Africa Commercial Security Market Click here to view more.
- Middle East & Africa Fire Safety Systems & Equipment Market Click here to view more.
- GCC Drone Market Click here to view more.
- Middle East Lighting Fixture Market Click here to view more.
- GCC Physical & Perimeter Security Market Click here to view more.
6WResearch In News
- Doha a strategic location for EV manufacturing hub: IPA Qatar
- Demand for luxury TVs surging in the GCC, says Samsung
- Empowering Growth: The Thriving Journey of Bangladesh’s Cable Industry
- Demand for luxury TVs surging in the GCC, says Samsung
- Video call with a traditional healer? Once unthinkable, it’s now common in South Africa
- Intelligent Buildings To Smooth GCC’s Path To Net Zero