Tanzania Carbon Market (2020-2026) | Revenue, Trends, Size, Share, Forecast, Outlook, Growth, Companies, Analysis, Industry, Value & COVID-19 IMPACT
Market Forecast By Product Types (Amorphous Carbon, Graphite, Diamond), By Applications (Automotive, Construction, Engineering Industries, Aerospace, Others) And Competitive Landscape
| Product Code: ETC004159 | Publication Date: Sep 2020 | Updated Date: Apr 2025 | Product Type: Report | |
| Publisher: 6Wresearch | No. of Pages: 70 | No. of Figures: 35 | No. of Tables: 5 | |
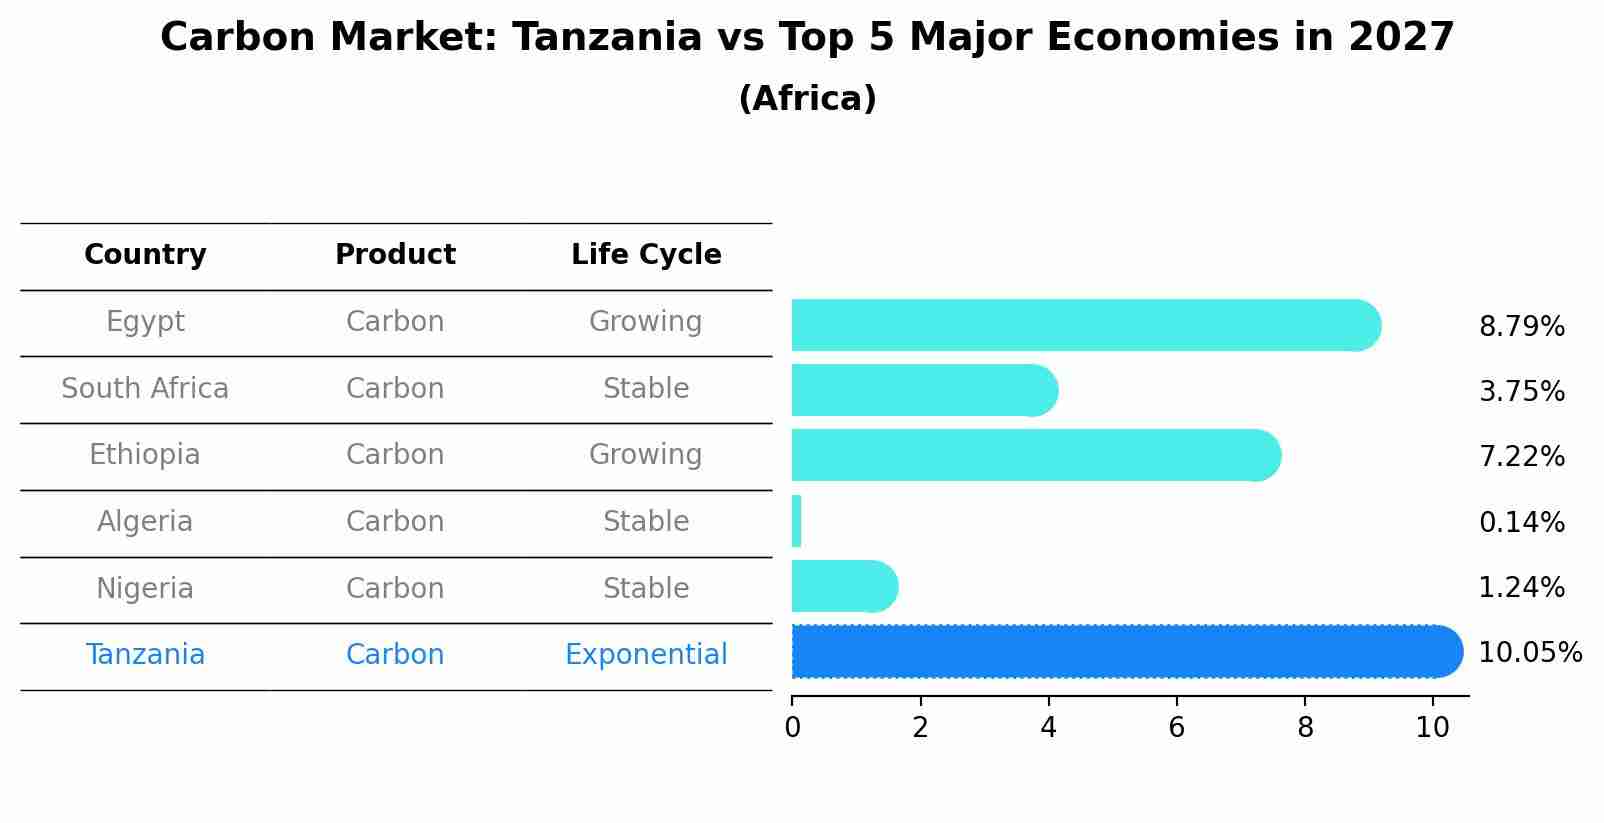
Carbon Market: Tanzania vs Top 5 Major Economies in 2027 (Africa)
Tanzania's Carbon market is anticipated to experience a high growth rate of 10.05% by 2027, reflecting trends observed in the largest economy Egypt, followed by South Africa, Ethiopia, Algeria and Nigeria.
Key Highlights of the Report:
- Tanzania Carbon Market Overview
- Tanzania Carbon Market Outlook
- Market Size of Tanzania Carbon Market, 2019
- Forecast of Tanzania Carbon Market, 2026
- Historical Data and Forecast of Tanzania Carbon Revenues & Volume for the Period 2016 - 2026
- Tanzania Carbon Market Trend Evolution
- Tanzania Carbon Market Drivers and Challenges
- Tanzania Carbon Price Trends
- Tanzania Carbon Porter's Five Forces
- Tanzania Carbon Industry Life Cycle
- Historical Data and Forecast of Tanzania Carbon Market Revenues & Volume By Product Types for the Period 2016 - 2026
- Historical Data and Forecast of Tanzania Carbon Market Revenues & Volume By Amorphous Carbon for the Period 2016 - 2026
- Historical Data and Forecast of Tanzania Carbon Market Revenues & Volume By Graphite for the Period 2016 - 2026
- Historical Data and Forecast of Tanzania Carbon Market Revenues & Volume By Diamond for the Period 2016 - 2026
- Historical Data and Forecast of Tanzania Carbon Market Revenues & Volume By Applications for the Period 2016 - 2026
- Historical Data and Forecast of Tanzania Carbon Market Revenues & Volume By Automotive for the Period 2016 - 2026
- Historical Data and Forecast of Tanzania Carbon Market Revenues & Volume By Construction for the Period 2016 - 2026
- Historical Data and Forecast of Tanzania Carbon Market Revenues & Volume By Engineering Industries for the Period 2016 - 2026
- Historical Data and Forecast of Tanzania Carbon Market Revenues & Volume By Aerospace for the Period 2016 - 2026
- Historical Data and Forecast of Tanzania Carbon Market Revenues & Volume By Others for the Period 2016 - 2026
- Tanzania Carbon Import Export Trade Statistics
- Market Opportunity Assessment By Product Types
- Market Opportunity Assessment By Applications
- Tanzania Carbon Top Companies Market Share
- Tanzania Carbon Competitive Benchmarking By Technical and Operational Parameters
- Tanzania Carbon Company Profiles
- Tanzania Carbon Key Strategic Recommendations
Frequently Asked Questions About the Market Study (FAQs):
6Wresearch actively monitors the Tanzania Carbon Market and publishes its comprehensive annual report, highlighting emerging trends, growth drivers, revenue analysis, and forecast outlook. Our insights help businesses to make data-backed strategic decisions with ongoing market dynamics. Our analysts track relevent industries related to the Tanzania Carbon Market, allowing our clients with actionable intelligence and reliable forecasts tailored to emerging regional needs.
Yes, we provide customisation as per your requirements. To learn more, feel free to contact us on sales@6wresearch.com
| Table of Contents |
| 1. Executive Summary |
| 2. Introduction |
| 2.1. Key Highlights of the Report |
| 2.2. Report Description |
| 2.3. Market Scope & Segmentation |
| 2.4. Research Methodology |
| 2.5. Assumptions |
| 3. Tanzania Carbon Market Overview |
| 3.1. Tanzania Country Macro Economic Indicators |
| 3.2. Tanzania Carbon Market Revenues & Volume, 2019 & 2026F |
| 3.3. Tanzania Carbon Market - Industry Life Cycle |
| 3.4. Tanzania Carbon Market - Porter's Five Forces |
| 3.5. Tanzania Carbon Market Revenues & Volume Share, By Product Types, 2019 & 2026F |
| 3.6. Tanzania Carbon Market Revenues & Volume Share, By Applications, 2019 & 2026F |
| 4. Tanzania Carbon Market Dynamics |
| 4.1. Impact Analysis |
| 4.2. Market Drivers |
| 4.3. Market Restraints |
| 5. Tanzania Carbon Market Trends |
| 6. Tanzania Carbon Market, By Types |
| 6.1. Tanzania Carbon Market, By Product Types |
| 6.1.1 Overview and Analysis |
| 6.1.2. Tanzania Carbon Market Revenues & Volume, By Product Types, 2016 - 2026F |
| 6.1.3. Tanzania Carbon Market Revenues & Volume, By Amorphous Carbon, 2016 - 2026F |
| 6.1.4. Tanzania Carbon Market Revenues & Volume, By Graphite, 2016 - 2026F |
| 6.1.5. Tanzania Carbon Market Revenues & Volume, By Diamond, 2016 - 2026F |
| 6.2. Tanzania Carbon Market, By Applications |
| 6.2.1. Overview and Analysis |
| 6.2.2. Tanzania Carbon Market Revenues & Volume, By Automotive, 2016 - 2026F |
| 6.2.3. Tanzania Carbon Market Revenues & Volume, By Construction, 2016 - 2026F |
| 6.2.4. Tanzania Carbon Market Revenues & Volume, By Engineering Industries, 2016 - 2026F |
| 6.2.5. Tanzania Carbon Market Revenues & Volume, By Aerospace, 2016 - 2026F |
| 6.2.6. Tanzania Carbon Market Revenues & Volume, By Others, 2016 - 2026F |
| 7. Tanzania Carbon Market Import-Export Trade Statistics |
| 7.1 Tanzania Carbon Market Export to Major Countries |
| 7.2. Tanzania Carbon Market Imports from Major Countries |
| 8. Tanzania Carbon Market Key Performance Indicators |
| 9. Tanzania Carbon Market - Opportunity Assessment |
| 9.1. Tanzania Carbon Market Opportunity Assessment, By Product Types, 2019 & 2026F |
| 9.2. Tanzania Carbon Market Opportunity Assessment, By Applications, 2019 & 2026F |
| 10. Tanzania Carbon Market - Competitive Landscape |
| 10.1. Tanzania Carbon Market Revenue Share, By Companies, 2019 |
| 10.2. Tanzania Carbon Market Competitive Benchmarking, By Operating and Technical Parameters |
| 11. Company Profiles |
| 12. Recommendations |
| 13. Disclaimer |
Pricing
- Single User License$ 1,995
- Department License$ 2,400
- Site License$ 3,120
- Global License$ 3,795

Search
Related Reports
- Australia IT Asset Disposal Market (2025-2031) | Strategy, Consumer Insights, Analysis, Investment Trends, Opportunities, Growth, Size, Share, Industry, Revenue, Segments, Value, Segmentation, Supply, Forecast, Restraints, Outlook, Competition, Drivers, Trends, Demand, Pricing Analysis, Competitive, Strategic Insights, Companies, Challenges
- UAE Building Thermal Insulation Market Outlook (2025-2031) | Revenue, Companies, Share, Trends, Growth, Size, Forecast, Industry, Analysis & Value
- Portugal Electronic Document Management Market (2025-2031) | Strategy, Consumer Insights, Analysis, Investment Trends, Opportunities, Growth, Size, Share, Industry, Revenue, Segments, Value, Segmentation, Supply, Forecast, Restraints, Outlook, Competition, Drivers, Trends, Demand, Pricing Analysis, Competitive, Strategic Insights, Companies, Challenges
- France Electronic Document Management Market (2025-2031) | Strategy, Consumer Insights, Analysis, Investment Trends, Opportunities, Growth, Size, Share, Industry, Revenue, Segments, Value, Segmentation, Supply, Forecast, Restraints, Outlook, Competition, Drivers, Trends, Demand, Pricing Analysis, Competitive, Strategic Insights, Companies, Challenges
- Portugal Occupational Health & Safety Services Market (2025-2031) | Strategy, Consumer Insights, Analysis, Investment Trends, Opportunities, Growth, Size, Share, Industry, Revenue, Segments, Value, Segmentation, Supply, Forecast, Restraints, Outlook, Competition, Drivers, Trends, Demand, Pricing Analysis, Competitive, Strategic Insights, Companies, Challenges
- Netherlands Occupational Health and Safety Services Market (2025-2031) | Strategy, Consumer Insights, Analysis, Investment Trends, Opportunities, Growth, Size, Share, Industry, Revenue, Segments, Value, Segmentation, Supply, Forecast, Restraints, Outlook, Competition, Drivers, Trends, Demand, Pricing Analysis, Competitive, Strategic Insights, Companies, Challenges
- Belgium and Luxembourg Facility Management Market (2025-2031) | Strategy, Consumer Insights, Analysis, Investment Trends, Opportunities, Growth, Size, Share, Industry, Revenue, Segments, Value, Segmentation, Supply, Forecast, Restraints, Outlook, Competition, Drivers, Trends, Demand, Pricing Analysis, Competitive, Strategic Insights, Companies, Challenges
- Russia Women Intimate Apparel Market (2025-2031) | Strategy, Consumer Insights, Analysis, Investment Trends, Opportunities, Growth, Size, Share, Industry, Revenue, Segments, Value, Segmentation, Supply, Forecast, Restraints, Outlook, Competition, Drivers, Trends, Demand, Pricing Analysis, Competitive, Strategic Insights, Companies, Challenges
- Africa Chocolate Market (2025-2031) | Size, Share, Trends, Growth, Revenue, Analysis, Forecast, industry & Outlook
- Global Hydroxychloroquine And Chloroquine Market (2025-2031) | Industry, Trends, Size, Outlook, Growth, Value, Companies, Revenue, Analysis, Share, Forecast
Industry Events and Analyst Meet

Industrial Facilities Management Expo 2025

4th Edition India Energy Conclave 2025

Media Expo 2025

Gas India Expo 2025

Consumer Electronics World Expo 2025
Our Clients
Whitepaper
- Middle East & Africa Commercial Security Market Click here to view more.
- Middle East & Africa Fire Safety Systems & Equipment Market Click here to view more.
- GCC Drone Market Click here to view more.
- Middle East Lighting Fixture Market Click here to view more.
- GCC Physical & Perimeter Security Market Click here to view more.
6WResearch In News
- Doha a strategic location for EV manufacturing hub: IPA Qatar
- Demand for luxury TVs surging in the GCC, says Samsung
- Empowering Growth: The Thriving Journey of Bangladesh’s Cable Industry
- Demand for luxury TVs surging in the GCC, says Samsung
- Video call with a traditional healer? Once unthinkable, it’s now common in South Africa
- Intelligent Buildings To Smooth GCC’s Path To Net Zero