Tanzania Coal Briquettes Market (2026-2032) Outlook | Revenue, Forecast, Industry, Companies, Value, Analysis, Trends, Growth, Size & Share
Market Forecast By Appearance (Pillow Shaped, Hexagonal Shaped, Round Shaped, Square Shaped), By Composition (Wood Charcoal, Coal Dust, Peat & Paper, Saw Dust, Wood chips), By Application (Industrial, Food Preparation) And Competitive Landscape
| Product Code: ETC234055 | Publication Date: Aug 2022 | Updated Date: Jul 2026 | Product Type: Market Research Report | |
| Publisher: 6Wresearch | Author: Vasudha | No. of Pages: 75 | No. of Figures: 35 | No. of Tables: 20 |
Tanzania Coal Briquettes Market Size, Share & Growth Rate
The Tanzania Coal Briquettes Market was estimated at USD 358 Million in 2025 and is projected to reach USD 443 Million by 2032, growing at a CAGR of 3.1% from 2026 to 2032. This growth trajectory is being propelled by a confluence of factors, including a heightened demand for alternative energy sources and increased public awareness surrounding the environmental advantages of coal briquettes. Additionally, government initiatives aimed at promoting cleaner fuels are further bolstering market momentum, as consumers seek affordable and sustainable energy solutions.
Tanzania Coal Briquettes Market Year-wise Growth Rate and Key Drivers
This graph highlights how the Tanzania Coal Briquettes Market has steadily grown over the years, supported by major growth factors.
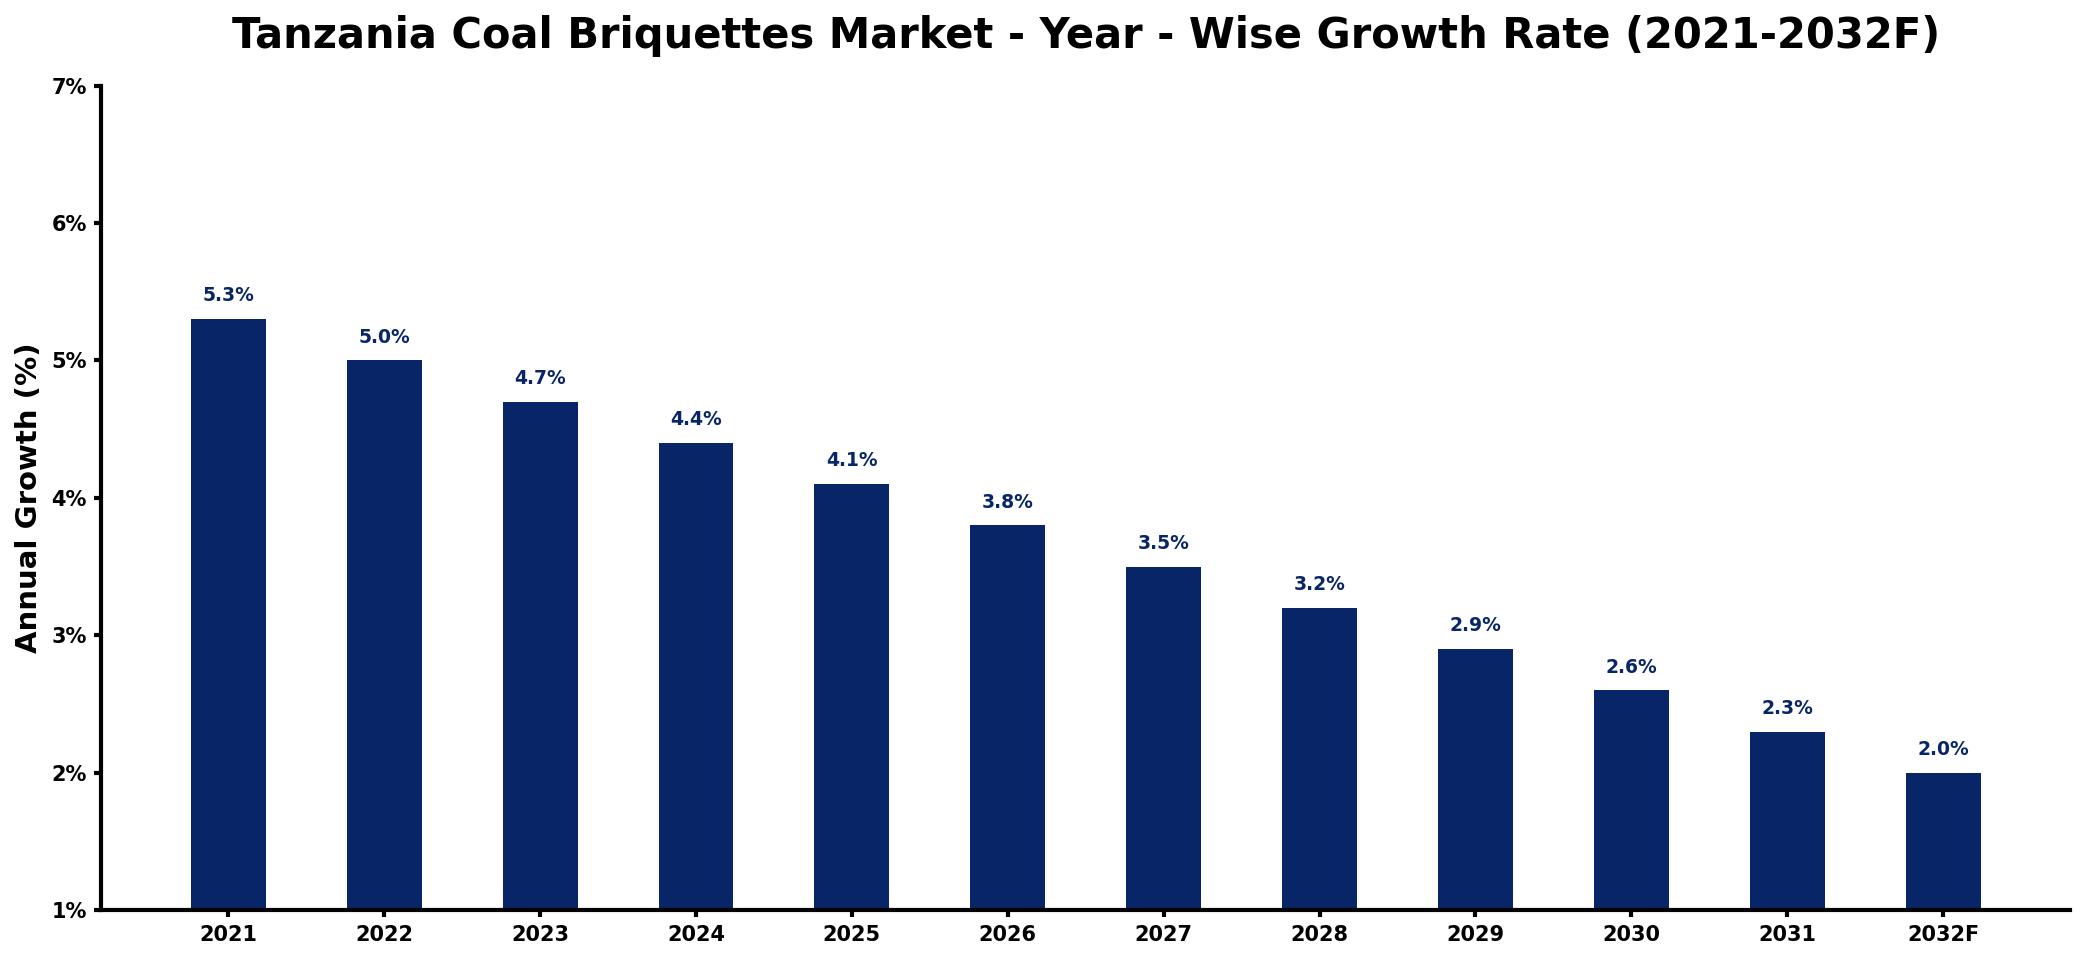
The table below presents the year‑wise growth rates along with the key drivers influencing the market
| Year | Growth Rate | Major Drivers |
| 2021 | 5.3% | Increased energy demand growth |
| 2022 | 5.0% | Rising investment in renewables |
| 2023 | 4.7% | Expansion of distribution networks |
| 2024 | 4.4% | Growing urban population needs |
| 2025 | 4.1% | Enhanced domestic production capacity |
| 2026 | 3.8% | Strengthened regional trade agreements |
| 2027 | 3.5% | Higher consumer awareness initiatives |
| 2028 | 3.2% | Emerging industrial applications rise |
| 2029 | 2.9% | Increased government policy support |
| 2030 | 2.6% | Expanding market access opportunities |
| 2031 | 2.3% | Diversification of energy sources |
| 2032 | 2.0% | Strengthened sustainability practices adoption |
Note: Market size estimations and growth projections presented in this report are based on 6Wresearch's proprietary forecasting methodology, utilizing the latest available industry data, government publications, and primary research inputs.
Tanzania Coal Briquettes Market Synopsis
The strongest force currently shaping the Tanzania Coal Briquettes Market is the collective push for cleaner energy alternatives to traditional fuel sources. With an increasing focus on reducing deforestation and air pollution, coal briquettes are rapidly emerging as a viable option for both urban and rural households. This transition is supported by significant government interventions, including policies designed to encourage the adoption of cleaner fuels.
As consumer awareness of the advantages of coal briquettes grows, there is a notable shift away from conventional charcoal and firewood. This trend is not only evident in urban centers but is also taking root in rural areas where access to cleaner cooking solutions has historically been limited. Thus, the market is positioned for robust growth, as more households recognize the long-term benefits of adopting coal briquettes.
Tanzania Coal Briquettes Market Key Takeaways
- The market is set for steady growth, driven by increasing demand for alternative energy sources.
- Government initiatives aimed at promoting clean energy play a significant role in market expansion.
- Coal briquettes offer a more sustainable and eco-friendly alternative to traditional charcoal.
- Challenges such as limited awareness and inconsistent quality standards hinder faster adoption.
- Opportunities exist for investment in production facilities and marketing strategies targeting eco-conscious consumers.
Evaluation of Restraints in Tanzania Coal Briquettes Market
Despite the favorable market conditions, the Tanzania Coal Briquettes Market faces some significant restraints. A notable barrier is the limited awareness and acceptance of coal briquettes among consumers, particularly in rural areas. Many still rely on traditional fuels due to ingrained habits and a lack of understanding of the benefits offered by briquettes. Moreover, inadequate infrastructure for production and distribution poses challenges for manufacturers, affecting product availability and market penetration. Further complicating the landscape is competition from other renewable energy sources, which could divert potential users away from coal briquettes. To counter these issues, comprehensive awareness campaigns and strategic investments in infrastructure are essential.
Tanzania Coal Briquettes Market Trends
The current trends in the Tanzania Coal Briquettes Market reveal a significant shift towards sustainable energy solutions, as consumers prioritize eco-friendliness and efficiency. Innovations in product offerings, including improved briquette quality and enhanced packaging, are gaining traction. Additionally, marketing strategies are evolving to emphasize the environmental benefits of switching from traditional fuels, effectively targeting environmentally conscious consumers. This trend reflects a broader societal shift towards sustainability and may redefine cooking practices across the nation.
Tanzania Coal Briquettes Market Opportunities
Investment opportunities in the Tanzania Coal Briquettes Market are becoming increasingly attractive, particularly due to the government's commitment to renewable energy solutions. Investors can find viable prospects in establishing production facilities that cater to both domestic and export markets. Collaborations with local communities for sustainable sourcing of raw materials not only enhance supply chains but also contribute to community development. As demand continues to rise, especially in light of rising traditional fuel prices, strategic marketing initiatives can attract a broader consumer base, thereby driving market growth.
Government Initiatives in the Tanzania Coal Briquettes Market
The Tanzanian government has enacted several initiatives to bolster the coal briquettes market as part of its broader commitment to clean energy and environmental sustainability. Policies implemented to ban the use of charcoal in urban centers have effectively paved the way for the adoption of coal briquettes as a cleaner alternative. The government also offers various subsidies and financial incentives to manufacturers, fostering an environment conducive to innovation and market growth. These proactive measures are designed to help Tanzania achieve its energy security goals while combating deforestation and air pollution.
Future Insights of the Tanzania Coal Briquettes Market
Looking ahead to 2026-2032, the Tanzania Coal Briquettes Market is poised for steady growth. With an increasing recognition of the environmental impact of traditional fuel sources, more households are expected to transition to coal briquettes. Government policies aimed at reducing deforestation will continue to support this shift. Additionally, rising prices of conventional cooking fuels are likely to push consumers towards more economical options like coal briquettes. Overall, the market outlook is optimistic as it aligns with the global move toward sustainable energy solutions.
Tanzania Coal Briquettes Market Latest Developments (2025 - 2026)
In recent months, the Tanzania Coal Briquettes Market has experienced notable developments in terms of product innovations and marketing strategies. Various stakeholders are actively exploring new technologies to enhance the quality of briquettes, focusing on creating more efficient and environmentally friendly products. Additionally, several initiatives have emerged to improve distribution networks, making coal briquettes more accessible to consumers across both urban and rural areas. These advancements signify a promising direction for the market as it continues to evolve.
Tanzania Coal Briquettes Market - Key Attractiveness of the Report
- 10 Years of Market Numbers
- Historical Data Starting from 2022 to 2025
- Base Year: 2025
- Forecast Data until 2032
- Key Performance Indicators Impacting the Market
- Major Upcoming Developments and Projects
Key Highlights of the Report:
- Tanzania Coal Briquettes Market Outlook
- Market Size of Tanzania Coal Briquettes Market, 2025
- Forecast of Tanzania Coal Briquettes Market, 2032
- Historical Data and Forecast of Tanzania Coal Briquettes Revenues & Volume for the Period 2022-2032F
- Tanzania Coal Briquettes Market Trend Evolution
- Tanzania Coal Briquettes Market Drivers and Challenges
- Tanzania Coal Briquettes Price Trends
- Tanzania Coal Briquettes Porter's Five Forces
- Tanzania Coal Briquettes Industry Life Cycle
- Historical Data and Forecast of Tanzania Coal Briquettes Market Revenues & Volume By Appearance for the Period 2022-2032F
- Historical Data and Forecast of Tanzania Coal Briquettes Market Revenues & Volume By Pillow Shaped for the Period 2022-2032F
- Historical Data and Forecast of Tanzania Coal Briquettes Market Revenues & Volume By Hexagonal Shaped for the Period 2022-2032F
- Historical Data and Forecast of Tanzania Coal Briquettes Market Revenues & Volume By Round Shaped for the Period 2022-2032F
- Historical Data and Forecast of Tanzania Coal Briquettes Market Revenues & Volume By Square Shaped for the Period 2022-2032F
- Historical Data and Forecast of Tanzania Coal Briquettes Market Revenues & Volume By Composition for the Period 2022-2032F
- Historical Data and Forecast of Tanzania Coal Briquettes Market Revenues & Volume By Wood Charcoal for the Period 2022-2032F
- Historical Data and Forecast of Tanzania Coal Briquettes Market Revenues & Volume By Coal Dust for the Period 2022-2032F
- Historical Data and Forecast of Tanzania Coal Briquettes Market Revenues & Volume By Peat & Paper for the Period 2022-2032F
- Historical Data and Forecast of Tanzania Coal Briquettes Market Revenues & Volume By Saw Dust for the Period 2022-2032F
- Historical Data and Forecast of Tanzania Coal Briquettes Market Revenues & Volume By Wood chips for the Period 2022-2032F
- Historical Data and Forecast of Tanzania Coal Briquettes Market Revenues & Volume By Application for the Period 2022-2032F
- Historical Data and Forecast of Tanzania Coal Briquettes Market Revenues & Volume By Industrial for the Period 2022-2032F
- Historical Data and Forecast of Tanzania Coal Briquettes Market Revenues & Volume By Food Preparation for the Period 2022-2032F
- Tanzania Coal Briquettes Import Export Trade Statistics
- Market Opportunity Assessment By Appearance
- Market Opportunity Assessment By Composition
- Market Opportunity Assessment By Application
- Tanzania Coal Briquettes Top Companies Market Share
- Tanzania Coal Briquettes Competitive Benchmarking By Technical and Operational Parameters
- Tanzania Coal Briquettes Company Profiles
- Tanzania Coal Briquettes Key Strategic Recommendations
Frequently Asked Questions About the Market Study (FAQs):
The Tanzania Coal Briquettes Market is projected to grow from an estimated USD 358 Million in 2025 to USD 443 Million by 2032, reflecting a CAGR of 3.1% during the forecast period from 2026 to 2032.
Coal briquettes offer higher energy efficiency, lower smoke emissions, and a reduced environmental impact compared to conventional charcoal and firewood, making them a more sustainable option for consumers.
The Tanzanian government has implemented various policies, including a ban on charcoal use in urban areas and financial incentives for manufacturers, to promote cleaner energy and foster the adoption of coal briquettes.
Manufacturers encounter challenges like limited consumer awareness about briquettes, inadequate infrastructure for production and distribution, and competition from other renewable energy sources.
There is a growing trend among consumers, both in urban and rural areas, to shift towards coal briquettes due to their affordability and environmental benefits, significantly affecting market demand.
6Wresearch actively monitors the Tanzania Coal Briquettes Market and publishes its comprehensive annual report, highlighting emerging trends, growth drivers, revenue analysis, and forecast outlook. Our insights help businesses to make data-backed strategic decisions with ongoing market dynamics. Our analysts track relevent industries related to the Tanzania Coal Briquettes Market, allowing our clients with actionable intelligence and reliable forecasts tailored to emerging regional needs.
Yes, we provide customisation as per your requirements. To learn more, feel free to contact us on sales@6wresearch.com
1 Executive Summary |
2 Introduction |
2.1 Key Highlights of the Report |
2.2 Report Description |
2.3 Market Scope & Segmentation |
2.4 Research Methodology |
2.5 Assumptions |
3 Tanzania Coal Briquettes Market Overview |
3.1 Tanzania Country Macro Economic Indicators |
3.2 Tanzania Coal Briquettes Market Revenues & Volume, 2022 & 2032F |
3.3 Tanzania Coal Briquettes Market - Industry Life Cycle |
3.4 Tanzania Coal Briquettes Market - Porter's Five Forces |
3.5 Tanzania Coal Briquettes Market Revenues & Volume Share, By Appearance, 2022 & 2032F |
3.6 Tanzania Coal Briquettes Market Revenues & Volume Share, By Composition, 2022 & 2032F |
3.7 Tanzania Coal Briquettes Market Revenues & Volume Share, By Application, 2022 & 2032F |
4 Tanzania Coal Briquettes Market Dynamics |
4.1 Impact Analysis |
4.2 Market Drivers |
4.2.1 Increasing awareness and demand for cleaner and more sustainable energy sources |
4.2.2 Government initiatives promoting the use of renewable energy and reducing deforestation |
4.2.3 Rising prices of traditional cooking fuels like firewood and charcoal |
4.3 Market Restraints |
4.3.1 Lack of infrastructure for production, distribution, and marketing of coal briquettes |
4.3.2 Competition from other alternative fuels like LPG and solar energy |
4.3.3 Inconsistent quality and availability of raw materials for briquette production |
5 Tanzania Coal Briquettes Market Trends |
6 Tanzania Coal Briquettes Market, By Types |
6.1 Tanzania Coal Briquettes Market, By Appearance |
6.1.1 Overview and Analysis |
6.1.2 Tanzania Coal Briquettes Market Revenues & Volume, By Appearance, 2022-2032F |
6.1.3 Tanzania Coal Briquettes Market Revenues & Volume, By Pillow Shaped, 2022-2032F |
6.1.4 Tanzania Coal Briquettes Market Revenues & Volume, By Hexagonal Shaped, 2022-2032F |
6.1.5 Tanzania Coal Briquettes Market Revenues & Volume, By Round Shaped, 2022-2032F |
6.1.6 Tanzania Coal Briquettes Market Revenues & Volume, By Square Shaped, 2022-2032F |
6.2 Tanzania Coal Briquettes Market, By Composition |
6.2.1 Overview and Analysis |
6.2.2 Tanzania Coal Briquettes Market Revenues & Volume, By Wood Charcoal, 2022-2032F |
6.2.3 Tanzania Coal Briquettes Market Revenues & Volume, By Coal Dust, 2022-2032F |
6.2.4 Tanzania Coal Briquettes Market Revenues & Volume, By Peat & Paper, 2022-2032F |
6.2.5 Tanzania Coal Briquettes Market Revenues & Volume, By Saw Dust, 2022-2032F |
6.2.6 Tanzania Coal Briquettes Market Revenues & Volume, By Wood chips, 2022-2032F |
6.3 Tanzania Coal Briquettes Market, By Application |
6.3.1 Overview and Analysis |
6.3.2 Tanzania Coal Briquettes Market Revenues & Volume, By Industrial, 2022-2032F |
6.3.3 Tanzania Coal Briquettes Market Revenues & Volume, By Food Preparation, 2022-2032F |
7 Tanzania Coal Briquettes Market Import-Export Trade Statistics |
7.1 Tanzania Coal Briquettes Market Export to Major Countries |
7.2 Tanzania Coal Briquettes Market Imports from Major Countries |
8 Tanzania Coal Briquettes Market Key Performance Indicators |
8.1 Percentage of households using coal briquettes as a primary cooking fuel |
8.2 Number of government policies supporting the use of coal briquettes in Tanzania |
8.3 Investment in research and development for improving coal briquette production efficiency |
9 Tanzania Coal Briquettes Market - Opportunity Assessment |
9.1 Tanzania Coal Briquettes Market Opportunity Assessment, By Appearance, 2022 & 2032F |
9.2 Tanzania Coal Briquettes Market Opportunity Assessment, By Composition, 2022 & 2032F |
9.3 Tanzania Coal Briquettes Market Opportunity Assessment, By Application, 2022 & 2032F |
10 Tanzania Coal Briquettes Market - Competitive Landscape |
10.1 Tanzania Coal Briquettes Market Revenue Share, By Companies, 2025 |
10.2 Tanzania Coal Briquettes Market Competitive Benchmarking, By Operating and Technical Parameters |
11 Company Profiles |
12 Recommendations |
13 Disclaimer |
Global Go To Market Strategy - 2030
Export potential enables firms to identify high-growth global markets with greater confidence by combining advanced trade intelligence with a structured quantitative methodology. The framework analyzes emerging demand trends and country-level import patterns while integrating macroeconomic and trade datasets such as GDP and population forecasts, bilateral import–export flows, tariff structures, elasticity differentials between developed and developing economies, geographic distance, and import demand projections. Using weighted trade values from 2020–2024 as the base period to project country-to-country export potential for 2030, these inputs are operationalized through calculated drivers such as gravity model parameters, tariff impact factors, and projected GDP per-capita growth. Through an analysis of hidden potentials, demand hotspots, and market conditions that are most favorable to success, this method enables firms to focus on target countries, maximize returns, and global expansion with data, backed by accuracy.
By factoring in the projected importer demand gap that is currently unmet and could be potential opportunity, it identifies the potential for the Exporter (Country) among 190 countries, against the general trade analysis, which identifies the biggest importer or exporter.
To discover high-growth global markets and optimize your business strategy:
Click Here
Pricing
- Single User License$ 1,995
- Department License$ 2,400
- Site License$ 3,120
- Global License$ 3,795

Leadership Perspectives from Industry Events
Search
Thought Leadership and Analyst Meet


Our Clients
6WResearch In News
- India Air Conditioner Market Set for Strong Rebound in 2026 After Weather-Led Correction and GST-Driven Recovery: 6Wresearch
- ADAS in India: How Automatic Emergency Braking, Blind Spot Detection & Driver Monitoring are Transforming Road Safety
- Doha a strategic location for EV manufacturing hub: IPA Qatar
- Demand for luxury TVs surging in the GCC, says Samsung
- Empowering Growth: The Thriving Journey of Bangladesh’s Cable Industry
- Demand for luxury TVs surging in the GCC, says Samsung
Latest Reports
- Nicaragua RPG Gaming Market (2026-2032)
- New Zealand RPG Gaming Market (2026-2032)
- Netherlands RPG Gaming Market (2026-2032)
- Nauru RPG Gaming Market (2026-2032)
- Namibia RPG Gaming Market (2026-2032)
- Mozambique RPG Gaming Market (2026-2032)
- Montenegro RPG Gaming Market (2026-2032)
- Mongolia RPG Gaming Market (2026-2032)
- Monaco RPG Gaming Market (2026-2032)
- Micronesia RPG Gaming Market (2026-2032)
Industry Events and Analyst Meet

EV India Expo 2026

HIMTEX 2026

India Refining Summit 2026

India EV Show 2026

EV tech India Expo 2026
Whitepaper
- Middle East & Africa Commercial Security Market Click here to view more.
- Middle East & Africa Fire Safety Systems & Equipment Market Click here to view more.
- GCC Drone Market Click here to view more.
- Middle East Lighting Fixture Market Click here to view more.
- GCC Physical & Perimeter Security Market Click here to view more.