Tanzania Dicyandiamide Market (2025-2031) | Industry, Analysis, Revenue, Forecast, Value, Share, Trends, Growth, Companies, Segmentation, Size & Outlook
Market Forecast By Grade (Electronic grade, Industrial grade, Pharmaceutical grade), By Application (Pharmaceuticals, Epoxy laminates, Textile & dyeing auxiliaries, Water treatment, Flame retardants, Fertilizers, Others) And Competitive Landscape
| Product Code: ETC4760854 | Publication Date: Nov 2023 | Updated Date: Sep 2025 | Product Type: Market Research Report | |
| Publisher: 6Wresearch | Author: Sachin Kumar Rai | No. of Pages: 60 | No. of Figures: 30 | No. of Tables: 5 |
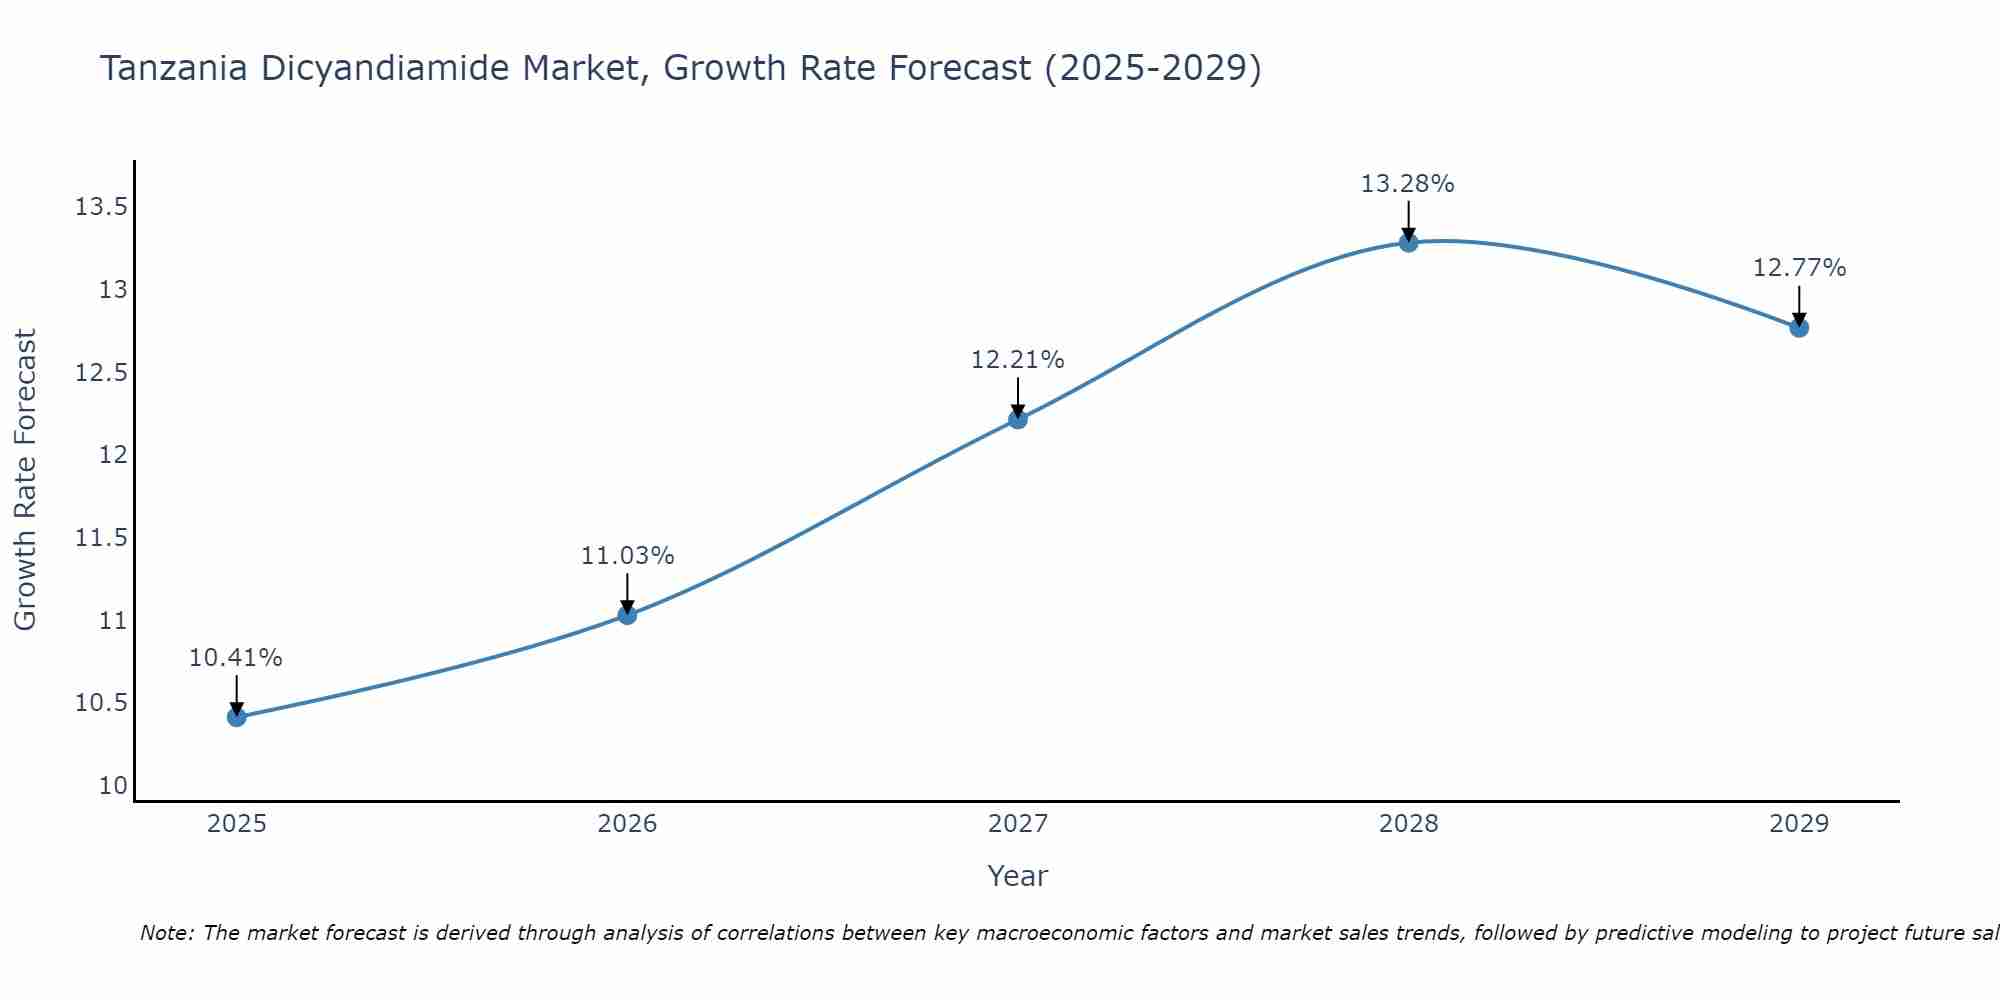
Tanzania Dicyandiamide Market Size Growth Rate
The Tanzania Dicyandiamide Market is projected to witness mixed growth rate patterns during 2025 to 2029. Growth accelerates to 13.28% in 2028, following an initial rate of 10.41%, before easing to 12.77% at the end of the period.
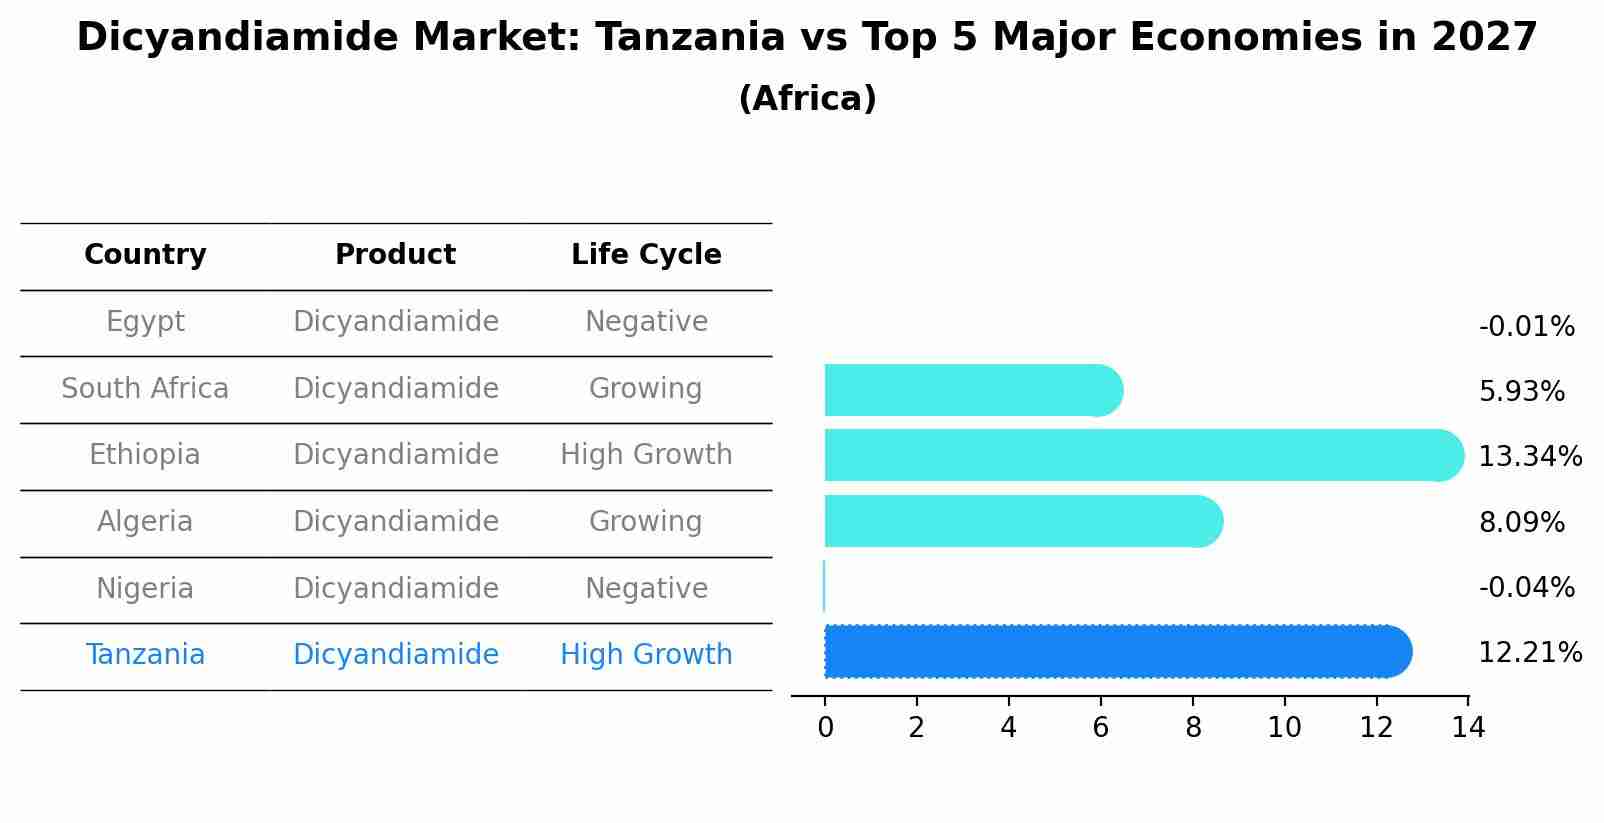
Dicyandiamide Market: Tanzania vs Top 5 Major Economies in 2027 (Africa)
By 2027, the Dicyandiamide market in Tanzania is anticipated to reach a growth rate of 12.21%, as part of an increasingly competitive Africa region, where Egypt remains at the forefront, supported by South Africa, Ethiopia, Algeria and Nigeria, driving innovations and market adoption across sectors.
Tanzania Dicyandiamide Market Overview
Dicyandiamide is used in the production of fertilizers, pharmaceuticals, and adhesives. The Tanzania Dicyandiamide Market supplies this versatile chemical to various industries, contributing to agricultural productivity and industrial manufacturing.
Drivers of the market
The expanding agricultural sector and increasing demand for water treatment chemicals drive the dicyandiamide market in Tanzania. Dicyandiamide`s application as a nitrogen stabilizer in fertilizers and its role in wastewater treatment processes contribute to its growing demand, supporting market expansion.
Challenges of the market
Challenges in the Tanzania Dicyandiamide market include ensuring purity and consistency of dicyandiamide products, managing environmental impacts of production processes, and addressing regulatory compliance for chemical manufacturing. Developing sustainable production methods and exploring new applications for dicyandiamide in industrial and agricultural sectors are critical challenges for market stakeholders.
Government Policy of the market
The Tanzania government promotes the dicyandiamide market by encouraging the adoption of chemical products used in agricultural fertilizers, water treatment, and pharmaceuticals. Policies include providing incentives for companies investing in dicyandiamide production, which is essential for improving soil fertility, water quality, and industrial processes. The government also focuses on improving regulatory frameworks to ensure that dicyandiamide products comply with international standards for safety and environmental sustainability. Initiatives are in place to support sustainable manufacturing practices and to promote the benefits of dicyandiamide in various sectors, fostering market growth and industrial development.
Key Highlights of the Report:
- Tanzania Dicyandiamide Market Outlook
- Market Size of Tanzania Dicyandiamide Market, 2024
- Forecast of Tanzania Dicyandiamide Market, 2031
- Historical Data and Forecast of Tanzania Dicyandiamide Revenues & Volume for the Period 2021-2031
- Tanzania Dicyandiamide Market Trend Evolution
- Tanzania Dicyandiamide Market Drivers and Challenges
- Tanzania Dicyandiamide Price Trends
- Tanzania Dicyandiamide Porter`s Five Forces
- Tanzania Dicyandiamide Industry Life Cycle
- Historical Data and Forecast of Tanzania Dicyandiamide Market Revenues & Volume By Grade for the Period 2021-2031
- Historical Data and Forecast of Tanzania Dicyandiamide Market Revenues & Volume By Electronic grade for the Period 2021-2031
- Historical Data and Forecast of Tanzania Dicyandiamide Market Revenues & Volume By Industrial grade for the Period 2021-2031
- Historical Data and Forecast of Tanzania Dicyandiamide Market Revenues & Volume By Pharmaceutical grade for the Period 2021-2031
- Historical Data and Forecast of Tanzania Dicyandiamide Market Revenues & Volume By Application for the Period 2021-2031
- Historical Data and Forecast of Tanzania Dicyandiamide Market Revenues & Volume By Pharmaceuticals for the Period 2021-2031
- Historical Data and Forecast of Tanzania Dicyandiamide Market Revenues & Volume By Epoxy laminates for the Period 2021-2031
- Historical Data and Forecast of Tanzania Dicyandiamide Market Revenues & Volume By Textile & dyeing auxiliaries for the Period 2021-2031
- Historical Data and Forecast of Tanzania Dicyandiamide Market Revenues & Volume By Water treatment for the Period 2021-2031
- Historical Data and Forecast of Tanzania Dicyandiamide Market Revenues & Volume By Flame retardants for the Period 2021-2031
- Historical Data and Forecast of Tanzania Dicyandiamide Market Revenues & Volume By Fertilizers for the Period 2021-2031
- Historical Data and Forecast of Tanzania Dicyandiamide Market Revenues & Volume By Others for the Period 2021-2031
- Tanzania Dicyandiamide Import Export Trade Statistics
- Market Opportunity Assessment By Grade
- Market Opportunity Assessment By Application
- Tanzania Dicyandiamide Top Companies Market Share
- Tanzania Dicyandiamide Competitive Benchmarking By Technical and Operational Parameters
- Tanzania Dicyandiamide Company Profiles
- Tanzania Dicyandiamide Key Strategic Recommendations
Frequently Asked Questions About the Market Study (FAQs):
6Wresearch actively monitors the Tanzania Dicyandiamide Market and publishes its comprehensive annual report, highlighting emerging trends, growth drivers, revenue analysis, and forecast outlook. Our insights help businesses to make data-backed strategic decisions with ongoing market dynamics. Our analysts track relevent industries related to the Tanzania Dicyandiamide Market, allowing our clients with actionable intelligence and reliable forecasts tailored to emerging regional needs.
Yes, we provide customisation as per your requirements. To learn more, feel free to contact us on sales@6wresearch.com
1 Executive Summary |
2 Introduction |
2.1 Key Highlights of the Report |
2.2 Report Description |
2.3 Market Scope & Segmentation |
2.4 Research Methodology |
2.5 Assumptions |
3 Tanzania Dicyandiamide Market Overview |
3.1 Tanzania Country Macro Economic Indicators |
3.2 Tanzania Dicyandiamide Market Revenues & Volume, 2021 & 2031F |
3.3 Tanzania Dicyandiamide Market - Industry Life Cycle |
3.4 Tanzania Dicyandiamide Market - Porter's Five Forces |
3.5 Tanzania Dicyandiamide Market Revenues & Volume Share, By Grade, 2021 & 2031F |
3.6 Tanzania Dicyandiamide Market Revenues & Volume Share, By Application, 2021 & 2031F |
4 Tanzania Dicyandiamide Market Dynamics |
4.1 Impact Analysis |
4.2 Market Drivers |
4.2.1 Increasing demand for agricultural products in Tanzania |
4.2.2 Growing awareness about the benefits of using dicyandiamide in agriculture |
4.2.3 Government initiatives to promote sustainable agriculture practices |
4.3 Market Restraints |
4.3.1 Limited availability of raw materials for dicyandiamide production in Tanzania |
4.3.2 Lack of technological advancements in dicyandiamide manufacturing processes |
4.3.3 Price volatility of dicyandiamide in the global market |
5 Tanzania Dicyandiamide Market Trends |
6 Tanzania Dicyandiamide Market Segmentations |
6.1 Tanzania Dicyandiamide Market, By Grade |
6.1.1 Overview and Analysis |
6.1.2 Tanzania Dicyandiamide Market Revenues & Volume, By Electronic grade, 2021-2031F |
6.1.3 Tanzania Dicyandiamide Market Revenues & Volume, By Industrial grade, 2021-2031F |
6.1.4 Tanzania Dicyandiamide Market Revenues & Volume, By Pharmaceutical grade, 2021-2031F |
6.2 Tanzania Dicyandiamide Market, By Application |
6.2.1 Overview and Analysis |
6.2.2 Tanzania Dicyandiamide Market Revenues & Volume, By Pharmaceuticals, 2021-2031F |
6.2.3 Tanzania Dicyandiamide Market Revenues & Volume, By Epoxy laminates, 2021-2031F |
6.2.4 Tanzania Dicyandiamide Market Revenues & Volume, By Textile & dyeing auxiliaries, 2021-2031F |
6.2.5 Tanzania Dicyandiamide Market Revenues & Volume, By Water treatment, 2021-2031F |
6.2.6 Tanzania Dicyandiamide Market Revenues & Volume, By Flame retardants, 2021-2031F |
6.2.7 Tanzania Dicyandiamide Market Revenues & Volume, By Fertilizers, 2021-2031F |
7 Tanzania Dicyandiamide Market Import-Export Trade Statistics |
7.1 Tanzania Dicyandiamide Market Export to Major Countries |
7.2 Tanzania Dicyandiamide Market Imports from Major Countries |
8 Tanzania Dicyandiamide Market Key Performance Indicators |
8.1 Adoption rate of dicyandiamide in Tanzanian agriculture |
8.2 Investment in research and development for dicyandiamide production in Tanzania |
8.3 Number of government policies supporting the use of dicyandiamide in agriculture. |
9 Tanzania Dicyandiamide Market - Opportunity Assessment |
9.1 Tanzania Dicyandiamide Market Opportunity Assessment, By Grade, 2021 & 2031F |
9.2 Tanzania Dicyandiamide Market Opportunity Assessment, By Application, 2021 & 2031F |
10 Tanzania Dicyandiamide Market - Competitive Landscape |
10.1 Tanzania Dicyandiamide Market Revenue Share, By Companies, 2024 |
10.2 Tanzania Dicyandiamide Market Competitive Benchmarking, By Operating and Technical Parameters |
11 Company Profiles |
12 Recommendations | 13 Disclaimer |
Export potential assessment - trade Analytics for 2030
Export potential enables firms to identify high-growth global markets with greater confidence by combining advanced trade intelligence with a structured quantitative methodology. The framework analyzes emerging demand trends and country-level import patterns while integrating macroeconomic and trade datasets such as GDP and population forecasts, bilateral import–export flows, tariff structures, elasticity differentials between developed and developing economies, geographic distance, and import demand projections. Using weighted trade values from 2020–2024 as the base period to project country-to-country export potential for 2030, these inputs are operationalized through calculated drivers such as gravity model parameters, tariff impact factors, and projected GDP per-capita growth. Through an analysis of hidden potentials, demand hotspots, and market conditions that are most favorable to success, this method enables firms to focus on target countries, maximize returns, and global expansion with data, backed by accuracy.
By factoring in the projected importer demand gap that is currently unmet and could be potential opportunity, it identifies the potential for the Exporter (Country) among 190 countries, against the general trade analysis, which identifies the biggest importer or exporter.
To discover high-growth global markets and optimize your business strategy:
Click Here
Pricing
- Single User License$ 1,995
- Department License$ 2,400
- Site License$ 3,120
- Global License$ 3,795

Search
Thought Leadership and Analyst Meet


Our Clients
Latest Reports
- United Kingdom (UK) Long-term Care Insurance Market (2026-2032) | Growth, Share, Consumer Insights, Drivers, Opportunities, Competition, Pricing Analysis, Segments, Restraints, Companies, Competitive, Value, Outlook, Size, Demand, Analysis, Challenges, Strategic Insights, Investment Trends, Revenue, Trends, Supply, Forecast
- United Kingdom (UK) Long Term Care Market (2026-2032) | Companies, Outlook, Analysis, Trends, Value, Revenue, Segmentation, Share, Forecast, Competitive Landscape, Growth, Size & Forecast
- Iraq Insulation and Waterproofing Market (2026-2032) | Outlook, Drivers, Growth, Size, Share, Industry, Revenue, Trends, Demand, Competitive, Strategic Insights, Opportunities, Segments, Companies, Challenges, Strategy, Consumer Insights, Analysis, Investment Trends, Value, Segmentation, Forecast, Restraints
- India Switchgear Market Outlook (2026 - 2032) | Size, Share, Trends, Growth, Revenue, Forecast, Analysis, Value, Outlook
- Pakistan Contraceptive Implants Market (2025-2031) | Demand, Growth, Size, Share, Industry, Pricing Analysis, Competitive, Strategic Insights, Strategy, Consumer Insights, Analysis, Investment Trends, Opportunities, Revenue, Segments, Value, Segmentation, Supply, Forecast, Restraints, Outlook, Competition, Drivers, Trends, Companies, Challenges
- Sri Lanka Packaging Market (2026-2032) | Outlook, Competition, Drivers, Trends, Demand, Pricing Analysis, Competitive, Strategic Insights, Companies, Challenges, Strategy, Consumer Insights, Analysis, Investment Trends, Opportunities, Growth, Size, Share, Industry, Revenue, Segments, Value, Segmentation, Supply, Forecast, Restraints
- India Kids Watches Market (2026-2032) | Strategy, Consumer Insights, Analysis, Investment Trends, Opportunities, Growth, Size, Share, Industry, Revenue, Segments, Value, Segmentation, Supply, Forecast, Restraints, Outlook, Competition, Drivers, Trends, Demand, Pricing Analysis, Competitive, Strategic Insights, Companies, Challenges
- Saudi Arabia Core Assurance Service Market (2025-2031) | Strategy, Consumer Insights, Analysis, Investment Trends, Opportunities, Growth, Size, Share, Industry, Revenue, Segments, Value, Segmentation, Supply, Forecast, Restraints, Outlook, Competition, Drivers, Trends, Demand, Pricing Analysis, Competitive, Strategic Insights, Companies, Challenges
- Romania Uninterruptible Power Supply (UPS) Market (2026-2032) | Industry, Analysis, Revenue, Size, Forecast, Outlook, Value, Trends, Share, Growth & Companies
- Saudi Arabia Car Window Tinting Film, Paint Protection Film (PPF), and Ceramic Coating Market (2025-2031) | Strategy, Consumer Insights, Analysis, Investment Trends, Opportunities, Growth, Size, Share, Industry, Revenue, Segments, Value, Segmentation, Supply, Forecast, Restraints, Outlook, Competition, Drivers, Trends, Demand, Pricing Analysis, Competitive, Strategic Insights, Companies, Challenges
Industry Events and Analyst Meet

India EV Show 2026

EV tech India Expo 2026

Auto Tech Asia 2026

Battery Tech India 2026

Smart Production Solutions Guangzhou 2026
Whitepaper
- Middle East & Africa Commercial Security Market Click here to view more.
- Middle East & Africa Fire Safety Systems & Equipment Market Click here to view more.
- GCC Drone Market Click here to view more.
- Middle East Lighting Fixture Market Click here to view more.
- GCC Physical & Perimeter Security Market Click here to view more.
6WResearch In News
- Doha a strategic location for EV manufacturing hub: IPA Qatar
- Demand for luxury TVs surging in the GCC, says Samsung
- Empowering Growth: The Thriving Journey of Bangladesh’s Cable Industry
- Demand for luxury TVs surging in the GCC, says Samsung
- Video call with a traditional healer? Once unthinkable, it’s now common in South Africa
- Intelligent Buildings To Smooth GCC’s Path To Net Zero