Tanzania Electronic parts Market (2026-2032) | Companies, Share, Growth, Size, Trends, Revenue, Industry, Outlook, Value, Analysis & Forecast
Market Forecast By Type (Passive, Active, Electro Mechanic), By Application (Automotive, Communications, Computing Applications, Others) And Competitive Landscape
| Product Code: ETC035595 | Publication Date: Oct 2020 | Updated Date: Jun 2026 | Product Type: Report | |
| Publisher: 6Wresearch | Author: Sachin Kumar Rai | No. of Pages: 70 | No. of Figures: 35 | No. of Tables: 5 |
Tanzania Electronic parts Market Summary
The tanzania electronic parts market was estimated at USD 216 Million in 2025 and is projected to reach USD 290 Million by 2032, growing at a CAGR of 5.3% from 2026 to 2032.
Tanzania Electronic parts Market Year-wise Growth Rate and Key Drivers
This graph highlights how the Tanzania Electronic parts Market has steadily grown over the past five years, supported by major growth factors.
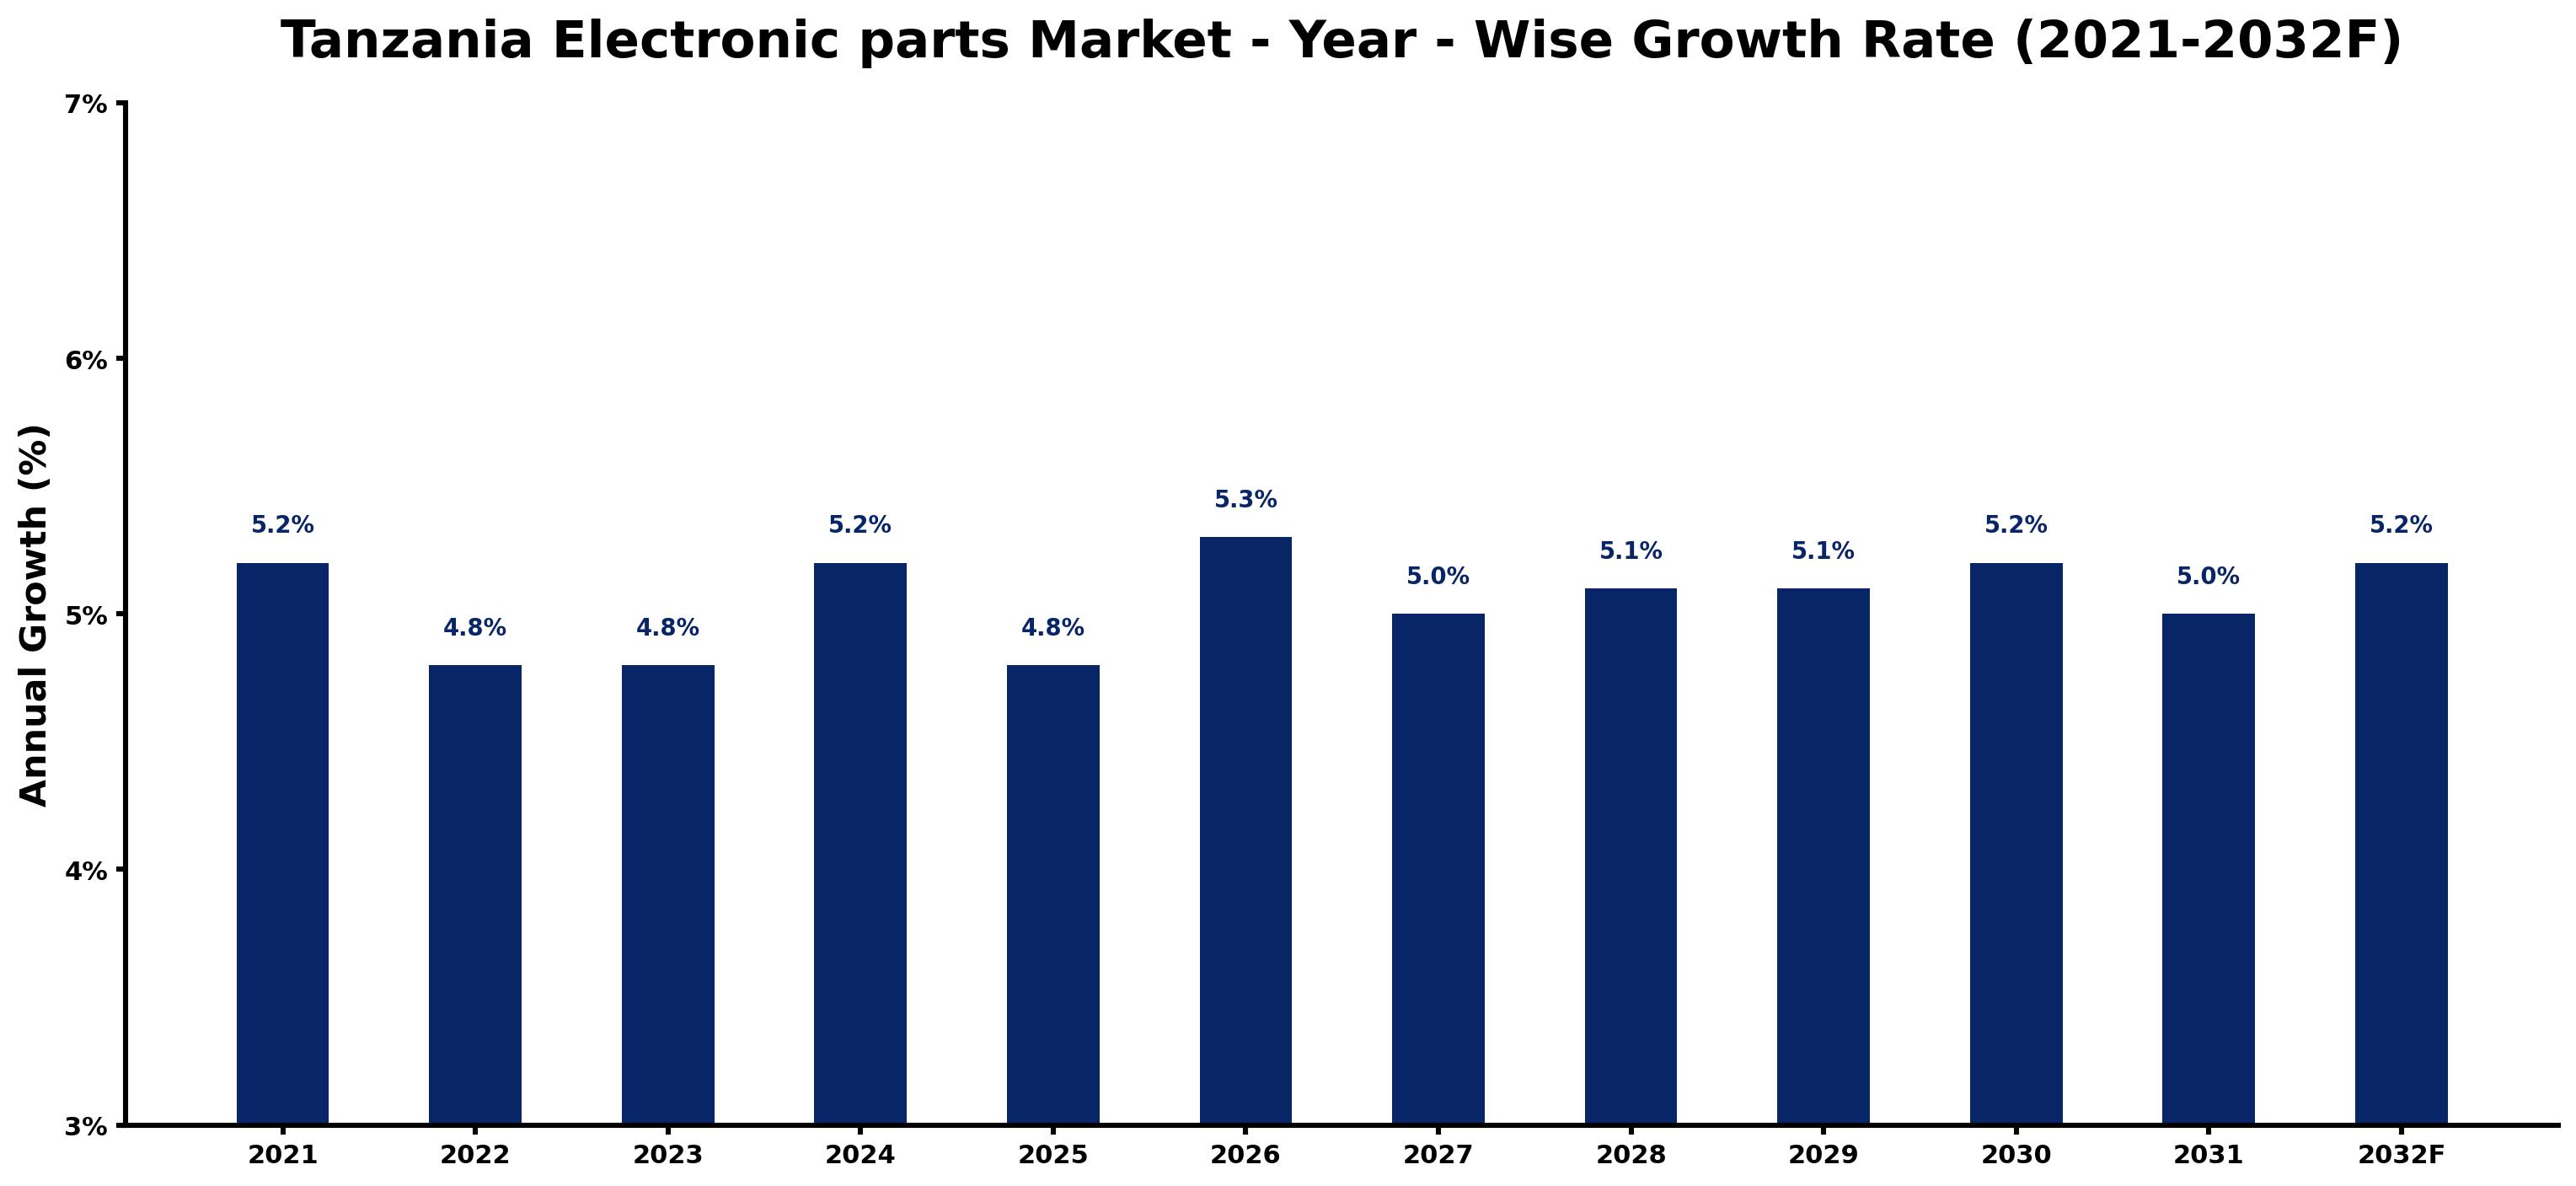
The table below presents the year wise growth rates along with the key drivers influencing the market
| Year | Growth Rate | Major Drivers |
| 2021 | 5.2% | Tanzania's telecommunications sector expanded, fueling demand for electronic components significantly. |
| 2022 | 4.8% | Investment in renewable energy projects increased the need for advanced electronic parts. |
| 2023 | 4.8% | Mobile money services' growth encouraged digital infrastructure enhancements across urban areas. |
| 2024 | 5.2% | Local manufacturers began producing electronic components, reducing dependency on imports. |
| 2025 | 4.8% | E-commerce platforms emerged, driving the requirement for efficient electronic supply chains. |
| 2026 | 5.3% | Tech startups focused on IoT solutions, creating opportunities for electronic part suppliers. |
| 2027 | 5.0% | Education initiatives around technology improved skills, enhancing local workforce capabilities. |
| 2028 | 5.1% | Government partnerships with tech firms aimed to modernize infrastructure and connectivity. |
| 2029 | 5.1% | Consumer electronics demand surged, leading to a rise in retail electronic sales. |
| 2030 | 5.2% | International conglomerates recognized Tanzania as a strategic manufacturing hub for electronics. |
| 2031 | 5.0% | Expansion of logistics networks enhanced the distribution of electronic parts nationwide. |
| 2032 | 5.2% | Digital transformation plans spurred investments in smart technologies across various sectors. |
Note - Market size estimations and growth projections presented in this report are based on 6Wresearch's advanced forecasting approach, validated with industry datasets as of June 2026.
Tanzania Electronic parts Market Synopsis
The Tanzania Electronic parts Market is projected to reach 5.3% and witness significant growth during the forecast period (2026-2032). This surge is driven by a combination of factors, including the increasing demand for electronic devices across critical industries such as automotive, telecommunications, and consumer electronics. As the country's economy evolves, the demand for a diverse array of electronic components, including semiconductors, resistors, capacitors, and connectors, has surged. Both local distributors and international suppliers are active players in this market, positioned to meet the growing needs.
Tanzania Electronic parts Market Growth Drivers
The growth trajectory of the Tanzania electronic parts market can be attributed to several key drivers, including:
- Technological advancements are paving the way for highly sophisticated electronic components, thus giving rise to a demand for state-of-the-art products.
- Increased government initiatives aimed at promoting digitalization within various sectors are driving demand for electronic parts.
- A burgeoning middle class is contributing to higher disposable incomes, subsequently boosting consumer electronics sales.
- The rapid growth in the automotive sector, especially in electric vehicles, is creating a new demand for specialized electronic components.
- The ongoing expansion in telecommunications infrastructure has accelerated the need for reliable electronic parts.
Tanzania Electronic parts Market Trends and Opportunities
The current landscape of the Tanzania electronic parts market reveals several noteworthy trends:
- There is a marked increase in demand for components related to renewable energy, including solar panels and batteries, driven by national initiatives toward sustainability.
- The uptake of smart home devices and Internet of Things (IoT) technology is promoting sales of advanced sensors and connectivity modules.
- The automotive sector's focus on electric vehicles and advanced driver-assistance systems is creating new opportunities for electronics providers.
- With economic advancement, demand for high-quality electronic parts is prompting greater involvement from both local suppliers and international manufacturers.
- Investments in electronic manufacturing services (EMS) show promise as local assembly capabilities are developed to meet market demands.
Tanzania Electronic parts Market Challenges and Restraints
Despite the market's promising outlook, several challenges impede its growth:
- The prevalence of counterfeit electronic components poses significant risks, as businesses often struggle to maintain quality control.
- Lack of standardized regulations exacerbates the problems associated with the authenticity and quality of electronic parts.
- The fragmented supply chain presents logistical challenges, which can lead to delays in obtaining essential components.
- Fluctuating exchange rates create uncertainty in procurement costs, impacting profitability for businesses operating in the market.
- To tackle these challenges, investment in regulatory frameworks and quality control measures is critical for enhancing market reliability.
Tanzania Electronic parts Market Government Investment and Initiatives
The Tanzanian government has introduced various policies aimed at bolstering the electronic parts market:
- Tax incentives for firms establishing manufacturing operations in designated industrial zones are designed to attract investment.
- Import duties on specific electronic components help safeguard local manufacturers, encouraging domestic production.
- Partnerships with international organizations enhance technology transfer and skills development within the local workforce.
- Government-supported programs for research and development aim to stimulate innovation in the electronics sector.
- Infrastructure improvements are underway to facilitate smoother logistics and the distribution of electronic components throughout the country.
Tanzania Electronic parts Market Latest Developments (May 2025 - June 2026)
From May 2025 to June 2026, the Tanzania electronic parts market has seen several notable developments:
- A surge in domestic production capabilities is being witnessed, driven by increased investments in local manufacturing.
- Regulatory policies aimed at curbing counterfeit products have gained momentum, promoting a more transparent supply chain.
- The government has launched initiatives to facilitate public-private partnerships, fostering innovation and technology development in electronics.
- Increased collaboration with international entities has led to knowledge transfer and improved quality standards in production.
- Research and development activity surrounding renewable energy components has intensified, aligning with national sustainability goals.
Tanzania Electronic parts Market - Key Attractiveness of the Report
- 10 Years of Market Numbers
- Historical Data Starting from 2022 to 2025
- Base Year: 2025
- Forecast Data until 2032
- Key Performance Indicators Impacting the Market
- Major Upcoming Developments and Projects
Key Highlights of the Report:
- Tanzania Electronic parts Market Outlook
- Market Size of Tanzania Electronic parts Market, 2025
- Forecast of Tanzania Electronic parts Market, 2032F
- Historical Data and Forecast of Tanzania Electronic parts Revenues & Volume for the Period 2022-2032F
- Tanzania Electronic parts Market Trend Evolution
- Tanzania Electronic parts Market Drivers and Challenges
- Tanzania Electronic parts Price Trends
- Tanzania Electronic parts Porter's Five Forces
- Tanzania Electronic parts Industry Life Cycle
- Historical Data and Forecast of Tanzania Electronic parts Market Revenues & Volume By Type for the Period 2022-2032F
- Historical Data and Forecast of Tanzania Electronic parts Market Revenues & Volume By Passive for the Period 2022-2032F
- Historical Data and Forecast of Tanzania Electronic parts Market Revenues & Volume By Active for the Period 2022-2032F
- Historical Data and Forecast of Tanzania Electronic parts Market Revenues & Volume By Electro Mechanic for the Period 2022-2032F
- Historical Data and Forecast of Tanzania Electronic parts Market Revenues & Volume By Application for the Period 2022-2032F
- Historical Data and Forecast of Tanzania Electronic parts Market Revenues & Volume By Automotive for the Period 2022-2032F
- Historical Data and Forecast of Tanzania Electronic parts Market Revenues & Volume By Communications for the Period 2022-2032F
- Historical Data and Forecast of Tanzania Electronic parts Market Revenues & Volume By Computing Applications for the Period 2022-2032F
- Historical Data and Forecast of Tanzania Electronic parts Market Revenues & Volume By Others for the Period 2022-2032F
- Tanzania Electronic parts Import Export Trade Statistics
- Market Opportunity Assessment By Type
- Market Opportunity Assessment By Application
- Tanzania Electronic parts Top Companies Market Share
- Tanzania Electronic parts Competitive Benchmarking By Technical and Operational Parameters
- Tanzania Electronic parts Company Profiles
- Tanzania Electronic parts Key Strategic Recommendations
Frequently Asked Questions About the Market Study (FAQs):
The growth is primarily driven by technological advancements, government initiatives for digitalization, and the rise of a middle-class population increasing consumer electronic demand.
Challenges include the presence of counterfeit components, a lack of standard regulations, and logistical issues within a fragmented supply chain.
Opportunities encompass distribution and retail operations, electronic manufacturing services, and R&D investments for innovative products tailored to local needs.
The government is implementing policies that include tax incentives, import duties to protect local manufacturers, and partnerships to enhance skills and technology transfer.
6Wresearch actively monitors the Tanzania Electronic parts Market and publishes its comprehensive annual report, highlighting emerging trends, growth drivers, revenue analysis, and forecast outlook. Our insights help businesses to make data-backed strategic decisions with ongoing market dynamics. Our analysts track relevent industries related to the Tanzania Electronic parts Market, allowing our clients with actionable intelligence and reliable forecasts tailored to emerging regional needs.
Yes, we provide customisation as per your requirements. To learn more, feel free to contact us on sales@6wresearch.com
1 Executive Summary |
2 Introduction |
2.1 Key Highlights of the Report |
2.2 Report Description |
2.3 Market Scope & Segmentation |
2.4 Research Methodology |
2.5 Assumptions |
3 Tanzania Electronic parts Market Overview |
3.1 Tanzania Country Macro Economic Indicators |
3.2 Tanzania Electronic parts Market Revenues & Volume, 2022 & 2032F |
3.3 Tanzania Electronic parts Market - Industry Life Cycle |
3.4 Tanzania Electronic parts Market - Porter's Five Forces |
3.5 Tanzania Electronic parts Market Revenues & Volume Share, By Type, 2022 & 2032F |
3.6 Tanzania Electronic parts Market Revenues & Volume Share, By Application, 2022 & 2032F |
4 Tanzania Electronic parts Market Dynamics |
4.1 Impact Analysis |
4.2 Market Drivers |
4.3 Market Restraints |
5 Tanzania Electronic parts Market Trends |
6 Tanzania Electronic parts Market, By Types |
6.1 Tanzania Electronic parts Market, By Type |
6.1.1 Overview and Analysis |
6.1.2 Tanzania Electronic parts Market Revenues & Volume, By Type, 2022-2032F |
6.1.3 Tanzania Electronic parts Market Revenues & Volume, By Passive, 2022-2032F |
6.1.4 Tanzania Electronic parts Market Revenues & Volume, By Active, 2022-2032F |
6.1.5 Tanzania Electronic parts Market Revenues & Volume, By Electro Mechanic, 2022-2032F |
6.2 Tanzania Electronic parts Market, By Application |
6.2.1 Overview and Analysis |
6.2.2 Tanzania Electronic parts Market Revenues & Volume, By Automotive, 2022-2032F |
6.2.3 Tanzania Electronic parts Market Revenues & Volume, By Communications, 2022-2032F |
6.2.4 Tanzania Electronic parts Market Revenues & Volume, By Computing Applications, 2022-2032F |
6.2.5 Tanzania Electronic parts Market Revenues & Volume, By Others, 2022-2032F |
7 Tanzania Electronic parts Market Import-Export Trade Statistics |
7.1 Tanzania Electronic parts Market Export to Major Countries |
7.2 Tanzania Electronic parts Market Imports from Major Countries |
8 Tanzania Electronic parts Market Key Performance Indicators |
9 Tanzania Electronic parts Market - Opportunity Assessment |
9.1 Tanzania Electronic parts Market Opportunity Assessment, By Type, 2022 & 2032F |
9.2 Tanzania Electronic parts Market Opportunity Assessment, By Application, 2022 & 2032F |
10 Tanzania Electronic parts Market - Competitive Landscape |
10.1 Tanzania Electronic parts Market Revenue Share, By Companies, 2025 |
10.2 Tanzania Electronic parts Market Competitive Benchmarking, By Operating and Technical Parameters |
11 Company Profiles |
12 Recommendations |
13 Disclaimer |
Global Go To Market Strategy - 2030
Export potential enables firms to identify high-growth global markets with greater confidence by combining advanced trade intelligence with a structured quantitative methodology. The framework analyzes emerging demand trends and country-level import patterns while integrating macroeconomic and trade datasets such as GDP and population forecasts, bilateral import–export flows, tariff structures, elasticity differentials between developed and developing economies, geographic distance, and import demand projections. Using weighted trade values from 2020–2024 as the base period to project country-to-country export potential for 2030, these inputs are operationalized through calculated drivers such as gravity model parameters, tariff impact factors, and projected GDP per-capita growth. Through an analysis of hidden potentials, demand hotspots, and market conditions that are most favorable to success, this method enables firms to focus on target countries, maximize returns, and global expansion with data, backed by accuracy.
By factoring in the projected importer demand gap that is currently unmet and could be potential opportunity, it identifies the potential for the Exporter (Country) among 190 countries, against the general trade analysis, which identifies the biggest importer or exporter.
To discover high-growth global markets and optimize your business strategy:
Click Here
Pricing
- Single User License$ 1,995
- Department License$ 2,400
- Site License$ 3,120
- Global License$ 3,795

Leadership Perspectives from Industry Events
Search
Thought Leadership and Analyst Meet


Our Clients
6WResearch In News
- India Air Conditioner Market Set for Strong Rebound in 2026 After Weather-Led Correction and GST-Driven Recovery: 6Wresearch
- ADAS in India: How Automatic Emergency Braking, Blind Spot Detection & Driver Monitoring are Transforming Road Safety
- Doha a strategic location for EV manufacturing hub: IPA Qatar
- Demand for luxury TVs surging in the GCC, says Samsung
- Empowering Growth: The Thriving Journey of Bangladesh’s Cable Industry
- Demand for luxury TVs surging in the GCC, says Samsung
Latest Reports
- Nicaragua RPG Gaming Market (2026-2032)
- New Zealand RPG Gaming Market (2026-2032)
- Netherlands RPG Gaming Market (2026-2032)
- Nauru RPG Gaming Market (2026-2032)
- Namibia RPG Gaming Market (2026-2032)
- Mozambique RPG Gaming Market (2026-2032)
- Montenegro RPG Gaming Market (2026-2032)
- Mongolia RPG Gaming Market (2026-2032)
- Monaco RPG Gaming Market (2026-2032)
- Micronesia RPG Gaming Market (2026-2032)
Industry Events and Analyst Meet

EV India Expo 2026

HIMTEX 2026

India Refining Summit 2026

India EV Show 2026

EV tech India Expo 2026
Whitepaper
- Middle East & Africa Commercial Security Market Click here to view more.
- Middle East & Africa Fire Safety Systems & Equipment Market Click here to view more.
- GCC Drone Market Click here to view more.
- Middle East Lighting Fixture Market Click here to view more.
- GCC Physical & Perimeter Security Market Click here to view more.