Tanzania Juice Concentrate Market (2026-2032) | Investment Trends, Share, Industry, Outlook, Strategic Insights, Segmentation, Value, Trends, Forecast, Segments, Strategy, Competitive, Pricing Analysis, Supply, Challenges, Analysis, Competition, Companies, Size, Revenue, Restraints, Drivers, Demand, Consumer Insights, Opportunities, Growth
Market Forecast By Application (Beverages, Bakery & Confectionery, Dairy Products, Pharmaceuticals), By Type (Fruit Concentrates, Vegetable Concentrates), By Form (Liquid, Powder), By End User (Food & Beverage Industry, Retail & Household Consumers, Nutraceutical Industry) And Competitive Landscape
| Product Code: ETC12882734 | Publication Date: Apr 2025 | Updated Date: Apr 2026 | Product Type: Market Research Report | |
| Publisher: 6Wresearch | Author: Sachin Kumar Rai | No. of Pages: 65 | No. of Figures: 34 | No. of Tables: 19 |
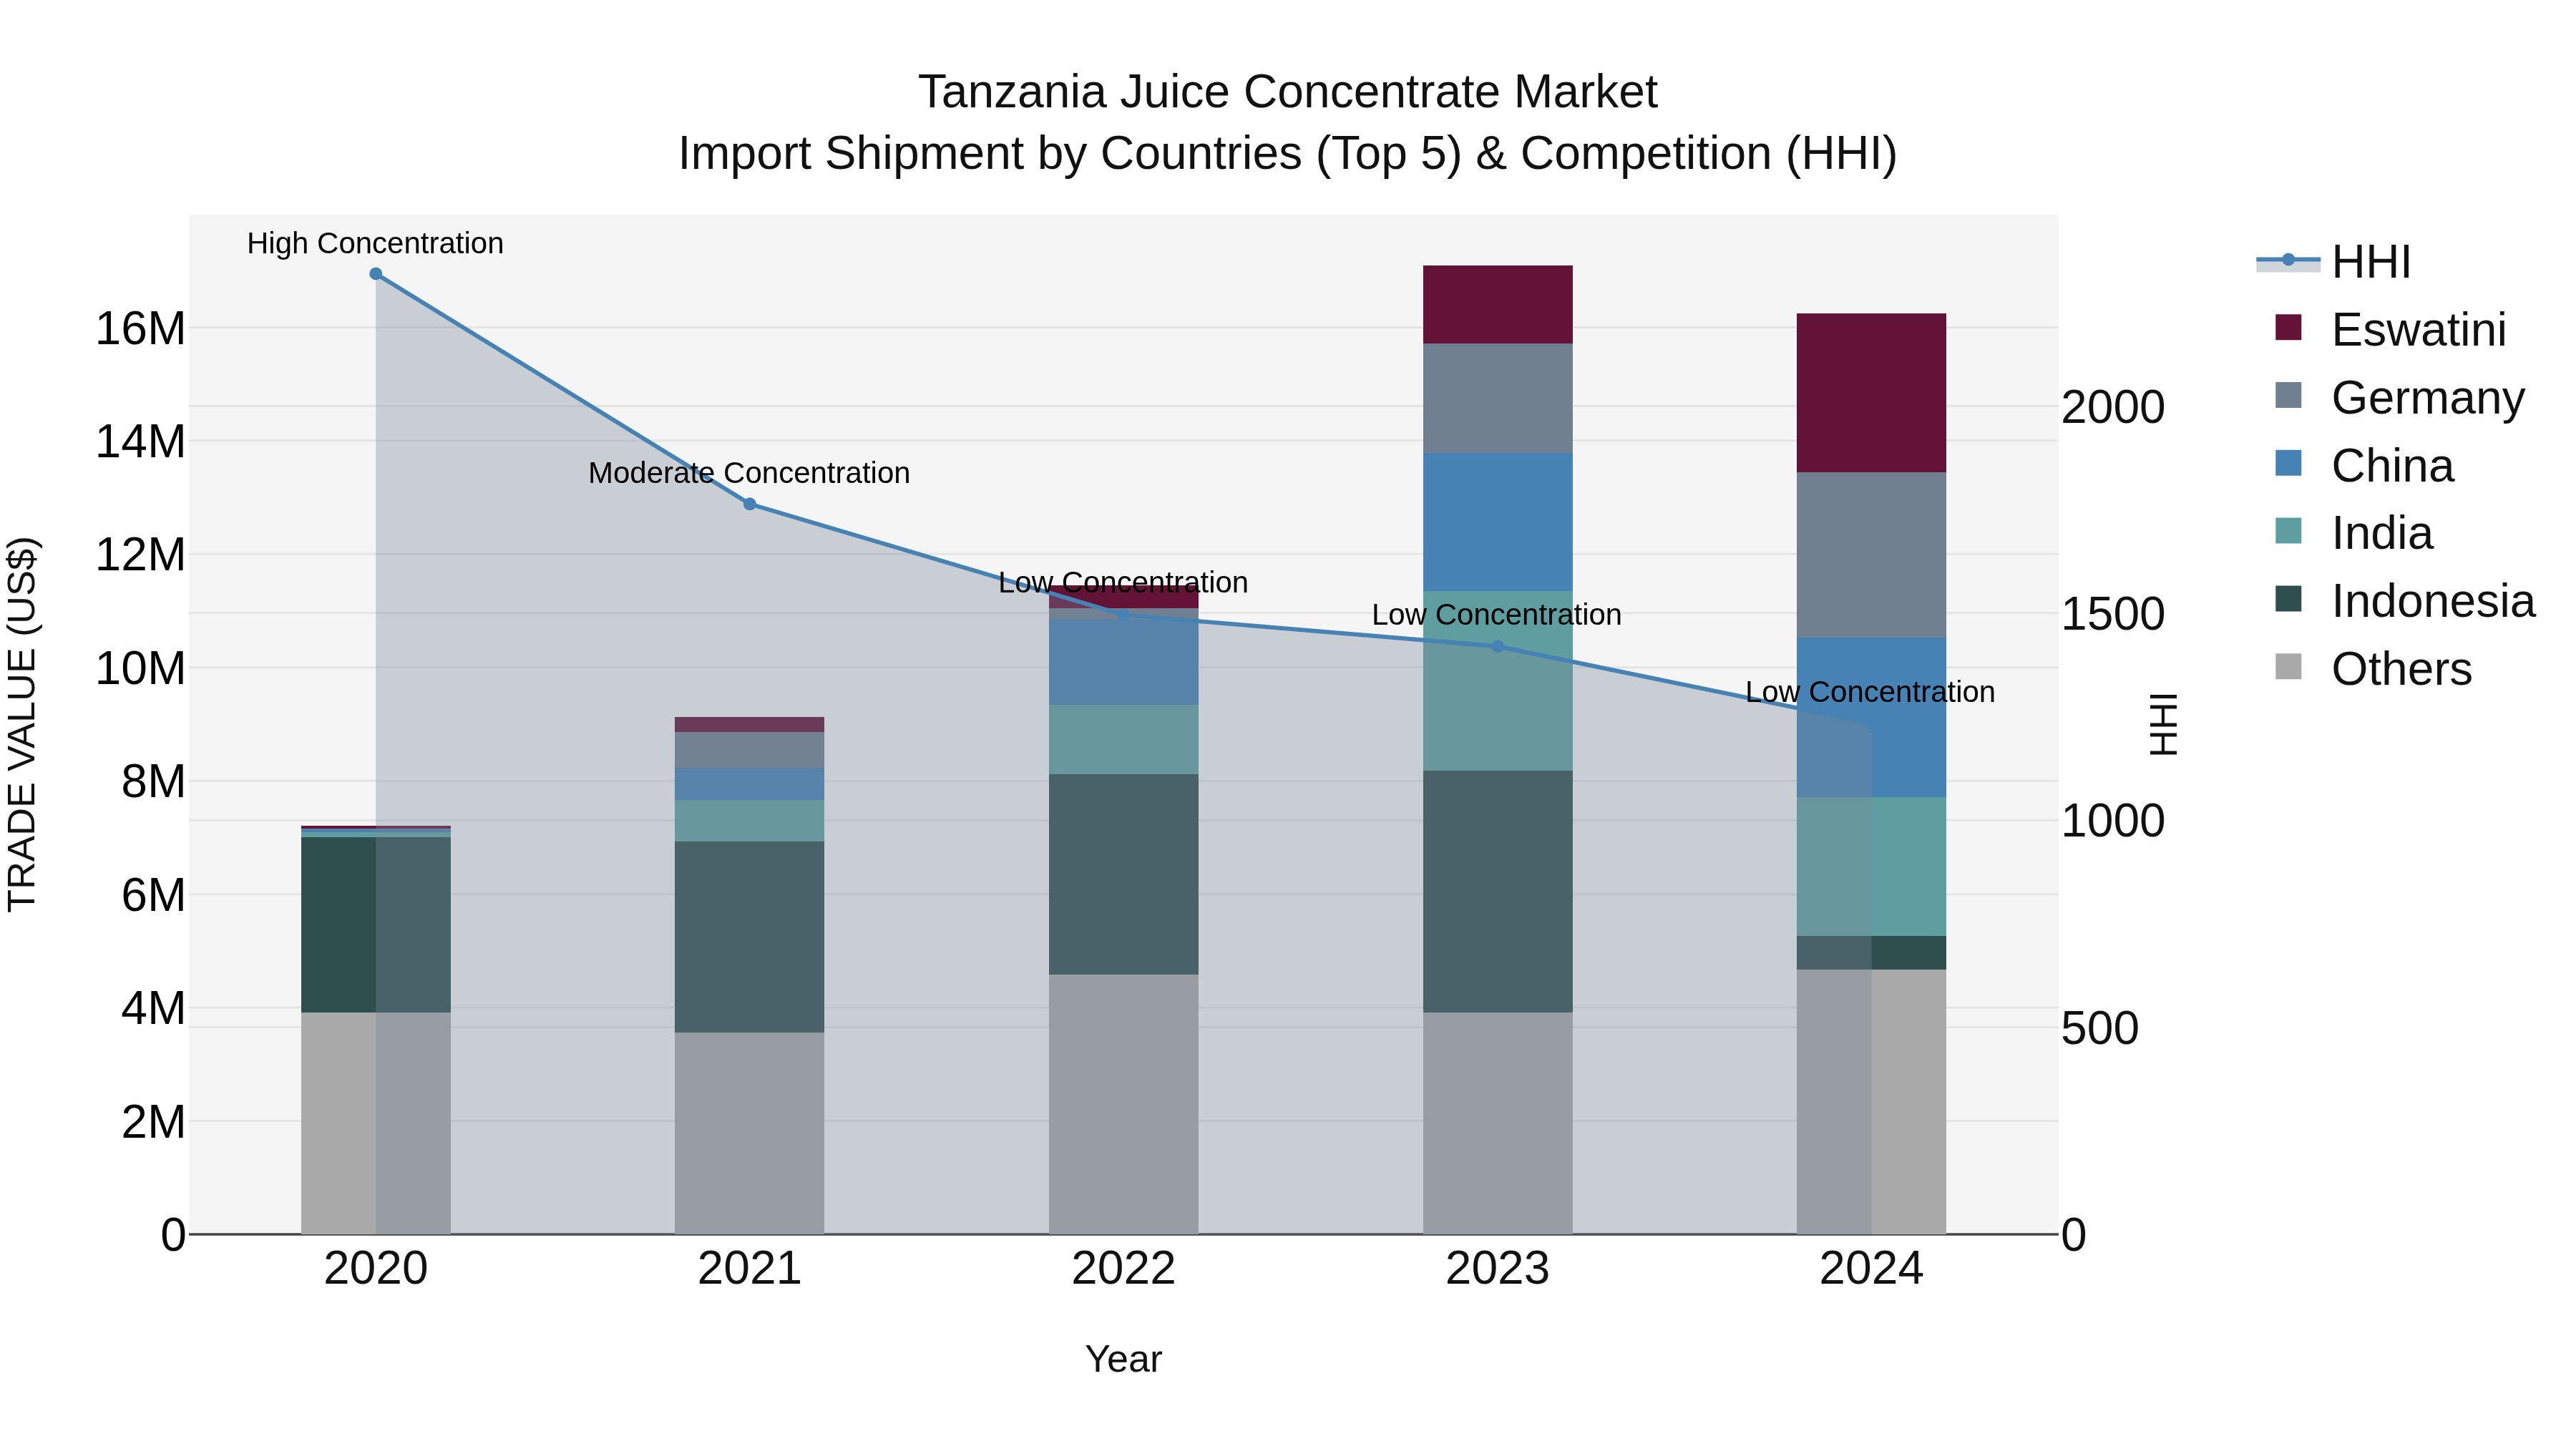
Tanzania Juice Concentrate Market: Top 5 Importing Countries and Market Competition (HHI) Analysis
Tanzania`s juice concentrate import market saw a diverse range of suppliers in 2024, with top exporters including Germany, China, Eswatini, India, and Ireland. Despite this variety, the market exhibited low concentration, as indicated by the Herfindahl-Hirschman Index (HHI). The impressive compound annual growth rate (CAGR) of 22.53% from 2020 to 2024 highlights the growing demand for juice concentrates in Tanzania. However, there was a slight decline in growth rate from 2023 to 2024 (-4.96%), indicating a potential shift in market dynamics that importers and exporters should monitor closely.
Key Highlights of the Report:
- Tanzania Juice Concentrate Market Outlook
- Market Size of Tanzania Juice Concentrate Market, 2025
- Forecast of Tanzania Juice Concentrate Market, 2032
- Historical Data and Forecast of Tanzania Juice Concentrate Revenues & Volume for the Period 2022 - 2032F
- Tanzania Juice Concentrate Market Trend Evolution
- Tanzania Juice Concentrate Market Drivers and Challenges
- Tanzania Juice Concentrate Price Trends
- Tanzania Juice Concentrate Porter's Five Forces
- Tanzania Juice Concentrate Industry Life Cycle
- Historical Data and Forecast of Tanzania Juice Concentrate Market Revenues & Volume By Application for the Period 2022 - 2032F
- Historical Data and Forecast of Tanzania Juice Concentrate Market Revenues & Volume By Beverages for the Period 2022 - 2032F
- Historical Data and Forecast of Tanzania Juice Concentrate Market Revenues & Volume By Bakery & Confectionery for the Period 2022 - 2032F
- Historical Data and Forecast of Tanzania Juice Concentrate Market Revenues & Volume By Dairy Products for the Period 2022 - 2032F
- Historical Data and Forecast of Tanzania Juice Concentrate Market Revenues & Volume By Pharmaceuticals for the Period 2022 - 2032F
- Historical Data and Forecast of Tanzania Juice Concentrate Market Revenues & Volume By Type for the Period 2022 - 2032F
- Historical Data and Forecast of Tanzania Juice Concentrate Market Revenues & Volume By Fruit Concentrates for the Period 2022 - 2032F
- Historical Data and Forecast of Tanzania Juice Concentrate Market Revenues & Volume By Vegetable Concentrates for the Period 2022 - 2032F
- Historical Data and Forecast of Tanzania Juice Concentrate Market Revenues & Volume By Form for the Period 2022 - 2032F
- Historical Data and Forecast of Tanzania Juice Concentrate Market Revenues & Volume By Liquid for the Period 2022 - 2032F
- Historical Data and Forecast of Tanzania Juice Concentrate Market Revenues & Volume By Powder for the Period 2022 - 2032F
- Historical Data and Forecast of Tanzania Juice Concentrate Market Revenues & Volume By End User for the Period 2022 - 2032F
- Historical Data and Forecast of Tanzania Juice Concentrate Market Revenues & Volume By Food & Beverage Industry for the Period 2022 - 2032F
- Historical Data and Forecast of Tanzania Juice Concentrate Market Revenues & Volume By Retail & Household Consumers for the Period 2022 - 2032F
- Historical Data and Forecast of Tanzania Juice Concentrate Market Revenues & Volume By Nutraceutical Industry for the Period 2022 - 2032F
- Tanzania Juice Concentrate Import Export Trade Statistics
- Market Opportunity Assessment By Application
- Market Opportunity Assessment By Type
- Market Opportunity Assessment By Form
- Market Opportunity Assessment By End User
- Tanzania Juice Concentrate Top Companies Market Share
- Tanzania Juice Concentrate Competitive Benchmarking By Technical and Operational Parameters
- Tanzania Juice Concentrate Company Profiles
- Tanzania Juice Concentrate Key Strategic Recommendations
Frequently Asked Questions About the Market Study (FAQs):
6Wresearch actively monitors the Tanzania Juice Concentrate Market and publishes its comprehensive annual report, highlighting emerging trends, growth drivers, revenue analysis, and forecast outlook. Our insights help businesses to make data-backed strategic decisions with ongoing market dynamics. Our analysts track relevent industries related to the Tanzania Juice Concentrate Market, allowing our clients with actionable intelligence and reliable forecasts tailored to emerging regional needs.
Yes, we provide customisation as per your requirements. To learn more, feel free to contact us on sales@6wresearch.com
1 Executive Summary |
2 Introduction |
2.1 Key Highlights of the Report |
2.2 Report Description |
2.3 Market Scope & Segmentation |
2.4 Research Methodology |
2.5 Assumptions |
3 Tanzania Juice Concentrate Market Overview |
3.1 Tanzania Country Macro Economic Indicators |
3.2 Tanzania Juice Concentrate Market Revenues & Volume, 2022 & 2032F |
3.3 Tanzania Juice Concentrate Market - Industry Life Cycle |
3.4 Tanzania Juice Concentrate Market - Porter's Five Forces |
3.5 Tanzania Juice Concentrate Market Revenues & Volume Share, By Application, 2022 & 2032F |
3.6 Tanzania Juice Concentrate Market Revenues & Volume Share, By Type, 2022 & 2032F |
3.7 Tanzania Juice Concentrate Market Revenues & Volume Share, By Form, 2022 & 2032F |
3.8 Tanzania Juice Concentrate Market Revenues & Volume Share, By End User, 2022 & 2032F |
4 Tanzania Juice Concentrate Market Dynamics |
4.1 Impact Analysis |
4.2 Market Drivers |
4.2.1 Growing health consciousness among consumers leading to increased demand for natural and healthier beverage options like juice concentrates. |
4.2.2 Rising disposable income levels in Tanzania, allowing consumers to spend more on premium products such as organic or exotic fruit juice concentrates. |
4.2.3 Expansion of retail channels and increasing availability of juice concentrate products in supermarkets and convenience stores, enhancing market accessibility. |
4.3 Market Restraints |
4.3.1 Fluctuating prices of raw materials such as fruits due to seasonality and climate changes, impacting production costs and ultimately product pricing. |
4.3.2 Inadequate infrastructure and logistics challenges in Tanzania affecting the distribution network and increasing supply chain costs. |
5 Tanzania Juice Concentrate Market Trends |
6 Tanzania Juice Concentrate Market, By Types |
6.1 Tanzania Juice Concentrate Market, By Application |
6.1.1 Overview and Analysis |
6.1.2 Tanzania Juice Concentrate Market Revenues & Volume, By Application, 2022 - 2032F |
6.1.3 Tanzania Juice Concentrate Market Revenues & Volume, By Beverages, 2022 - 2032F |
6.1.4 Tanzania Juice Concentrate Market Revenues & Volume, By Bakery & Confectionery, 2022 - 2032F |
6.1.5 Tanzania Juice Concentrate Market Revenues & Volume, By Dairy Products, 2022 - 2032F |
6.1.6 Tanzania Juice Concentrate Market Revenues & Volume, By Pharmaceuticals, 2022 - 2032F |
6.2 Tanzania Juice Concentrate Market, By Type |
6.2.1 Overview and Analysis |
6.2.2 Tanzania Juice Concentrate Market Revenues & Volume, By Fruit Concentrates, 2022 - 2032F |
6.2.3 Tanzania Juice Concentrate Market Revenues & Volume, By Vegetable Concentrates, 2022 - 2032F |
6.3 Tanzania Juice Concentrate Market, By Form |
6.3.1 Overview and Analysis |
6.3.2 Tanzania Juice Concentrate Market Revenues & Volume, By Liquid, 2022 - 2032F |
6.3.3 Tanzania Juice Concentrate Market Revenues & Volume, By Powder, 2022 - 2032F |
6.4 Tanzania Juice Concentrate Market, By End User |
6.4.1 Overview and Analysis |
6.4.2 Tanzania Juice Concentrate Market Revenues & Volume, By Food & Beverage Industry, 2022 - 2032F |
6.4.3 Tanzania Juice Concentrate Market Revenues & Volume, By Retail & Household Consumers, 2022 - 2032F |
6.4.4 Tanzania Juice Concentrate Market Revenues & Volume, By Nutraceutical Industry, 2022 - 2032F |
7 Tanzania Juice Concentrate Market Import-Export Trade Statistics |
7.1 Tanzania Juice Concentrate Market Export to Major Countries |
7.2 Tanzania Juice Concentrate Market Imports from Major Countries |
8 Tanzania Juice Concentrate Market Key Performance Indicators |
8.1 Consumer engagement metrics such as social media interactions, website traffic, and online reviews indicating the level of interest and awareness of juice concentrates in the market. |
8.2 Quality control metrics like product return rates, customer complaints, and compliance with food safety standards ensuring the consistency and safety of juice concentrate products. |
8.3 Sustainability metrics such as sourcing practices, waste management strategies, and carbon footprint reduction initiatives showcasing the commitment towards environmental responsibility and long-term viability of the market. |
9 Tanzania Juice Concentrate Market - Opportunity Assessment |
9.1 Tanzania Juice Concentrate Market Opportunity Assessment, By Application, 2022 & 2032F |
9.2 Tanzania Juice Concentrate Market Opportunity Assessment, By Type, 2022 & 2032F |
9.3 Tanzania Juice Concentrate Market Opportunity Assessment, By Form, 2022 & 2032F |
9.4 Tanzania Juice Concentrate Market Opportunity Assessment, By End User, 2022 & 2032F |
10 Tanzania Juice Concentrate Market - Competitive Landscape |
10.1 Tanzania Juice Concentrate Market Revenue Share, By Companies, 2025 |
10.2 Tanzania Juice Concentrate Market Competitive Benchmarking, By Operating and Technical Parameters |
11 Company Profiles |
12 Recommendations |
13 Disclaimer |
Export potential assessment - trade Analytics for 2030
Export potential enables firms to identify high-growth global markets with greater confidence by combining advanced trade intelligence with a structured quantitative methodology. The framework analyzes emerging demand trends and country-level import patterns while integrating macroeconomic and trade datasets such as GDP and population forecasts, bilateral import–export flows, tariff structures, elasticity differentials between developed and developing economies, geographic distance, and import demand projections. Using weighted trade values from 2020–2024 as the base period to project country-to-country export potential for 2030, these inputs are operationalized through calculated drivers such as gravity model parameters, tariff impact factors, and projected GDP per-capita growth. Through an analysis of hidden potentials, demand hotspots, and market conditions that are most favorable to success, this method enables firms to focus on target countries, maximize returns, and global expansion with data, backed by accuracy.
By factoring in the projected importer demand gap that is currently unmet and could be potential opportunity, it identifies the potential for the Exporter (Country) among 190 countries, against the general trade analysis, which identifies the biggest importer or exporter.
To discover high-growth global markets and optimize your business strategy:
Click Here
Pricing
- Single User License$ 1,995
- Department License$ 2,400
- Site License$ 3,120
- Global License$ 3,795

Search
Thought Leadership and Analyst Meet


Our Clients
Latest Reports
- Philippines Polyhydroxybutyrate-co-Hydroxyvalerate Market (2026-2032) | Trends, Insights, Challenges, Restraints, Competition, Size, Value, Forecast, Pricing, Share, Outlook, Revenue, Investment Opportunities, Strategy, Drivers, Demand, Growth, segmentation, Analysis, Companies
- Peru Polyhydroxybutyrate-co-Hydroxyvalerate Market (2026-2032) | Growth, Demand, Challenges, Share, Trends, Analysis, Pricing, Investment Opportunities, Drivers, Value, Forecast, Competition, Size, Companies, Insights, Outlook, Restraints, segmentation, Revenue, Strategy
- Pakistan Polyhydroxybutyrate-co-Hydroxyvalerate Market (2026-2032) | Restraints, segmentation, Pricing, Forecast, Share, Strategy, Competition, Trends, Insights, Drivers, Challenges, Growth, Revenue, Outlook, Value, Investment Opportunities, Companies, Size, Analysis, Demand
- Oman Polyhydroxybutyrate-co-Hydroxyvalerate Market (2026-2032) | Drivers, segmentation, Insights, Competition, Pricing, Outlook, Size, Revenue, Challenges, Forecast, Analysis, Growth, Value, Share, Trends, Investment Opportunities, Strategy, Restraints, Companies, Demand
- Nigeria Polyhydroxybutyrate-co-Hydroxyvalerate Market (2026-2032) | Value, Investment Opportunities, Analysis, Revenue, Restraints, Pricing, Outlook, Competition, Demand, Growth, Forecast, Companies, Trends, Challenges, segmentation, Drivers, Insights, Share, Size, Strategy
- Nepal Polyhydroxybutyrate-co-Hydroxyvalerate Market (2026-2032) | Insights, Analysis, Drivers, Share, Revenue, Demand, segmentation, Investment Opportunities, Competition, Forecast, Growth, Pricing, Companies, Strategy, Trends, Restraints, Challenges, Outlook, Size, Value
- Myanmar Polyhydroxybutyrate-co-Hydroxyvalerate Market (2026-2032) | Outlook, Revenue, Strategy, Restraints, Drivers, segmentation, Share, Forecast, Competition, Insights, Growth, Pricing, Size, Demand, Value, Companies, Trends, Challenges, Investment Opportunities, Analysis
- Morocco Polyhydroxybutyrate-co-Hydroxyvalerate Market (2026-2032) | Outlook, Investment Opportunities, Restraints, Strategy, Forecast, Challenges, Drivers, Growth, Companies, segmentation, Trends, Size, Competition, Revenue, Demand, Insights, Share, Analysis, Value, Pricing
- Mexico Polyhydroxybutyrate-co-Hydroxyvalerate Market (2026-2032) | Size, Drivers, Outlook, Share, Strategy, Growth, Pricing, Challenges, Companies, Demand, Value, Investment Opportunities, Restraints, Trends, Forecast, segmentation, Analysis, Insights, Competition, Revenue
- Malaysia Polyhydroxybutyrate-co-Hydroxyvalerate Market (2026-2032) | Share, segmentation, Size, Companies, Analysis, Insights, Forecast, Value, Revenue, Drivers, Restraints, Challenges, Investment Opportunities, Trends, Competition, Strategy, Demand, Growth, Outlook, Pricing
Industry Events and Analyst Meet

HIMTEX 2026

India Refining Summit 2026

India EV Show 2026

EV tech India Expo 2026

Auto Tech Asia 2026
Whitepaper
- Middle East & Africa Commercial Security Market Click here to view more.
- Middle East & Africa Fire Safety Systems & Equipment Market Click here to view more.
- GCC Drone Market Click here to view more.
- Middle East Lighting Fixture Market Click here to view more.
- GCC Physical & Perimeter Security Market Click here to view more.
6WResearch In News
- Doha a strategic location for EV manufacturing hub: IPA Qatar
- Demand for luxury TVs surging in the GCC, says Samsung
- Empowering Growth: The Thriving Journey of Bangladesh’s Cable Industry
- Demand for luxury TVs surging in the GCC, says Samsung
- Video call with a traditional healer? Once unthinkable, it’s now common in South Africa
- Intelligent Buildings To Smooth GCC’s Path To Net Zero