Tanzania New Energy Vehicle (NEV) Taxi Market (2025-2031) | Analysis, Segmentation, Forecast, Companies, Industry, Size & Revenue, Share, Trends, Growth, Outlook, Competitive Landscape, Value
Market Forecast By Type (Battery Electric Vehicle, Plug-In Hybrid Electric Vehicle, Hybrid Electric Vehicle), By Rang Type (Intercity, Intracity), By Vehicle Class (Hatchback, Sedan, Utility Vehicle), By Ownership Type (Company Owned, Individually Owned/Private), By Vehicle Level (Entry & Mid-Level, Premium) And Competitive Landscape
| Product Code: ETC9668613 | Publication Date: Sep 2024 | Updated Date: Nov 2025 | Product Type: Market Research Report | |
| Publisher: 6Wresearch | Author: Dhaval Chaurasia | No. of Pages: 75 | No. of Figures: 35 | No. of Tables: 20 |
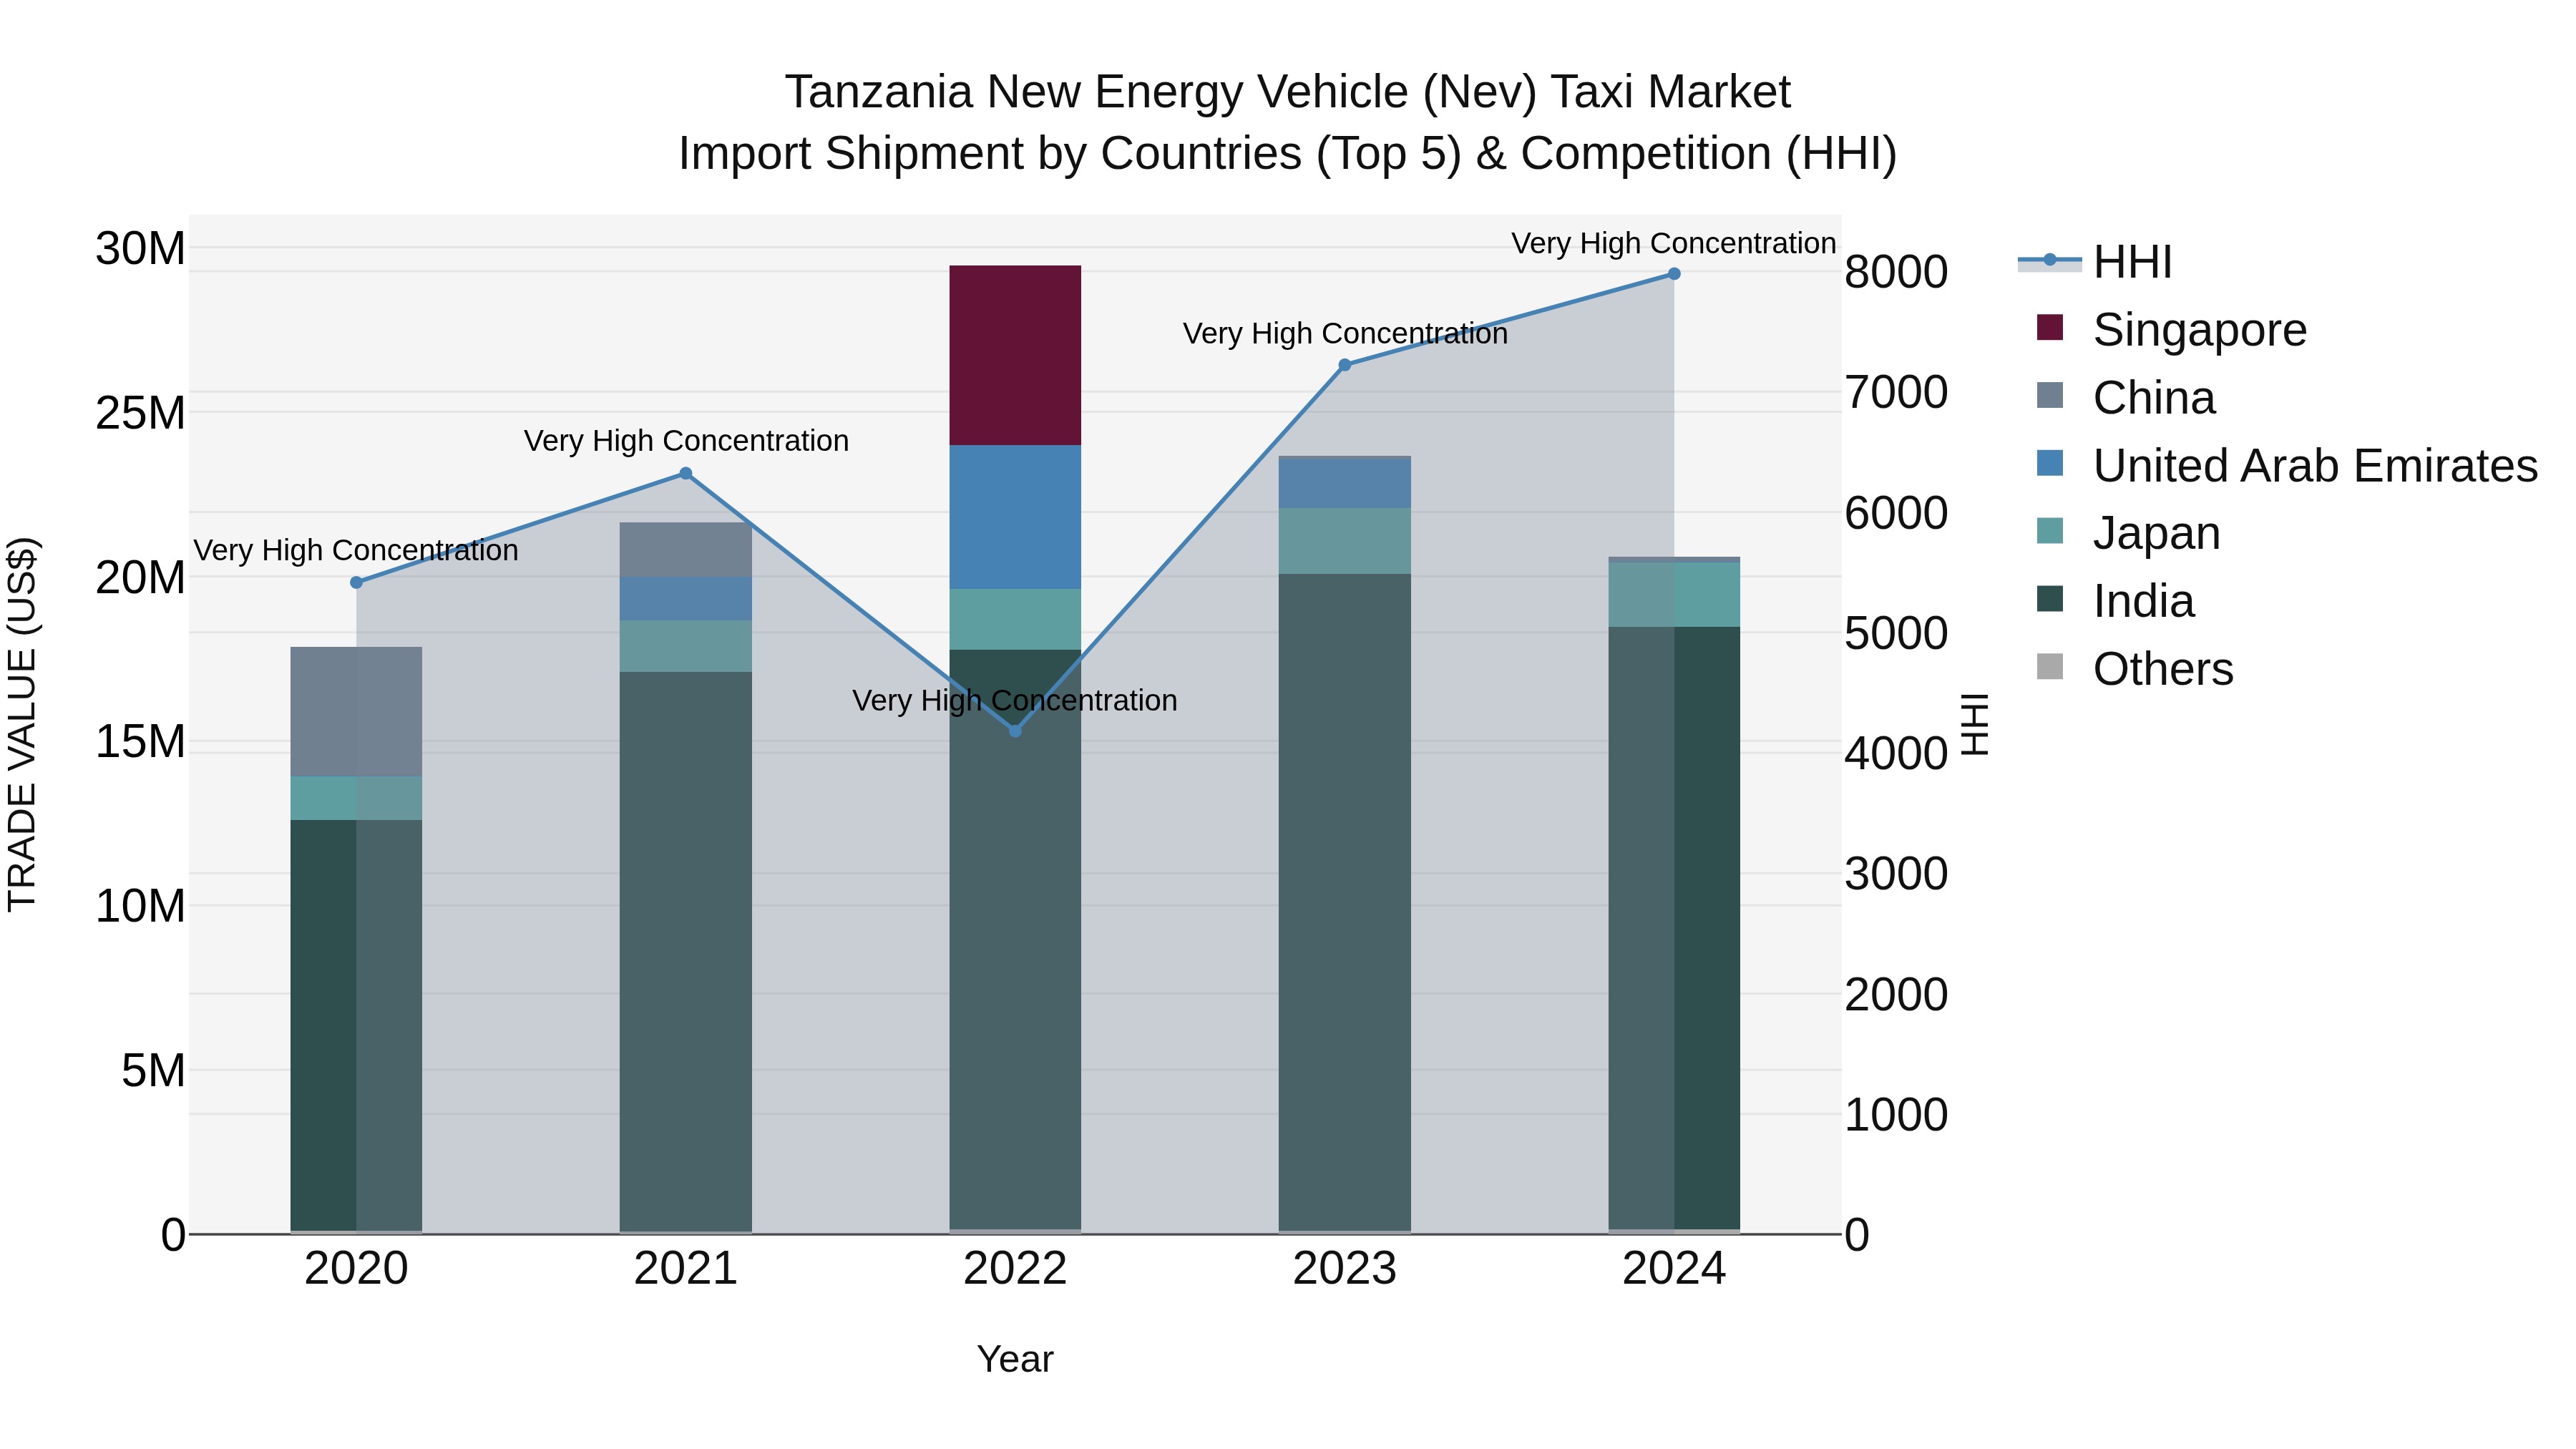
Tanzania New Energy Vehicle (Nev) Taxi Market: Top 5 Importing Countries and Market Competition (HHI) Analysis
The import shipments of new energy vehicles (NEVs) for taxis in Tanzania continued to be dominated by top exporting countries such as India, Japan, China, South Africa, and Germany in 2024. Despite high market concentration indicated by the Herfindahl-Hirschman Index (HHI), the industry saw a modest compound annual growth rate (CAGR) of 3.63% from 2020 to 2024. However, there was a notable decline in growth rate from 2023 to 2024 at -12.95%, signaling potential challenges or shifts in the market dynamics for NEV taxis in Tanzania.
Key Highlights of the Report:
- Tanzania New Energy Vehicle (NEV) Taxi Market Outlook
- Market Size of Tanzania New Energy Vehicle (NEV) Taxi Market, 2024
- Forecast of Tanzania New Energy Vehicle (NEV) Taxi Market, 2031
- Historical Data and Forecast of Tanzania New Energy Vehicle (NEV) Taxi Revenues & Volume for the Period 2021- 2031
- Tanzania New Energy Vehicle (NEV) Taxi Market Trend Evolution
- Tanzania New Energy Vehicle (NEV) Taxi Market Drivers and Challenges
- Tanzania New Energy Vehicle (NEV) Taxi Price Trends
- Tanzania New Energy Vehicle (NEV) Taxi Porter's Five Forces
- Tanzania New Energy Vehicle (NEV) Taxi Industry Life Cycle
- Historical Data and Forecast of Tanzania New Energy Vehicle (NEV) Taxi Market Revenues & Volume By Type for the Period 2021- 2031
- Historical Data and Forecast of Tanzania New Energy Vehicle (NEV) Taxi Market Revenues & Volume By Battery Electric Vehicle for the Period 2021- 2031
- Historical Data and Forecast of Tanzania New Energy Vehicle (NEV) Taxi Market Revenues & Volume By Plug-In Hybrid Electric Vehicle for the Period 2021- 2031
- Historical Data and Forecast of Tanzania New Energy Vehicle (NEV) Taxi Market Revenues & Volume By Hybrid Electric Vehicle for the Period 2021- 2031
- Historical Data and Forecast of Tanzania New Energy Vehicle (NEV) Taxi Market Revenues & Volume By Rang Type for the Period 2021- 2031
- Historical Data and Forecast of Tanzania New Energy Vehicle (NEV) Taxi Market Revenues & Volume By Intercity for the Period 2021- 2031
- Historical Data and Forecast of Tanzania New Energy Vehicle (NEV) Taxi Market Revenues & Volume By Intracity for the Period 2021- 2031
- Historical Data and Forecast of Tanzania New Energy Vehicle (NEV) Taxi Market Revenues & Volume By Vehicle Class for the Period 2021- 2031
- Historical Data and Forecast of Tanzania New Energy Vehicle (NEV) Taxi Market Revenues & Volume By Hatchback for the Period 2021- 2031
- Historical Data and Forecast of Tanzania New Energy Vehicle (NEV) Taxi Market Revenues & Volume By Sedan for the Period 2021- 2031
- Historical Data and Forecast of Tanzania New Energy Vehicle (NEV) Taxi Market Revenues & Volume By Utility Vehicle for the Period 2021- 2031
- Historical Data and Forecast of Tanzania New Energy Vehicle (NEV) Taxi Market Revenues & Volume By Ownership Type for the Period 2021- 2031
- Historical Data and Forecast of Tanzania New Energy Vehicle (NEV) Taxi Market Revenues & Volume By Company Owned for the Period 2021- 2031
- Historical Data and Forecast of Tanzania New Energy Vehicle (NEV) Taxi Market Revenues & Volume By Individually Owned/Private for the Period 2021- 2031
- Historical Data and Forecast of Tanzania New Energy Vehicle (NEV) Taxi Market Revenues & Volume By Vehicle Level for the Period 2021- 2031
- Historical Data and Forecast of Tanzania New Energy Vehicle (NEV) Taxi Market Revenues & Volume By Entry & Mid-Level for the Period 2021- 2031
- Historical Data and Forecast of Tanzania New Energy Vehicle (NEV) Taxi Market Revenues & Volume By Premium for the Period 2021- 2031
- Tanzania New Energy Vehicle (NEV) Taxi Import Export Trade Statistics
- Market Opportunity Assessment By Type
- Market Opportunity Assessment By Rang Type
- Market Opportunity Assessment By Vehicle Class
- Market Opportunity Assessment By Ownership Type
- Market Opportunity Assessment By Vehicle Level
- Tanzania New Energy Vehicle (NEV) Taxi Top Companies Market Share
- Tanzania New Energy Vehicle (NEV) Taxi Competitive Benchmarking By Technical and Operational Parameters
- Tanzania New Energy Vehicle (NEV) Taxi Company Profiles
- Tanzania New Energy Vehicle (NEV) Taxi Key Strategic Recommendations
Frequently Asked Questions About the Market Study (FAQs):
6Wresearch actively monitors the Tanzania New Energy Vehicle (NEV) Taxi Market and publishes its comprehensive annual report, highlighting emerging trends, growth drivers, revenue analysis, and forecast outlook. Our insights help businesses to make data-backed strategic decisions with ongoing market dynamics. Our analysts track relevent industries related to the Tanzania New Energy Vehicle (NEV) Taxi Market, allowing our clients with actionable intelligence and reliable forecasts tailored to emerging regional needs.
Yes, we provide customisation as per your requirements. To learn more, feel free to contact us on sales@6wresearch.com
1 Executive Summary |
2 Introduction |
2.1 Key Highlights of the Report |
2.2 Report Description |
2.3 Market Scope & Segmentation |
2.4 Research Methodology |
2.5 Assumptions |
3 Tanzania New Energy Vehicle (NEV) Taxi Market Overview |
3.1 Tanzania Country Macro Economic Indicators |
3.2 Tanzania New Energy Vehicle (NEV) Taxi Market Revenues & Volume, 2021 & 2031F |
3.3 Tanzania New Energy Vehicle (NEV) Taxi Market - Industry Life Cycle |
3.4 Tanzania New Energy Vehicle (NEV) Taxi Market - Porter's Five Forces |
3.5 Tanzania New Energy Vehicle (NEV) Taxi Market Revenues & Volume Share, By Type, 2021 & 2031F |
3.6 Tanzania New Energy Vehicle (NEV) Taxi Market Revenues & Volume Share, By Rang Type, 2021 & 2031F |
3.7 Tanzania New Energy Vehicle (NEV) Taxi Market Revenues & Volume Share, By Vehicle Class, 2021 & 2031F |
3.8 Tanzania New Energy Vehicle (NEV) Taxi Market Revenues & Volume Share, By Ownership Type, 2021 & 2031F |
3.9 Tanzania New Energy Vehicle (NEV) Taxi Market Revenues & Volume Share, By Vehicle Level, 2021 & 2031F |
4 Tanzania New Energy Vehicle (NEV) Taxi Market Dynamics |
4.1 Impact Analysis |
4.2 Market Drivers |
4.2.1 Government incentives and subsidies for NEV adoption in Tanzania |
4.2.2 Increasing awareness and focus on environmental sustainability |
4.2.3 Rising fuel prices and operational cost savings associated with NEVs in the taxi market |
4.3 Market Restraints |
4.3.1 High initial investment cost for NEVs compared to traditional vehicles |
4.3.2 Limited charging infrastructure in Tanzania |
4.3.3 Concerns around the range and reliability of NEVs for taxi operations |
5 Tanzania New Energy Vehicle (NEV) Taxi Market Trends |
6 Tanzania New Energy Vehicle (NEV) Taxi Market, By Types |
6.1 Tanzania New Energy Vehicle (NEV) Taxi Market, By Type |
6.1.1 Overview and Analysis |
6.1.2 Tanzania New Energy Vehicle (NEV) Taxi Market Revenues & Volume, By Type, 2021- 2031F |
6.1.3 Tanzania New Energy Vehicle (NEV) Taxi Market Revenues & Volume, By Battery Electric Vehicle, 2021- 2031F |
6.1.4 Tanzania New Energy Vehicle (NEV) Taxi Market Revenues & Volume, By Plug-In Hybrid Electric Vehicle, 2021- 2031F |
6.1.5 Tanzania New Energy Vehicle (NEV) Taxi Market Revenues & Volume, By Hybrid Electric Vehicle, 2021- 2031F |
6.2 Tanzania New Energy Vehicle (NEV) Taxi Market, By Rang Type |
6.2.1 Overview and Analysis |
6.2.2 Tanzania New Energy Vehicle (NEV) Taxi Market Revenues & Volume, By Intercity, 2021- 2031F |
6.2.3 Tanzania New Energy Vehicle (NEV) Taxi Market Revenues & Volume, By Intracity, 2021- 2031F |
6.3 Tanzania New Energy Vehicle (NEV) Taxi Market, By Vehicle Class |
6.3.1 Overview and Analysis |
6.3.2 Tanzania New Energy Vehicle (NEV) Taxi Market Revenues & Volume, By Hatchback, 2021- 2031F |
6.3.3 Tanzania New Energy Vehicle (NEV) Taxi Market Revenues & Volume, By Sedan, 2021- 2031F |
6.3.4 Tanzania New Energy Vehicle (NEV) Taxi Market Revenues & Volume, By Utility Vehicle, 2021- 2031F |
6.4 Tanzania New Energy Vehicle (NEV) Taxi Market, By Ownership Type |
6.4.1 Overview and Analysis |
6.4.2 Tanzania New Energy Vehicle (NEV) Taxi Market Revenues & Volume, By Company Owned, 2021- 2031F |
6.4.3 Tanzania New Energy Vehicle (NEV) Taxi Market Revenues & Volume, By Individually Owned/Private, 2021- 2031F |
6.5 Tanzania New Energy Vehicle (NEV) Taxi Market, By Vehicle Level |
6.5.1 Overview and Analysis |
6.5.2 Tanzania New Energy Vehicle (NEV) Taxi Market Revenues & Volume, By Entry & Mid-Level, 2021- 2031F |
6.5.3 Tanzania New Energy Vehicle (NEV) Taxi Market Revenues & Volume, By Premium, 2021- 2031F |
7 Tanzania New Energy Vehicle (NEV) Taxi Market Import-Export Trade Statistics |
7.1 Tanzania New Energy Vehicle (NEV) Taxi Market Export to Major Countries |
7.2 Tanzania New Energy Vehicle (NEV) Taxi Market Imports from Major Countries |
8 Tanzania New Energy Vehicle (NEV) Taxi Market Key Performance Indicators |
8.1 Average daily utilization rate of NEV taxis |
8.2 Number of charging stations deployed in key taxi operating areas |
8.3 Percentage of NEV taxis in the overall taxi fleet |
8.4 Average maintenance cost per NEV taxi |
8.5 Customer satisfaction ratings for NEV taxi services |
9 Tanzania New Energy Vehicle (NEV) Taxi Market - Opportunity Assessment |
9.1 Tanzania New Energy Vehicle (NEV) Taxi Market Opportunity Assessment, By Type, 2021 & 2031F |
9.2 Tanzania New Energy Vehicle (NEV) Taxi Market Opportunity Assessment, By Rang Type, 2021 & 2031F |
9.3 Tanzania New Energy Vehicle (NEV) Taxi Market Opportunity Assessment, By Vehicle Class, 2021 & 2031F |
9.4 Tanzania New Energy Vehicle (NEV) Taxi Market Opportunity Assessment, By Ownership Type, 2021 & 2031F |
9.5 Tanzania New Energy Vehicle (NEV) Taxi Market Opportunity Assessment, By Vehicle Level, 2021 & 2031F |
10 Tanzania New Energy Vehicle (NEV) Taxi Market - Competitive Landscape |
10.1 Tanzania New Energy Vehicle (NEV) Taxi Market Revenue Share, By Companies, 2024 |
10.2 Tanzania New Energy Vehicle (NEV) Taxi Market Competitive Benchmarking, By Operating and Technical Parameters |
11 Company Profiles |
12 Recommendations |
13 Disclaimer |
Pricing
- Single User License$ 1,995
- Department License$ 2,400
- Site License$ 3,120
- Global License$ 3,795

Search
Thought Leadership and Analyst Meet


Our Clients
Related Reports
- Germany Breakfast Food Market (2026-2032) | Industry, Share, Growth, Size, Companies, Value, Analysis, Revenue, Trends, Forecast & Outlook
- Australia Briquette Market (2025-2031) | Growth, Size, Revenue, Forecast, Analysis, Trends, Value, Share, Industry & Companies
- Vietnam System Integrator Market (2025-2031) | Size, Companies, Analysis, Industry, Value, Forecast, Growth, Trends, Revenue & Share
- ASEAN and Thailand Brain Health Supplements Market (2025-2031) | Strategy, Consumer Insights, Analysis, Investment Trends, Opportunities, Growth, Size, Share, Industry, Revenue, Segments, Value, Segmentation, Supply, Forecast, Restraints, Outlook, Competition, Drivers, Trends, Demand, Pricing Analysis, Competitive, Strategic Insights, Companies, Challenges
- ASEAN Bearings Market (2025-2031) | Strategy, Consumer Insights, Analysis, Investment Trends, Opportunities, Growth, Size, Share, Industry, Revenue, Segments, Value, Segmentation, Supply, Forecast, Restraints, Outlook, Competition, Drivers, Trends, Demand, Pricing Analysis, Competitive, Strategic Insights, Companies, Challenges
- Europe Flooring Market (2025-2031) | Outlook, Share, Industry, Trends, Forecast, Companies, Revenue, Size, Analysis, Growth & Value
- Saudi Arabia Manlift Market (2025-2031) | Outlook, Size, Growth, Trends, Companies, Industry, Revenue, Value, Share, Forecast & Analysis
- Uganda Excavator, Crane, and Wheel Loaders Market (2025-2031) | Strategy, Consumer Insights, Analysis, Investment Trends, Opportunities, Growth, Size, Share, Industry, Revenue, Segments, Value, Segmentation, Supply, Forecast, Restraints, Outlook, Competition, Drivers, Trends, Demand, Pricing Analysis, Competitive, Strategic Insights, Companies, Challenges
- Rwanda Excavator, Crane, and Wheel Loaders Market (2025-2031) | Strategy, Consumer Insights, Analysis, Investment Trends, Opportunities, Growth, Size, Share, Industry, Revenue, Segments, Value, Segmentation, Supply, Forecast, Restraints, Outlook, Competition, Drivers, Trends, Demand, Pricing Analysis, Competitive, Strategic Insights, Companies, Challenges
- Kenya Excavator, Crane, and Wheel Loaders Market (2025-2031) | Strategy, Consumer Insights, Analysis, Investment Trends, Opportunities, Growth, Size, Share, Industry, Revenue, Segments, Value, Segmentation, Supply, Forecast, Restraints, Outlook, Competition, Drivers, Trends, Demand, Pricing Analysis, Competitive, Strategic Insights, Companies, Challenges
Industry Events and Analyst Meet

Startup Hub Expo 2025

Automechanika Dubai 2024

Mobile India Expo 2025

Media Expo New Delhi 2025

Consumer Electronics World Expo 2025
Whitepaper
- Middle East & Africa Commercial Security Market Click here to view more.
- Middle East & Africa Fire Safety Systems & Equipment Market Click here to view more.
- GCC Drone Market Click here to view more.
- Middle East Lighting Fixture Market Click here to view more.
- GCC Physical & Perimeter Security Market Click here to view more.
6WResearch In News
- Doha a strategic location for EV manufacturing hub: IPA Qatar
- Demand for luxury TVs surging in the GCC, says Samsung
- Empowering Growth: The Thriving Journey of Bangladesh’s Cable Industry
- Demand for luxury TVs surging in the GCC, says Samsung
- Video call with a traditional healer? Once unthinkable, it’s now common in South Africa
- Intelligent Buildings To Smooth GCC’s Path To Net Zero