Tanzania Niobium Market (2026-2032) Outlook | Growth, Industry, Value, Companies, Share, Revenue, Forecast, Trends, Analysis, Size
Market Forecast By Occurrence (Carbonatites and Associates, Columbite-Tantalite), By Type (Ferroniobium, Niobium Oxide, Niobium Metal, Vacuum Grade Niobium Alloys), By Application (Steel, Super Alloys, Superconducting Magnets, Capacitors, Glass, Others), By End-user Industry (Construction, Automotive and Transportation, Aerospace and Defence, Oil and Gas, Others) And Competitive Landscape
| Product Code: ETC197827 | Publication Date: May 2022 | Updated Date: Jun 2026 | Product Type: Market Research Report | |
| Publisher: 6Wresearch | Author: Ravi Bhandari | No. of Pages: 60 | No. of Figures: 40 | No. of Tables: 7 |
Tanzania Niobium Market Size, Share & Growth Rate
The Tanzania Niobium Market was estimated at USD 382 Million in 2025 and is projected to reach USD 527 Million by 2032, growing at a CAGR of 4.7% from 2026 to 2032. This growth trajectory is largely driven by the surging demand for niobium in key sectors such as aerospace, automotive, and electronics. The increasing emphasis on sustainable materials for construction and manufacturing further fuels the market, with niobium's unique properties positioning it as an essential alloying element in advanced steel applications.
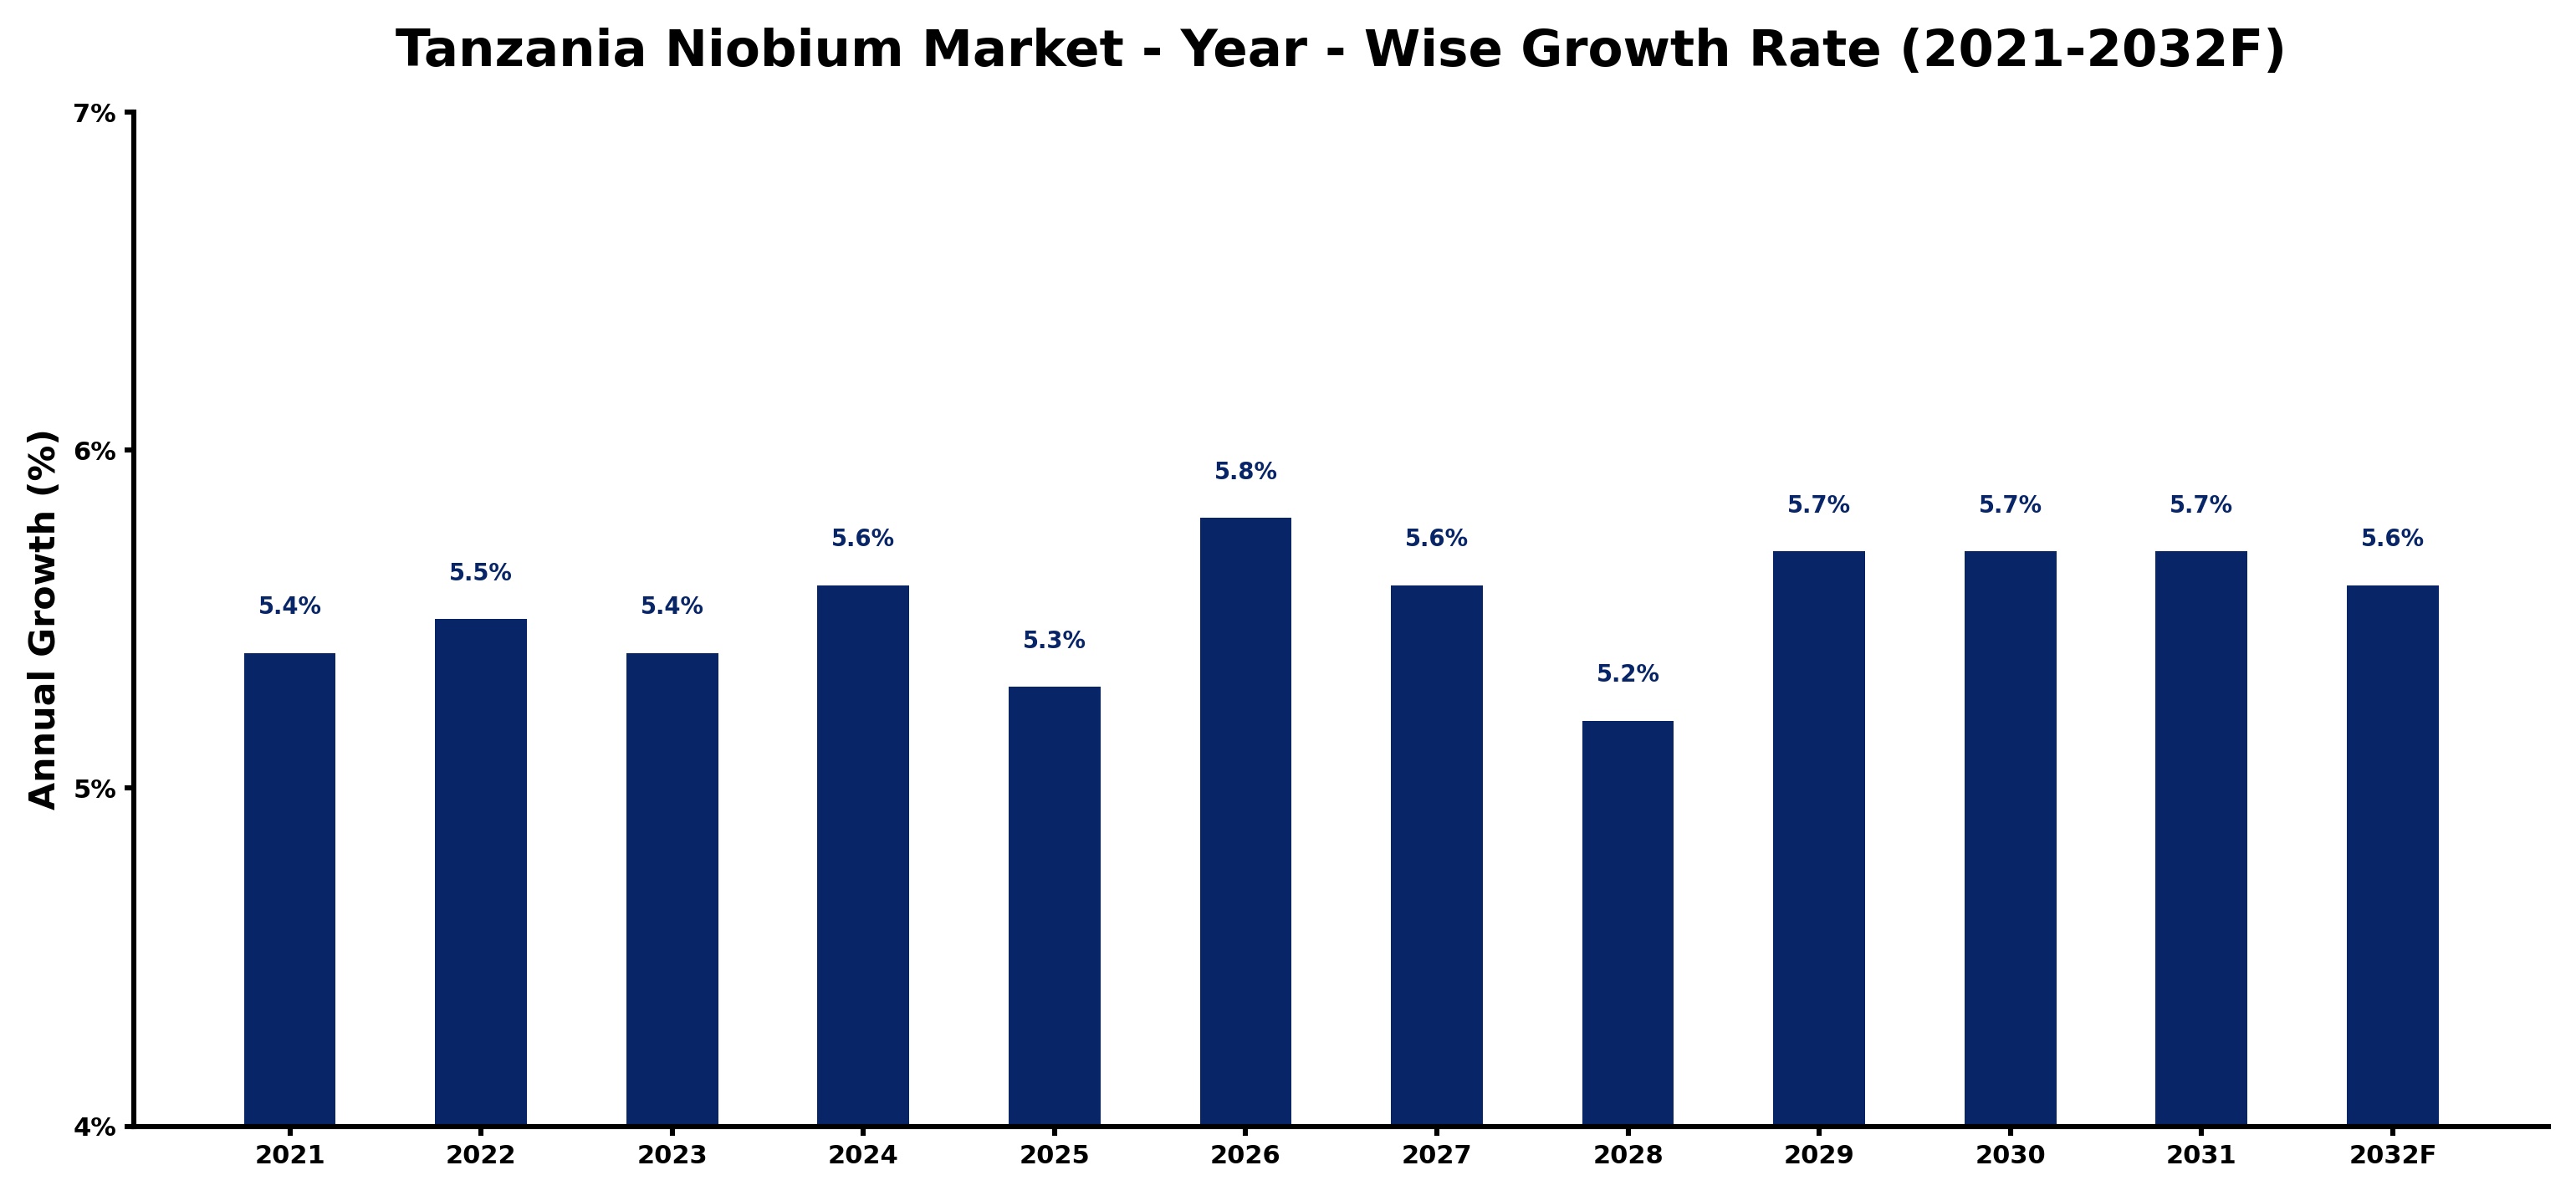
Tanzania Niobium Market Growth Rate Analysis (2021-2032)
The Tanzania niobium market has shown stable growth, with annual increases around 5.4% to 5.8% projected over the coming years. The growth from 5.4% in 2021 to 5.6% in 2024 can largely be attributed to rising demand from sectors such as aerospace and renewable energy, where niobium's unique properties are highly valued. By 2026, a peak growth of 5.8% reflects significant investments in mining infrastructure and technology enhancements, streamlining extraction processes. However, this growth is interspersed with slight fluctuations, including a dip to 5.3% in 2025, driven by global supply chain disruptions. A strong policy framework supporting sustainable mining practices continues to underpin market stability, further reinforcing a robust demand outlook through the end of the decade.
Tanzania Niobium Market Year-wise Growth Rate and Key Drivers
This graph highlights how the Tanzania Niobium Market has steadily grown over the past five years, supported by major growth factors.
The table below presents the year‑wise growth rates along with the key drivers influencing the market
| Year | Growth Rate | Major Drivers |
| 2021 | 5.4% | Increased mining exploration activities |
| 2022 | 5.5% | New processing technologies emerged |
| 2023 | 5.4% | Rising demand from electronics sector |
| 2024 | 5.6% | Infrastructure development enhanced logistics |
| 2025 | 5.3% | Investment in sustainable practices increased |
| 2026 | 5.8% | Global market demand strengthened significantly |
| 2027 | 5.6% | Strategic partnerships expanded reach |
| 2028 | 5.2% | Government incentives attracted investments |
| 2029 | 5.7% | Research initiatives improved product quality |
| 2030 | 5.7% | Export opportunities broadened market access |
| 2031 | 5.7% | Technological advancements enhanced production |
| 2032 | 5.6% | Consumer awareness of niobium benefits |
Note - Market size estimations and growth projections presented in this report are based on 6Wresearch’s advanced forecasting approach, validated with industry datasets as of June 2026.
Tanzania Niobium Market Synopsis
Currently, the Tanzania niobium market is characterized by a robust demand stemming from its significant reserves and the rising necessity for high-performance materials. The country's geological endowment offers substantial potential for both domestic and international investments, especially as global industries pivot towards more durable and efficient materials.
The interest in niobium has intensified, propelled by its critical role in the manufacture of high-strength steels used in modern construction and transportation. As technologies advance, Tanzania's niobium sector is poised to become a vital contributor to the region’s industrial landscape, fostering economic development and innovation.
Tanzania Niobium Market Key Takeaways
- The Tanzania niobium market is projected to grow from USD 382 Million in 2025 to USD 527 Million by 2032.
- Increased applications of niobium in sustainable energy solutions are driving demand.
- Tanzania's rich mineral reserves present significant investment opportunities for global players.
- Strategic government policies are designed to bolster the mining sector and attract foreign investment.
- Advancements in extraction and processing technologies are vital for market expansion.
Evaluation of Restraints in Tanzania Niobium Market
Despite the promising outlook, the Tanzania niobium market faces real challenges that could hinder its growth. A significant concern is the inadequate infrastructure for mining and processing, which complicates the efficient extraction and production of niobium. Moreover, Tanzanian producers are contending with competition from established niobium suppliers in other regions, often leading to pricing pressures that affect market share. Additionally, access to modern technology and a skilled workforce remains limited, further constraining operational efficiency in the sector.
Tanzania Niobium Market Trends
Several trends are currently shaping the Tanzania niobium market, particularly the increasing demand from the aerospace and automotive industries for lightweight, high-strength materials. The construction sector is increasingly adopting niobium-containing alloys for their superior durability and resistance to corrosion. Furthermore, as global initiatives push for more sustainable energy solutions, niobium is gaining traction for its applications in wind turbine production and electric vehicle batteries, which adds to its desirability in the market.
Tanzania Niobium Market Opportunities
Opportunities for growth in the Tanzania niobium market are abundant, particularly as global demand surges. Investors have a unique chance to engage in niobium mining and exploration projects, given the country's considerable mineral reserves. Collaborating with local mining companies can enhance operational capabilities and foster community relationships, paving the way for sustainable practices. Additionally, as industries seek more durable and lightweight materials, the increasing applications of niobium in construction and automotive sectors present exciting avenues for investment.
Government Initiatives in the Tanzania Niobium Market
The government of Tanzania has initiated several policies to stimulate the development of the niobium sector. These include offering tax incentives to attract foreign investments and supporting local miners in their efforts to enhance extraction and processing capabilities. The Tanzania Mineral Policy of 2009 emphasizes the importance of value addition and sustainable practices in mining. By regulating the sector effectively, the government aims to foster economic growth, create jobs, and ensure environmentally responsible mining practices.
Future Insights of the Tanzania Niobium Market
Looking ahead to 2026-2032, the Tanzania niobium market is expected to continue its upward trend, driven by a combination of domestic resource availability and increasing international demand. Advancements in technology and infrastructure will be critical in harnessing the full potential of Tanzania's niobium reserves. However, addressing challenges related to regulatory hurdles and enhancing industry capabilities will be paramount in ensuring that this growth trajectory is realized. With the right investments and focus on sustainable practices, Tanzania is well-positioned to become a major player in the global niobium market.
Tanzania Niobium Market Latest Developments (May 2025 - June 2026)
Recent developments in the Tanzania niobium market indicate a growing interest from international investors in the region's rich mineral resources. Strategic partnerships are being formed, aimed at enhancing mining and processing capabilities. Additionally, infrastructure projects aimed at improving accessibility to mining sites are gaining traction, which should bolster production efficiency and increase the output of niobium. The ongoing emphasis on sustainable mining practices is also shaping the strategic direction of the market, aligning with global trends toward environmental responsibility.
Tanzania Niobium Market - Key Attractiveness of the Report
- 10 Years of Market Numbers
- Historical Data Starting from 2022 to 2025
- Base Year: 2025
- Forecast Data until 2032
- Key Performance Indicators Impacting the Market
- Major Upcoming Developments and Projects
Key Highlights of the Report:
- Tanzania Niobium Market Outlook
- Market Size of Tanzania Niobium Market, 2025
- Forecast of Tanzania Niobium Market, 2032
- Historical Data and Forecast of Tanzania Niobium Revenues & Volume for the Period 2022-2032F
- Tanzania Niobium Market Trend Evolution
- Tanzania Niobium Market Drivers and Challenges
- Tanzania Niobium Price Trends
- Tanzania Niobium Porter's Five Forces
- Tanzania Niobium Industry Life Cycle
- Historical Data and Forecast of Tanzania Niobium Market Revenues & Volume By Occurrence for the Period 2022-2032F
- Historical Data and Forecast of Tanzania Niobium Market Revenues & Volume By Carbonatites and Associates for the Period 2022-2032F
- Historical Data and Forecast of Tanzania Niobium Market Revenues & Volume By Columbite-Tantalite for the Period 2022-2032F
- Historical Data and Forecast of Tanzania Niobium Market Revenues & Volume By Type for the Period 2022-2032F
- Historical Data and Forecast of Tanzania Niobium Market Revenues & Volume By Ferroniobium for the Period 2022-2032F
- Historical Data and Forecast of Tanzania Niobium Market Revenues & Volume By Niobium Oxide for the Period 2022-2032F
- Historical Data and Forecast of Tanzania Niobium Market Revenues & Volume By Niobium Metal for the Period 2022-2032F
- Historical Data and Forecast of Tanzania Niobium Market Revenues & Volume By Vacuum Grade Niobium Alloys for the Period 2022-2032F
- Historical Data and Forecast of Tanzania Niobium Market Revenues & Volume By Application for the Period 2022-2032F
- Historical Data and Forecast of Tanzania Niobium Market Revenues & Volume By Steel for the Period 2022-2032F
- Historical Data and Forecast of Tanzania Niobium Market Revenues & Volume By Super Alloys for the Period 2022-2032F
- Historical Data and Forecast of Tanzania Niobium Market Revenues & Volume By Superconducting Magnets for the Period 2022-2032F
- Historical Data and Forecast of Tanzania Niobium Market Revenues & Volume By Capacitors for the Period 2022-2032F
- Historical Data and Forecast of Tanzania Niobium Market Revenues & Volume By Glass for the Period 2022-2032F
- Historical Data and Forecast of Tanzania Niobium Market Revenues & Volume By Others for the Period 2022-2032F
- Historical Data and Forecast of Tanzania Niobium Market Revenues & Volume By End-user Industry for the Period 2022-2032F
- Historical Data and Forecast of Tanzania Niobium Market Revenues & Volume By Construction for the Period 2022-2032F
- Historical Data and Forecast of Tanzania Niobium Market Revenues & Volume By Automotive and Transportation for the Period 2022-2032F
- Historical Data and Forecast of Tanzania Niobium Market Revenues & Volume By Aerospace and Defence for the Period 2022-2032F
- Historical Data and Forecast of Tanzania Niobium Market Revenues & Volume By Oil and Gas for the Period 2022-2032F
- Historical Data and Forecast of Tanzania Niobium Market Revenues & Volume By Others for the Period 2022-2032F
- Tanzania Niobium Import Export Trade Statistics
- Market Opportunity Assessment By Occurrence
- Market Opportunity Assessment By Type
- Market Opportunity Assessment By Application
- Market Opportunity Assessment By End-user Industry
- Tanzania Niobium Top Companies Market Share
- Tanzania Niobium Competitive Benchmarking By Technical and Operational Parameters
- Tanzania Niobium Company Profiles
- Tanzania Niobium Key Strategic Recommendations
Tanzania Niobium Market - Frequently Asked Questions
The increasing application of niobium in high-strength steel for automotive, aerospace, and construction industries is a significant driver. As industries seek stronger and more durable materials, niobium's unique properties make it an ideal choice.
The Tanzania Niobium Market was estimated at USD 382 Million in 2025 and is projected to reach USD 527 Million by 2032, representing a CAGR of 4.7% from 2026 to 2032, indicating a robust growth outlook.
The Tanzanian government is actively promoting the niobium sector through tax incentives and regulations that support sustainable mining practices, which helps attract investment and bolster local mining operations.
Key challenges include inadequate infrastructure for mining and processing, competition from established global suppliers, and limited access to advanced technology and skilled labor.
With ongoing investments in technology and infrastructure, coupled with a global shift towards sustainable materials, the Tanzania niobium market is anticipated to expand and diversify its applications across various industries.
The aerospace, automotive, and electronics sectors are expected to be the primary drivers of niobium demand in Tanzania, as these industries increasingly require lightweight and high-strength materials for their products.
6Wresearch actively monitors the Tanzania Niobium Market and publishes its comprehensive annual report, highlighting emerging trends, growth drivers, revenue analysis, and forecast outlook. Our insights help businesses to make data-backed strategic decisions with ongoing market dynamics. Our analysts track relevent industries related to the Tanzania Niobium Market, allowing our clients with actionable intelligence and reliable forecasts tailored to emerging regional needs.
Yes, we provide customisation as per your requirements. To learn more, feel free to contact us on sales@6wresearch.com
1 Executive Summary |
2 Introduction |
2.1 Key Highlights of the Report |
2.2 Report Description |
2.3 Market Scope & Segmentation |
2.4 Research Methodology |
2.5 Assumptions |
3 Tanzania Niobium Market Overview |
3.1 Tanzania Country Macro Economic Indicators |
3.2 Tanzania Niobium Market Revenues & Volume, 2022 & 2032F |
3.3 Tanzania Niobium Market - Industry Life Cycle |
3.4 Tanzania Niobium Market - Porter's Five Forces |
3.5 Tanzania Niobium Market Revenues & Volume Share, By Occurrence, 2022 & 2032F |
3.6 Tanzania Niobium Market Revenues & Volume Share, By Type, 2022 & 2032F |
3.7 Tanzania Niobium Market Revenues & Volume Share, By Application, 2022 & 2032F |
3.8 Tanzania Niobium Market Revenues & Volume Share, By End-user Industry, 2022 & 2032F |
4 Tanzania Niobium Market Dynamics |
4.1 Impact Analysis |
4.2 Market Drivers |
4.2.1 Increasing demand for niobium in the aerospace industry for manufacturing superalloys |
4.2.2 Growth in the automotive sector leading to higher demand for niobium-containing high-strength steels |
4.2.3 Technological advancements in niobium extraction and processing techniques |
4.3 Market Restraints |
4.3.1 Fluctuating prices of niobium in the global market impacting profitability |
4.3.2 Limited availability of niobium ore reserves in Tanzania |
4.3.3 Regulatory challenges and environmental concerns related to niobium mining |
5 Tanzania Niobium Market Trends |
6 Tanzania Niobium Market, By Types |
6.1 Tanzania Niobium Market, By Occurrence |
6.1.1 Overview and Analysis |
6.1.2 Tanzania Niobium Market Revenues & Volume, By Occurrence, 2022-2032F |
6.1.3 Tanzania Niobium Market Revenues & Volume, By Carbonatites and Associates, 2022-2032F |
6.1.4 Tanzania Niobium Market Revenues & Volume, By Columbite-Tantalite, 2022-2032F |
6.2 Tanzania Niobium Market, By Type |
6.2.1 Overview and Analysis |
6.2.2 Tanzania Niobium Market Revenues & Volume, By Ferroniobium, 2022-2032F |
6.2.3 Tanzania Niobium Market Revenues & Volume, By Niobium Oxide, 2022-2032F |
6.2.4 Tanzania Niobium Market Revenues & Volume, By Niobium Metal, 2022-2032F |
6.2.5 Tanzania Niobium Market Revenues & Volume, By Vacuum Grade Niobium Alloys, 2022-2032F |
6.3 Tanzania Niobium Market, By Application |
6.3.1 Overview and Analysis |
6.3.2 Tanzania Niobium Market Revenues & Volume, By Steel, 2022-2032F |
6.3.3 Tanzania Niobium Market Revenues & Volume, By Super Alloys, 2022-2032F |
6.3.4 Tanzania Niobium Market Revenues & Volume, By Superconducting Magnets, 2022-2032F |
6.3.5 Tanzania Niobium Market Revenues & Volume, By Capacitors, 2022-2032F |
6.3.6 Tanzania Niobium Market Revenues & Volume, By Glass, 2022-2032F |
6.3.7 Tanzania Niobium Market Revenues & Volume, By Others, 2022-2032F |
6.4 Tanzania Niobium Market, By End-user Industry |
6.4.1 Overview and Analysis |
6.4.2 Tanzania Niobium Market Revenues & Volume, By Construction, 2022-2032F |
6.4.3 Tanzania Niobium Market Revenues & Volume, By Automotive and Transportation, 2022-2032F |
6.4.4 Tanzania Niobium Market Revenues & Volume, By Aerospace and Defence, 2022-2032F |
6.4.5 Tanzania Niobium Market Revenues & Volume, By Oil and Gas, 2022-2032F |
6.4.6 Tanzania Niobium Market Revenues & Volume, By Others, 2022-2032F |
7 Tanzania Niobium Market Import-Export Trade Statistics |
7.1 Tanzania Niobium Market Export to Major Countries |
7.2 Tanzania Niobium Market Imports from Major Countries |
8 Tanzania Niobium Market Key Performance Indicators |
8.1 Research and development investment in niobium extraction technologies |
8.2 Percentage of niobium used in high-value applications |
8.3 Number of new partnerships or collaborations for niobium supply and distribution |
8.4 Environmental sustainability metrics in niobium mining operations |
8.5 Adoption rate of niobium-enhanced materials in key industries |
9 Tanzania Niobium Market - Opportunity Assessment |
9.1 Tanzania Niobium Market Opportunity Assessment, By Occurrence, 2022 & 2032F |
9.2 Tanzania Niobium Market Opportunity Assessment, By Type, 2022 & 2032F |
9.3 Tanzania Niobium Market Opportunity Assessment, By Application, 2022 & 2032F |
9.4 Tanzania Niobium Market Opportunity Assessment, By End-user Industry, 2022 & 2032F |
10 Tanzania Niobium Market - Competitive Landscape |
10.1 Tanzania Niobium Market Revenue Share, By Companies, 2025 |
10.2 Tanzania Niobium Market Competitive Benchmarking, By Operating and Technical Parameters |
11 Company Profiles |
12 Recommendations |
13 Disclaimer |
Global Go To Market Strategy - 2030
Export potential enables firms to identify high-growth global markets with greater confidence by combining advanced trade intelligence with a structured quantitative methodology. The framework analyzes emerging demand trends and country-level import patterns while integrating macroeconomic and trade datasets such as GDP and population forecasts, bilateral import–export flows, tariff structures, elasticity differentials between developed and developing economies, geographic distance, and import demand projections. Using weighted trade values from 2020–2024 as the base period to project country-to-country export potential for 2030, these inputs are operationalized through calculated drivers such as gravity model parameters, tariff impact factors, and projected GDP per-capita growth. Through an analysis of hidden potentials, demand hotspots, and market conditions that are most favorable to success, this method enables firms to focus on target countries, maximize returns, and global expansion with data, backed by accuracy.
By factoring in the projected importer demand gap that is currently unmet and could be potential opportunity, it identifies the potential for the Exporter (Country) among 190 countries, against the general trade analysis, which identifies the biggest importer or exporter.
To discover high-growth global markets and optimize your business strategy:
Click Here
Pricing
- Single User License$ 1,995
- Department License$ 2,400
- Site License$ 3,120
- Global License$ 3,795

Leadership Perspectives from Industry Events
Search
Thought Leadership and Analyst Meet


Our Clients
6WResearch In News
- India Air Conditioner Market Set for Strong Rebound in 2026 After Weather-Led Correction and GST-Driven Recovery: 6Wresearch
- ADAS in India: How Automatic Emergency Braking, Blind Spot Detection & Driver Monitoring are Transforming Road Safety
- Doha a strategic location for EV manufacturing hub: IPA Qatar
- Demand for luxury TVs surging in the GCC, says Samsung
- Empowering Growth: The Thriving Journey of Bangladesh’s Cable Industry
- Demand for luxury TVs surging in the GCC, says Samsung
Latest Reports
- Nicaragua RPG Gaming Market (2026-2032)
- New Zealand RPG Gaming Market (2026-2032)
- Netherlands RPG Gaming Market (2026-2032)
- Nauru RPG Gaming Market (2026-2032)
- Namibia RPG Gaming Market (2026-2032)
- Mozambique RPG Gaming Market (2026-2032)
- Montenegro RPG Gaming Market (2026-2032)
- Mongolia RPG Gaming Market (2026-2032)
- Monaco RPG Gaming Market (2026-2032)
- Micronesia RPG Gaming Market (2026-2032)
Industry Events and Analyst Meet

HIMTEX 2026

India Refining Summit 2026

India EV Show 2026

EV tech India Expo 2026

Auto Tech Asia 2026
Whitepaper
- Middle East & Africa Commercial Security Market Click here to view more.
- Middle East & Africa Fire Safety Systems & Equipment Market Click here to view more.
- GCC Drone Market Click here to view more.
- Middle East Lighting Fixture Market Click here to view more.
- GCC Physical & Perimeter Security Market Click here to view more.