Tanzania Service Virtualization Market Size & Growth Rate (2026-2032)
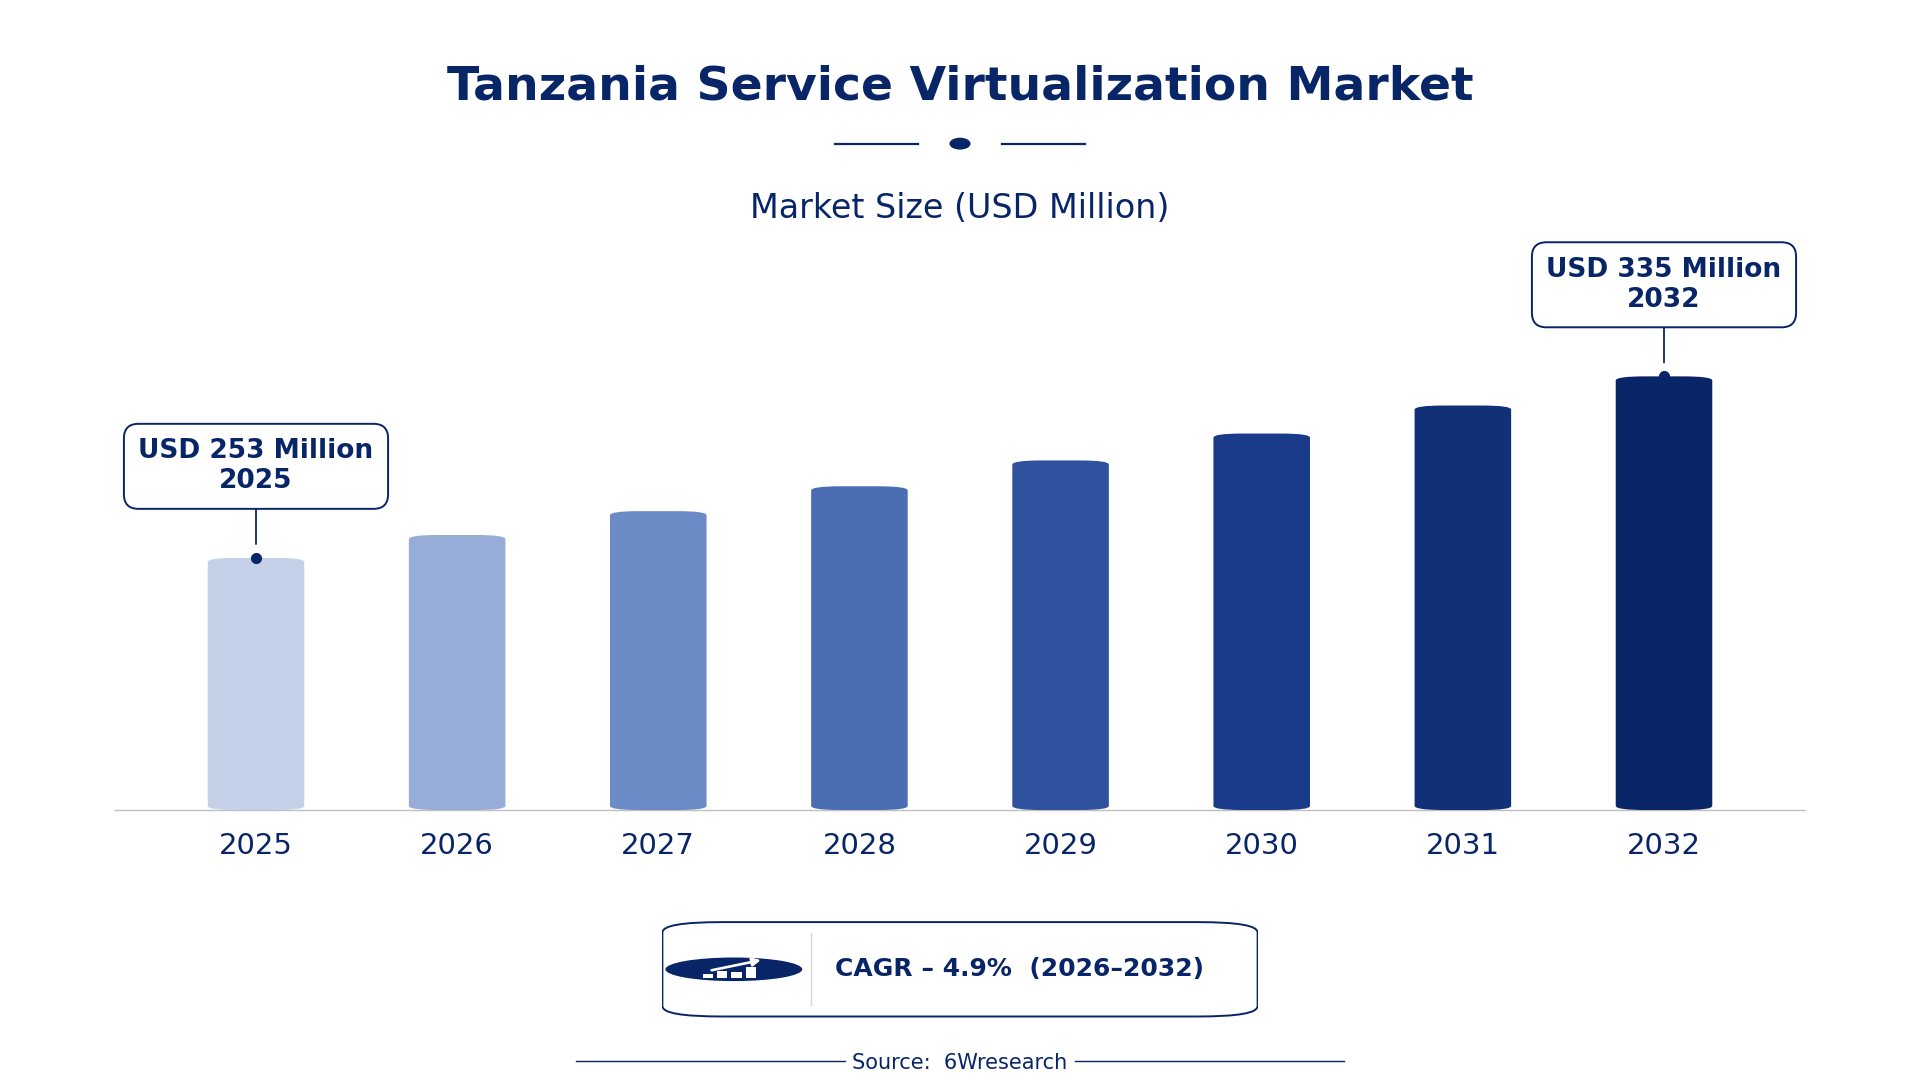
The Tanzania Service Virtualization Market was estimated at USD 253 Million in 2025 and is projected to reach USD 335 Million by 2032, growing at a CAGR of 4.9% from 2026 to 2032.
Tanzania Service Virtualization Market Synopsis
The growing need for efficient software testing processes in Tanzania is pushing businesses to adopt service virtualization technologies. This approach allows organizations to create simulated environments that accelerate application testing, thereby minimizing risks and operational costs associated with traditional methods.
As companies in sectors like IT, telecom, and healthcare increasingly embrace digital transformation, the demand for tailored service virtualization solutions is on the rise. Cloud-based options, in particular, are gaining traction due to their flexibility and scalability, making them an attractive choice for Tanzanian enterprises.
Tanzania Service Virtualization Market Year-wise Growth Rate and Key Drivers
This graph illustrates the annual growth rates of the Tanzania Service Virtualization Market from 2021 to 2032, highlighting a steady upward trajectory and projected expansion over the forecast period.
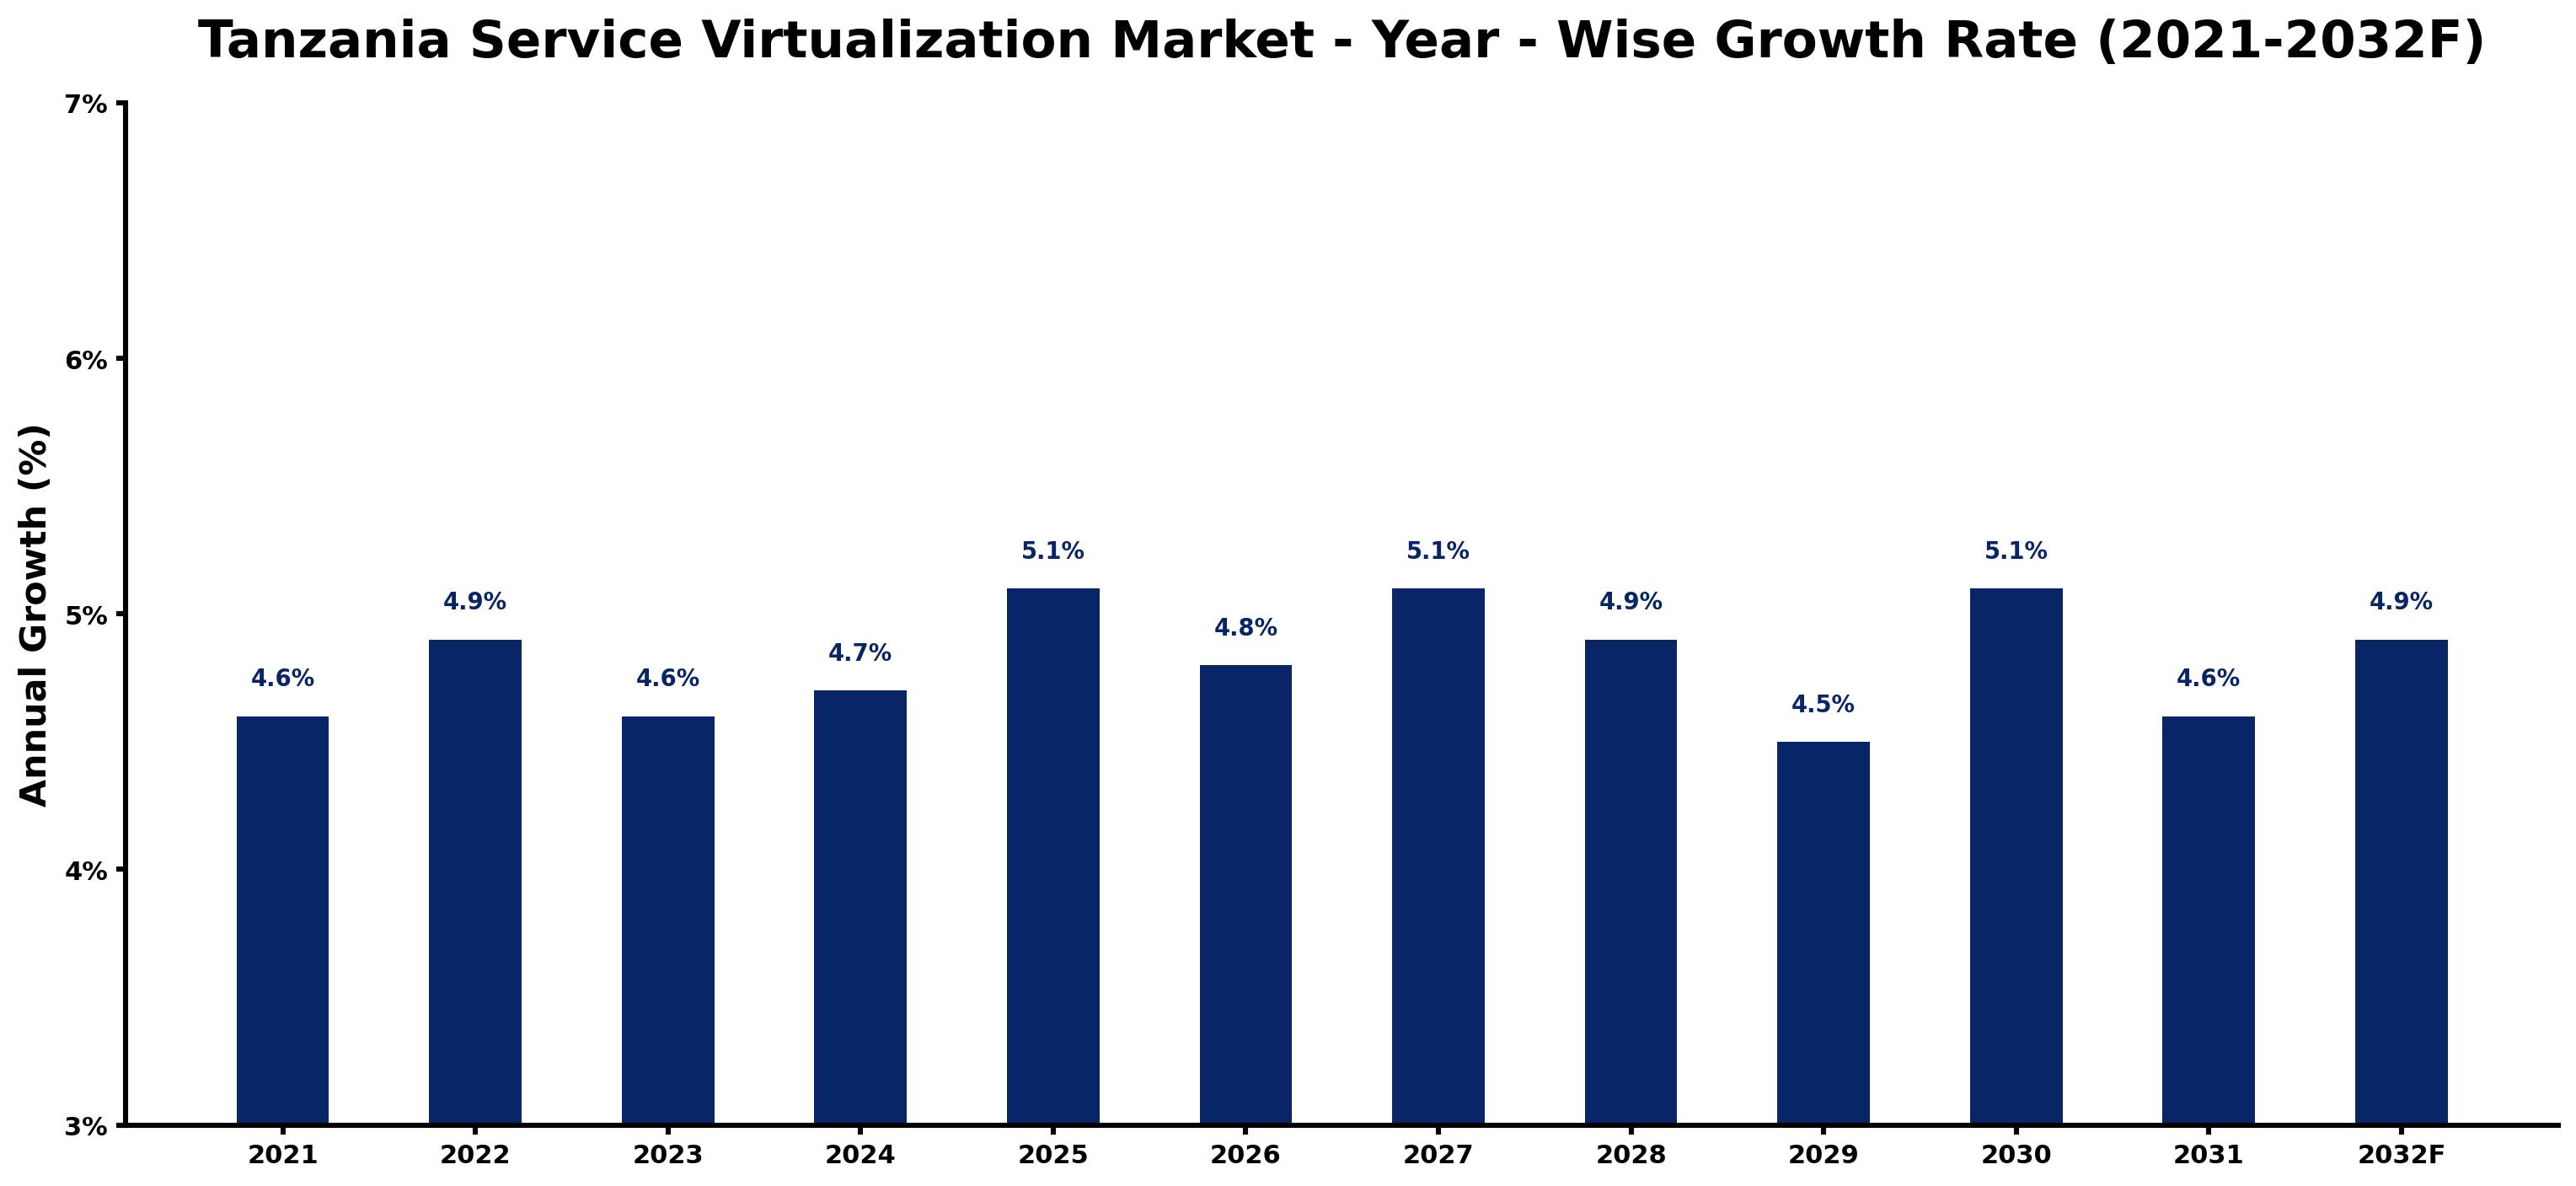
The table below presents the year‑wise growth rates along with the key drivers influencing the market
| Year | Growth Rate | Major Drivers |
| 2021 | 4.6% | Limited access to IT services driving virtualization adoption. |
| 2022 | 4.9% | Emerging cloud computing initiatives attracting local startups. |
| 2023 | 4.6% | Increased cybersecurity concerns prompting service virtualization. |
| 2024 | 4.7% | Local tech hubs fostering innovation in virtual services. |
| 2025 | 5.1% | Government training programs boosting IT skills for virtualization. |
| 2026 | 4.8% | Tanzania's youth demographic increasing software service demand. |
| 2027 | 5.1% | E-commerce growth necessitating improved service delivery methods. |
| 2028 | 4.9% | Rise of fintech solutions catalyzing virtualization opportunities. |
| 2029 | 4.5% | Mobile penetration encouraging virtual service expansions. |
| 2030 | 5.1% | Public sector digitalization efforts requiring virtualized solutions. |
| 2031 | 4.6% | Development of local data centers improving service efficiency. |
| 2032 | 4.9% | Increased mobile app usage boosting virtualization needs. |
Note: Market size estimations and growth projections presented in this report are based on 6Wresearch's proprietary forecasting methodology, utilizing the latest available industry data, government publications, and primary research inputs.
Tanzania Service Virtualization Market Key Takeaways
Below are some of the specific key takeaways from the market, including:
- The market is experiencing steady growth fueled by the adoption of cloud-based virtualization solutions.
- Businesses are increasingly focusing on agile and DevOps practices to enhance software delivery efficiency.
- There is a notable lack of awareness among SMEs regarding the benefits of service virtualization.
- The government is implementing policies to support digital transformation and ICT infrastructure improvements.
- Investment opportunities exist in various sectors, especially e-commerce and healthcare, focusing on virtual services.
Evaluation of Restraints in Tanzania Service Virtualization Market
Limited understanding of service virtualization remains a significant barrier to growth in Tanzania. Many small and medium enterprises (SMEs) are hesitant to implement these solutions due to insufficient knowledge about their advantages. Furthermore, a shortage of skilled professionals capable of utilizing service virtualization tools effectively inhibits optimal deployment. Budget constraints also play a role, as the initial investments required for necessary infrastructure may deter companies from exploring this innovative approach.
Tanzania Service Virtualization Market Trends
A key trend in the Tanzania Service Virtualization Market is the surge in cloud-based solutions. Organizations are shifting towards these platforms to streamline their software development and testing processes. This trend aligns with the increasing emphasis on agile methodologies and DevOps practices, necessitating a quicker and more efficient software delivery pipeline. The focus on improving software quality has prompted businesses to invest in tools that simulate complex system dependencies, allowing for comprehensive testing.
Tanzania Service Virtualization Market Opportunities
The market is ripe for investment, especially in e-commerce, telecommunication, and healthcare. As digitalization grows, companies are seeking innovative solutions that can enhance customer experience and operational efficiency. Opportunities exist for service virtualization providers to create unique offerings such as virtual customer service platforms, telemedicine solutions, and online learning environments. Supporting infrastructure and training services tailored for these sectors could also represent lucrative avenues for investment.
Government Initiatives in the Tanzania Service Virtualization Market
Government policies are increasingly fostering growth in the Tanzania Service Virtualization Market, focusing on digital transformation and ICT access. The Tanzania Communications Regulatory Authority (TCRA) is working to ensure fair competition within the telecom sector, which is crucial for expanding service virtualization applications. These efforts are essential for creating an environment conducive to innovation and investment in virtualization technologies.
- A recent initiative launched in late 2025 aims to upgrade national ICT infrastructure to facilitate better access for businesses.
- Current programs are underway that focus on enhancing cybersecurity measures to protect digital services, which is vital for service virtualization applications.
- Plans are in place for a public-private partnership expected to be announced in 2026, aimed at expanding telecom infrastructure throughout rural areas.
- The government’s National ICT Policy emphasizes increasing the adoption of information technologies, aligning with the goals of the service virtualization sector.
- Regulatory frameworks introduced in 2024 are promoting transparency in billing processes, enhancing consumer confidence in digital services.
Future Insights of the Tanzania Service Virtualization Market
Looking ahead to 2026-2032, the Tanzania Service Virtualization Market is set to expand significantly. As businesses continue to embrace digital transformation, the demand for efficient software testing solutions will grow. The technology's capacity to simulate and test complex systems promises to reduce time-to-market and costs. As awareness of its benefits increases, particularly in enhancing software reliability and quality, more organizations will likely invest in service virtualization technologies.
Tanzania Service Virtualization Market Latest Developments
In the past year, activity within the Tanzania Service Virtualization Market has intensified, reflecting broader trends in digital transformation. Companies are increasingly prioritizing virtualization as a means to enhance their operational efficiencies and responsiveness in an ever-demanding marketplace. This shift is evident in various recent developments, signaling a strong trajectory for growth in this sector.
- In Q3 2025, a leading regional telecom operator launched a new cloud-based service virtualization platform, enhancing its testing capabilities and speeding up software delivery.
- By early 2026, an ongoing initiative is set to train professionals in service virtualization technologies, addressing the skills gap within the industry.
- A major technology vendor is expected to introduce a comprehensive suite of virtualization tools by mid-2026, aimed at the healthcare sector.
- In late 2025, a partnership between several firms was formed to develop a virtual classroom solution tailored for Tanzanian educational institutions.
- Looking forward, a rollout planned for 2027 focuses on integrating service virtualization into government services to improve public sector efficiency.
Tanzania Service Virtualization Market - Key Attractiveness of the Report
- 10 Years of Market Numbers
- Historical Data Starting from 2022 to 2025
- Base Year: 2025
- Forecast Data until 2032
- Key Performance Indicators Impacting the Market
- Major Upcoming Developments and Projects
Key Highlights of the Report:
- Tanzania Service Virtualization Market Outlook
- Market Size of Tanzania Service Virtualization Market, 2025
- Forecast of Tanzania Service Virtualization Market, 2032
- Historical Data and Forecast of Tanzania Service Virtualization Revenues & Volume for the Period 2022-2032F
- Tanzania Service Virtualization Market Trend Evolution
- Tanzania Service Virtualization Market Drivers and Challenges
- Tanzania Service Virtualization Price Trends
- Tanzania Service Virtualization Porter's Five Forces
- Tanzania Service Virtualization Industry Life Cycle
- Historical Data and Forecast of Tanzania Service Virtualization Market Revenues & Volume By Component for the Period 2022-2032F
- Historical Data and Forecast of Tanzania Service Virtualization Market Revenues & Volume By Software/Tools for the Period 2022-2032F
- Historical Data and Forecast of Tanzania Service Virtualization Market Revenues & Volume By Services for the Period 2022-2032F
- Historical Data and Forecast of Tanzania Service Virtualization Market Revenues & Volume By Deployment Type for the Period 2022-2032F
- Historical Data and Forecast of Tanzania Service Virtualization Market Revenues & Volume By On-Premises for the Period 2022-2032F
- Historical Data and Forecast of Tanzania Service Virtualization Market Revenues & Volume By Cloud for the Period 2022-2032F
- Historical Data and Forecast of Tanzania Service Virtualization Market Revenues & Volume By Verticals for the Period 2022-2032F
- Historical Data and Forecast of Tanzania Service Virtualization Market Revenues & Volume By IT Services for the Period 2022-2032F
- Historical Data and Forecast of Tanzania Service Virtualization Market Revenues & Volume By Telecommunication for the Period 2022-2032F
- Historical Data and Forecast of Tanzania Service Virtualization Market Revenues & Volume By BFSI for the Period 2022-2032F
- Historical Data and Forecast of Tanzania Service Virtualization Market Revenues & Volume By Retail and eCommerce for the Period 2022-2032F
- Historical Data and Forecast of Tanzania Service Virtualization Market Revenues & Volume By Media and Entertainment for the Period 2022-2032F
- Historical Data and Forecast of Tanzania Service Virtualization Market Revenues & Volume By Healthcare for the Period 2022-2032F
- Historical Data and Forecast of Tanzania Service Virtualization Market Revenues & Volume By Automotive for the Period 2022-2032F
- Historical Data and Forecast of Tanzania Service Virtualization Market Revenues & Volume By Others for the Period 2022-2032F
- Historical Data and Forecast of Tanzania Service Virtualization Market Revenues & Volume By s for the Period 2022-2032F
- Tanzania Service Virtualization Import Export Trade Statistics
- Market Opportunity Assessment By Component
- Market Opportunity Assessment By Deployment Type
- Market Opportunity Assessment By Verticals
- Market Opportunity Assessment By s
- Tanzania Service Virtualization Top Companies Market Share
- Tanzania Service Virtualization Competitive Benchmarking By Technical and Operational Parameters
- Tanzania Service Virtualization Company Profiles
- Tanzania Service Virtualization Key Strategic Recommendations






































