Tanzania Textile Waste Market (2026-2032) | Revenue, Trends, Growth, Outlook, Industry, Value, Share, Companies, Size, COVID-19 IMPACT, Forecast & Analysis
Market Forecast By Solution Types (Source Reduction Solutions, Landfills Solutions, Recycling Solutions, Incineration Solutions), By Product Types (Spinning waste, Weaving waste, Knitting waste, Dyeing waste, Clothing waste, Consumer waste) And Competitive Landscape
| Product Code: ETC007755 | Publication Date: Jun 2023 | Product Type: Report | ||
| Publisher: 6Wresearch | Author: Ravi Bhandari | No. of Pages: 70 | No. of Figures: 35 | No. of Tables: 5 |
Tanzania Textile Waste Market Summary
The tanzania textile waste market was estimated at USD 152 Million in 2025 and is projected to reach USD 207 Million by 2032, growing at a CAGR of 5.4% from 2026 to 2032.
Tanzania Textile Waste Market Growth Rate Analysis (2021-2032)
The Tanzania Textile Waste Market has sustained a stable growth rate, reflecting a broader awareness and responsiveness to environmental concerns. After a modest 5.1% increase in 2021, growth accelerated to 5.6% in 2022, driven largely by enhanced recycling technologies and supportive government policies aimed at waste reduction. The growth trend slightly intensified to 5.7% in 2023 before stabilizing around 5.6% in 2024 and oscillating between 5.2% and 5.5% through 2032. This demand is fueled by rising consumer awareness and a commitment to sustainable practices in the textile industry. The ongoing energy transition and investment in waste management infrastructure further bolster this market, although fluctuations in growth reflect shifts in regulatory environments and consumer behavior.
Tanzania Textile Waste Market Year-wise Growth Rate and Key Drivers
This graph highlights how the Tanzania Textile Waste Market has steadily grown over the past five years, supported by major growth factors.
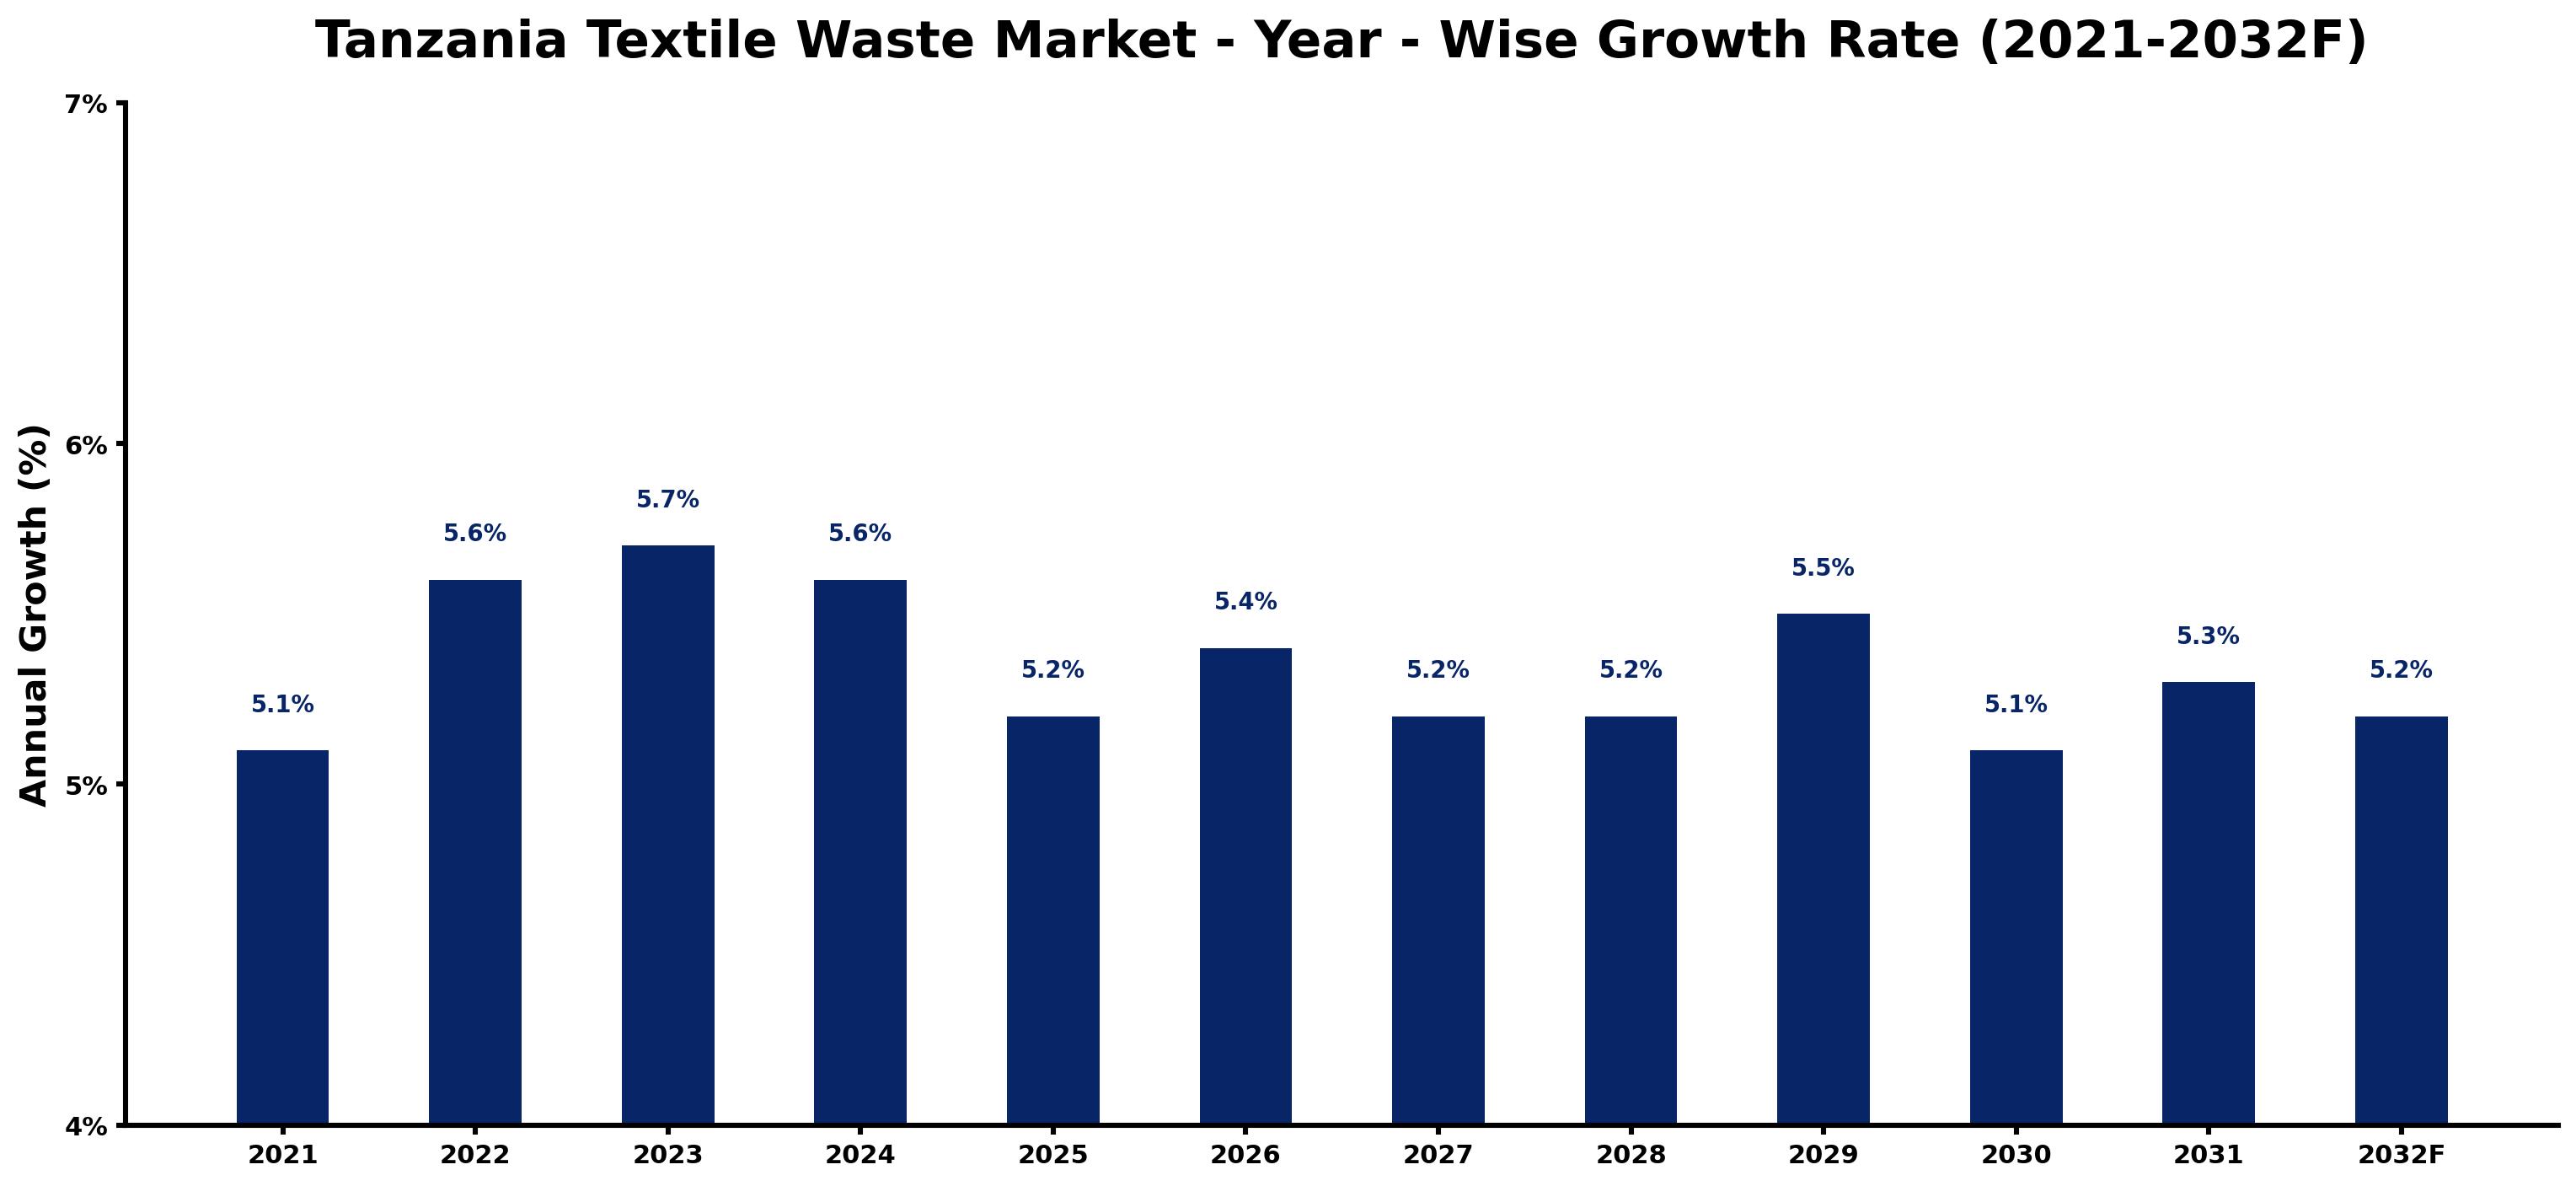
The table below presents the year wise growth rates along with the key drivers influencing the market
| Year | Growth Rate | Major Drivers |
| 2021 | 5.1% | Textile waste management solutions gained traction amid environmental awareness campaigns across Tanzania. |
| 2022 | 5.6% | Local entrepreneurs began exploring innovative recycling techniques for unused textile materials. |
| 2023 | 5.7% | Consumer brands launched initiatives to minimize waste, promoting sustainability in fashion choices. |
| 2024 | 5.6% | Increased educational programs highlighted the economic potential of textile recycling businesses. |
| 2025 | 5.2% | Local designers discovered ways to repurpose textile waste into unique fashion items. |
| 2026 | 5.4% | Collaboration between NGOs and communities fostered grassroots efforts in textile waste reduction. |
| 2027 | 5.2% | International partnerships introduced advanced recycling technologies to enhance local textile waste processes. |
| 2028 | 5.2% | Public awareness campaigns encouraged businesses to adopt sustainable practices in textile production. |
| 2029 | 5.5% | The rise of eco-conscious consumers shifted market dynamics toward sustainable textile options. |
| 2030 | 5.1% | Investment in infrastructure supported efficient collection and processing of textile waste materials. |
| 2031 | 5.3% | Government policies began incentivizing recycling initiatives through financial support and grants. |
| 2032 | 5.2% | Emerging startups focused on circular economy models, transforming the landscape of textile waste. |
Note - Market size estimations and growth projections presented in this report are based on 6Wresearch's advanced forecasting approach, validated with industry datasets as of June 2026.
Tanzania Textile Waste Market Synopsis
The Tanzania Textile Waste Market is projected to reach $20.5 million by 2026 and witness significant growth during the forecast period (2026-2032). This anticipated increase, from an estimated value of $15.5 million in 2020, reflects a compound annual growth rate (CAGR) of 5.4%. The growth trajectory of the Tanzania textile waste market is largely driven by rising awareness surrounding environmental sustainability and an escalating demand for cost-effective raw materials across the nation's clothing and apparel industry.
Tanzania Textile Waste Market Growth Drivers
Several factors contribute to the expansion of the Tanzania textile waste market. Firstly, there is a marked shift among manufacturers toward the incorporation of recycled textiles, which is increasingly recognized as a sustainable alternative to conventional raw materials. This trend is underscored by heightened consumer consciousness regarding eco-friendly practices.
- Government-led initiatives, such as "Ecofriendly Fashion Week," are instrumental in promoting sustainable fashion practices, thus stimulating market growth.
- The commitment from the Tanzanian government to enhance waste management systems has led to reduced contamination from textiles and plastics.
- Investments in public health infrastructure have fostered awareness about responsible disposal methods, further mitigating environmental contamination.
- A growing trend towards sustainable textiles is evident across various sectors, including apparel, automotive, and furniture manufacturing.
- Companies are increasingly adopting green processes as part of their corporate social responsibility policies, creating an investment-friendly climate.
Tanzania Textile Waste Market Government Investment and Initiatives
The Tanzanian government has implemented several initiatives aimed at bolstering the textile waste market. Focused on improving environmental standards, policies have been introduced to encourage the recycling of textiles and the utilization of eco-friendly products. Investments in waste management infrastructure are being prioritized to handle textile waste effectively.
- Government funding has been allocated to support technological advancements in recycling and waste processing facilities.
- Public awareness campaigns are increasingly emphasizing the importance of sustainable waste disposal methods, particularly in urban areas.
- Regulatory frameworks are being established to drive compliance among manufacturers toward sustainable practices.
- Incentives such as tax breaks for companies engaging in recycling initiatives are also on the rise, encouraging investment in the sector.
- Partnerships with international organizations are fostering knowledge transfer on best practices for waste management and textile recycling.
Tanzania Textile Waste Market Latest Developments (May 2025 - June 2026)
In the period from May 2025 to June 2026, the Tanzania textile waste market has witnessed significant developments that are shaping its future. Increased collaboration among stakeholders, including government entities and industrial players, has resulted in the establishment of frameworks aimed at enhancing textile waste management.
- A surge in community-based recycling initiatives has emerged, focusing on sorting and processing textile waste at the local level.
- Technological innovations in recycling processes have been introduced, improving the efficiency and cost-effectiveness of textile waste handling.
- Awareness campaigns have gained momentum, with educational programs directed towards businesses on the benefits of adopting sustainable practices.
- Research funding for environmentally friendly textile processing methods has shown a notable increase, aimed at developing local capacities.
- Networking events and conferences focusing on sustainable fashion practices have become more prevalent, fostering collaboration among different sectors.
Tanzania Textile Waste Market - Key Attractiveness of the Report
- 10 Years of Market Numbers
- Historical Data Starting from 2022 to 2025
- Base Year: 2025
- Forecast Data until 2032
- Key Performance Indicators Impacting the Market
- Major Upcoming Developments and Projects
Key Highlights of the Report:
- Tanzania Textile Waste Market Outlook
- Market Size of Tanzania Textile Waste Market, 2025
- Forecast of Tanzania Textile Waste Market, 2032F
- Historical Data and Forecast of Tanzania Textile Waste Revenues & Volume for the Period 2022-2032F
- Tanzania Textile Waste Market Trend Evolution
- Tanzania Textile Waste Market Drivers and Challenges
- Tanzania Textile Waste Price Trends
- Tanzania Textile Waste Porter's Five Forces
- Tanzania Textile Waste Industry Life Cycle
- Historical Data and Forecast of Tanzania Textile Waste Market Revenues & Volume By Solution Types for the Period 2022-2032F
- Historical Data and Forecast of Tanzania Textile Waste Market Revenues & Volume By Source Reduction Solutions for the Period 2022-2032F
- Historical Data and Forecast of Tanzania Textile Waste Market Revenues & Volume By Landfills Solutions for the Period 2022-2032F
- Historical Data and Forecast of Tanzania Textile Waste Market Revenues & Volume By Recycling Solutions for the Period 2022-2032F
- Historical Data and Forecast of Tanzania Textile Waste Market Revenues & Volume By Incineration Solutions for the Period 2022-2032F
- Historical Data and Forecast of Tanzania Textile Waste Market Revenues & Volume By Product Types for the Period 2022-2032F
- Historical Data and Forecast of Tanzania Textile Waste Market Revenues & Volume By Spinning waste for the Period 2022-2032F
- Historical Data and Forecast of Tanzania Textile Waste Market Revenues & Volume By Weaving waste for the Period 2022-2032F
- Historical Data and Forecast of Tanzania Textile Waste Market Revenues & Volume By Knitting waste for the Period 2022-2032F
- Historical Data and Forecast of Tanzania Textile Waste Market Revenues & Volume By Dyeing waste for the Period 2022-2032F
- Historical Data and Forecast of Tanzania Textile Waste Market Revenues & Volume By Clothing waste for the Period 2022-2032F
- Historical Data and Forecast of Tanzania Textile Waste Market Revenues & Volume By Consumer waste for the Period 2022-2032F
- Tanzania Textile Waste Import Export Trade Statistics
- Market Opportunity Assessment By Solution Types
- Market Opportunity Assessment By Product Types
- Tanzania Textile Waste Top Companies Market Share
- Tanzania Textile Waste Competitive Benchmarking By Technical and Operational Parameters
- Tanzania Textile Waste Company Profiles
- Tanzania Textile Waste Key Strategic Recommendations
Frequently Asked Questions About the Market Study (FAQs):
The Tanzania Textile Waste Market is projected to reach $20.5 million by 2026.
Key drivers include increased awareness of environmental sustainability, government initiatives for sustainable practices, and rising demand for recycled textiles.
The government is investing in waste management infrastructure, promoting recycling, providing incentives for eco-friendly practices, and launching public awareness campaigns.
Recent trends include community-based recycling initiatives, technological advancements in recycling processes, and increased collaboration among stakeholders to promote sustainable practices.
6Wresearch actively monitors the Tanzania Textile Waste Market and publishes its comprehensive annual report, highlighting emerging trends, growth drivers, revenue analysis, and forecast outlook. Our insights help businesses to make data-backed strategic decisions with ongoing market dynamics. Our analysts track relevent industries related to the Tanzania Textile Waste Market, allowing our clients with actionable intelligence and reliable forecasts tailored to emerging regional needs.
Yes, we provide customisation as per your requirements. To learn more, feel free to contact us on sales@6wresearch.com
1 Executive Summary |
2 Introduction |
2.1 Key Highlights of the Report |
2.2 Report Description |
2.3 Market Scope & Segmentation |
2.4 Research Methodology |
2.5 Assumptions |
3 Tanzania Textile Waste Market Overview |
3.1 Tanzania Country Macro Economic Indicators |
3.2 Tanzania Textile Waste Market Revenues & Volume, 2022 & 2032F |
3.3 Tanzania Textile Waste Market - Industry Life Cycle |
3.4 Tanzania Textile Waste Market - Porter's Five Forces |
3.5 Tanzania Textile Waste Market Revenues & Volume Share, By Solution Types, 2022 & 2032F |
3.6 Tanzania Textile Waste Market Revenues & Volume Share, By Product Types, 2022 & 2032F |
4 Tanzania Textile Waste Market Dynamics |
4.1 Impact Analysis |
4.2 Market Drivers |
4.3 Market Restraints |
5 Tanzania Textile Waste Market Trends |
6 Tanzania Textile Waste Market, By Types |
6.1 Tanzania Textile Waste Market, By Solution Types |
6.1.1 Overview and Analysis |
6.1.2 Tanzania Textile Waste Market Revenues & Volume, By Solution Types, 2022-2032F |
6.1.3 Tanzania Textile Waste Market Revenues & Volume, By Source Reduction Solutions, 2022-2032F |
6.1.4 Tanzania Textile Waste Market Revenues & Volume, By Landfills Solutions, 2022-2032F |
6.1.5 Tanzania Textile Waste Market Revenues & Volume, By Recycling Solutions, 2022-2032F |
6.1.6 Tanzania Textile Waste Market Revenues & Volume, By Incineration Solutions, 2022-2032F |
6.2 Tanzania Textile Waste Market, By Product Types |
6.2.1 Overview and Analysis |
6.2.2 Tanzania Textile Waste Market Revenues & Volume, By Spinning waste, 2022-2032F |
6.2.3 Tanzania Textile Waste Market Revenues & Volume, By Weaving waste, 2022-2032F |
6.2.4 Tanzania Textile Waste Market Revenues & Volume, By Knitting waste, 2022-2032F |
6.2.5 Tanzania Textile Waste Market Revenues & Volume, By Dyeing waste, 2022-2032F |
6.2.6 Tanzania Textile Waste Market Revenues & Volume, By Clothing waste, 2022-2032F |
6.2.7 Tanzania Textile Waste Market Revenues & Volume, By Consumer waste, 2022-2032F |
7 Tanzania Textile Waste Market Import-Export Trade Statistics |
7.1 Tanzania Textile Waste Market Export to Major Countries |
7.2 Tanzania Textile Waste Market Imports from Major Countries |
8 Tanzania Textile Waste Market Key Performance Indicators |
9 Tanzania Textile Waste Market - Opportunity Assessment |
9.1 Tanzania Textile Waste Market Opportunity Assessment, By Solution Types, 2022 & 2032F |
9.2 Tanzania Textile Waste Market Opportunity Assessment, By Product Types, 2022 & 2032F |
10 Tanzania Textile Waste Market - Competitive Landscape |
10.1 Tanzania Textile Waste Market Revenue Share, By Companies, 2025 |
10.2 Tanzania Textile Waste Market Competitive Benchmarking, By Operating and Technical Parameters |
11 Company Profiles |
12 Recommendations |
13 Disclaimer |
Global Go To Market Strategy - 2030
Export potential enables firms to identify high-growth global markets with greater confidence by combining advanced trade intelligence with a structured quantitative methodology. The framework analyzes emerging demand trends and country-level import patterns while integrating macroeconomic and trade datasets such as GDP and population forecasts, bilateral import–export flows, tariff structures, elasticity differentials between developed and developing economies, geographic distance, and import demand projections. Using weighted trade values from 2020–2024 as the base period to project country-to-country export potential for 2030, these inputs are operationalized through calculated drivers such as gravity model parameters, tariff impact factors, and projected GDP per-capita growth. Through an analysis of hidden potentials, demand hotspots, and market conditions that are most favorable to success, this method enables firms to focus on target countries, maximize returns, and global expansion with data, backed by accuracy.
By factoring in the projected importer demand gap that is currently unmet and could be potential opportunity, it identifies the potential for the Exporter (Country) among 190 countries, against the general trade analysis, which identifies the biggest importer or exporter.
To discover high-growth global markets and optimize your business strategy:
Click Here
Pricing
- Single User License$ 1,995
- Department License$ 2,400
- Site License$ 3,120
- Global License$ 3,795

Leadership Perspectives from Industry Events
Search
Thought Leadership and Analyst Meet


Our Clients
6WResearch In News
- India Air Conditioner Market Set for Strong Rebound in 2026 After Weather-Led Correction and GST-Driven Recovery: 6Wresearch
- ADAS in India: How Automatic Emergency Braking, Blind Spot Detection & Driver Monitoring are Transforming Road Safety
- Doha a strategic location for EV manufacturing hub: IPA Qatar
- Demand for luxury TVs surging in the GCC, says Samsung
- Empowering Growth: The Thriving Journey of Bangladesh’s Cable Industry
- Demand for luxury TVs surging in the GCC, says Samsung
Latest Reports
- Nicaragua RPG Gaming Market (2026-2032)
- New Zealand RPG Gaming Market (2026-2032)
- Netherlands RPG Gaming Market (2026-2032)
- Nauru RPG Gaming Market (2026-2032)
- Namibia RPG Gaming Market (2026-2032)
- Mozambique RPG Gaming Market (2026-2032)
- Montenegro RPG Gaming Market (2026-2032)
- Mongolia RPG Gaming Market (2026-2032)
- Monaco RPG Gaming Market (2026-2032)
- Micronesia RPG Gaming Market (2026-2032)
Industry Events and Analyst Meet

HIMTEX 2026

India Refining Summit 2026

India EV Show 2026

EV tech India Expo 2026

Auto Tech Asia 2026
Whitepaper
- Middle East & Africa Commercial Security Market Click here to view more.
- Middle East & Africa Fire Safety Systems & Equipment Market Click here to view more.
- GCC Drone Market Click here to view more.
- Middle East Lighting Fixture Market Click here to view more.
- GCC Physical & Perimeter Security Market Click here to view more.