Tanzania Vanilla Beans Market (2026-2032) | Outlook, Share, Companies, Forecast, Value, Size, Growth, Trends, Revenue, COVID-19 IMPACT, Analysis & Industry
Market Forecast By Product Type (Organic, Conventional), By Grade (Grade A, Grade B), By Origin (Natural, Synthetic), By Form (Paste, Liquid, Powder), By Application (Food and Beverages Industry, Cosmetics Industry, Pharmaceuticals Industry) And Competitive Landscape
| Product Code: ETC015375 | Publication Date: Jun 2023 | Product Type: Report | ||
| Publisher: 6Wresearch | Author: Ravi Bhandari | No. of Pages: 70 | No. of Figures: 35 | No. of Tables: 5 |
Tanzania Vanilla Beans Market Summary
The tanzania vanilla beans market was estimated at USD 391 Million in 2025 and is projected to reach USD 519 Million by 2032, growing at a CAGR of 4.8% from 2026 to 2032.
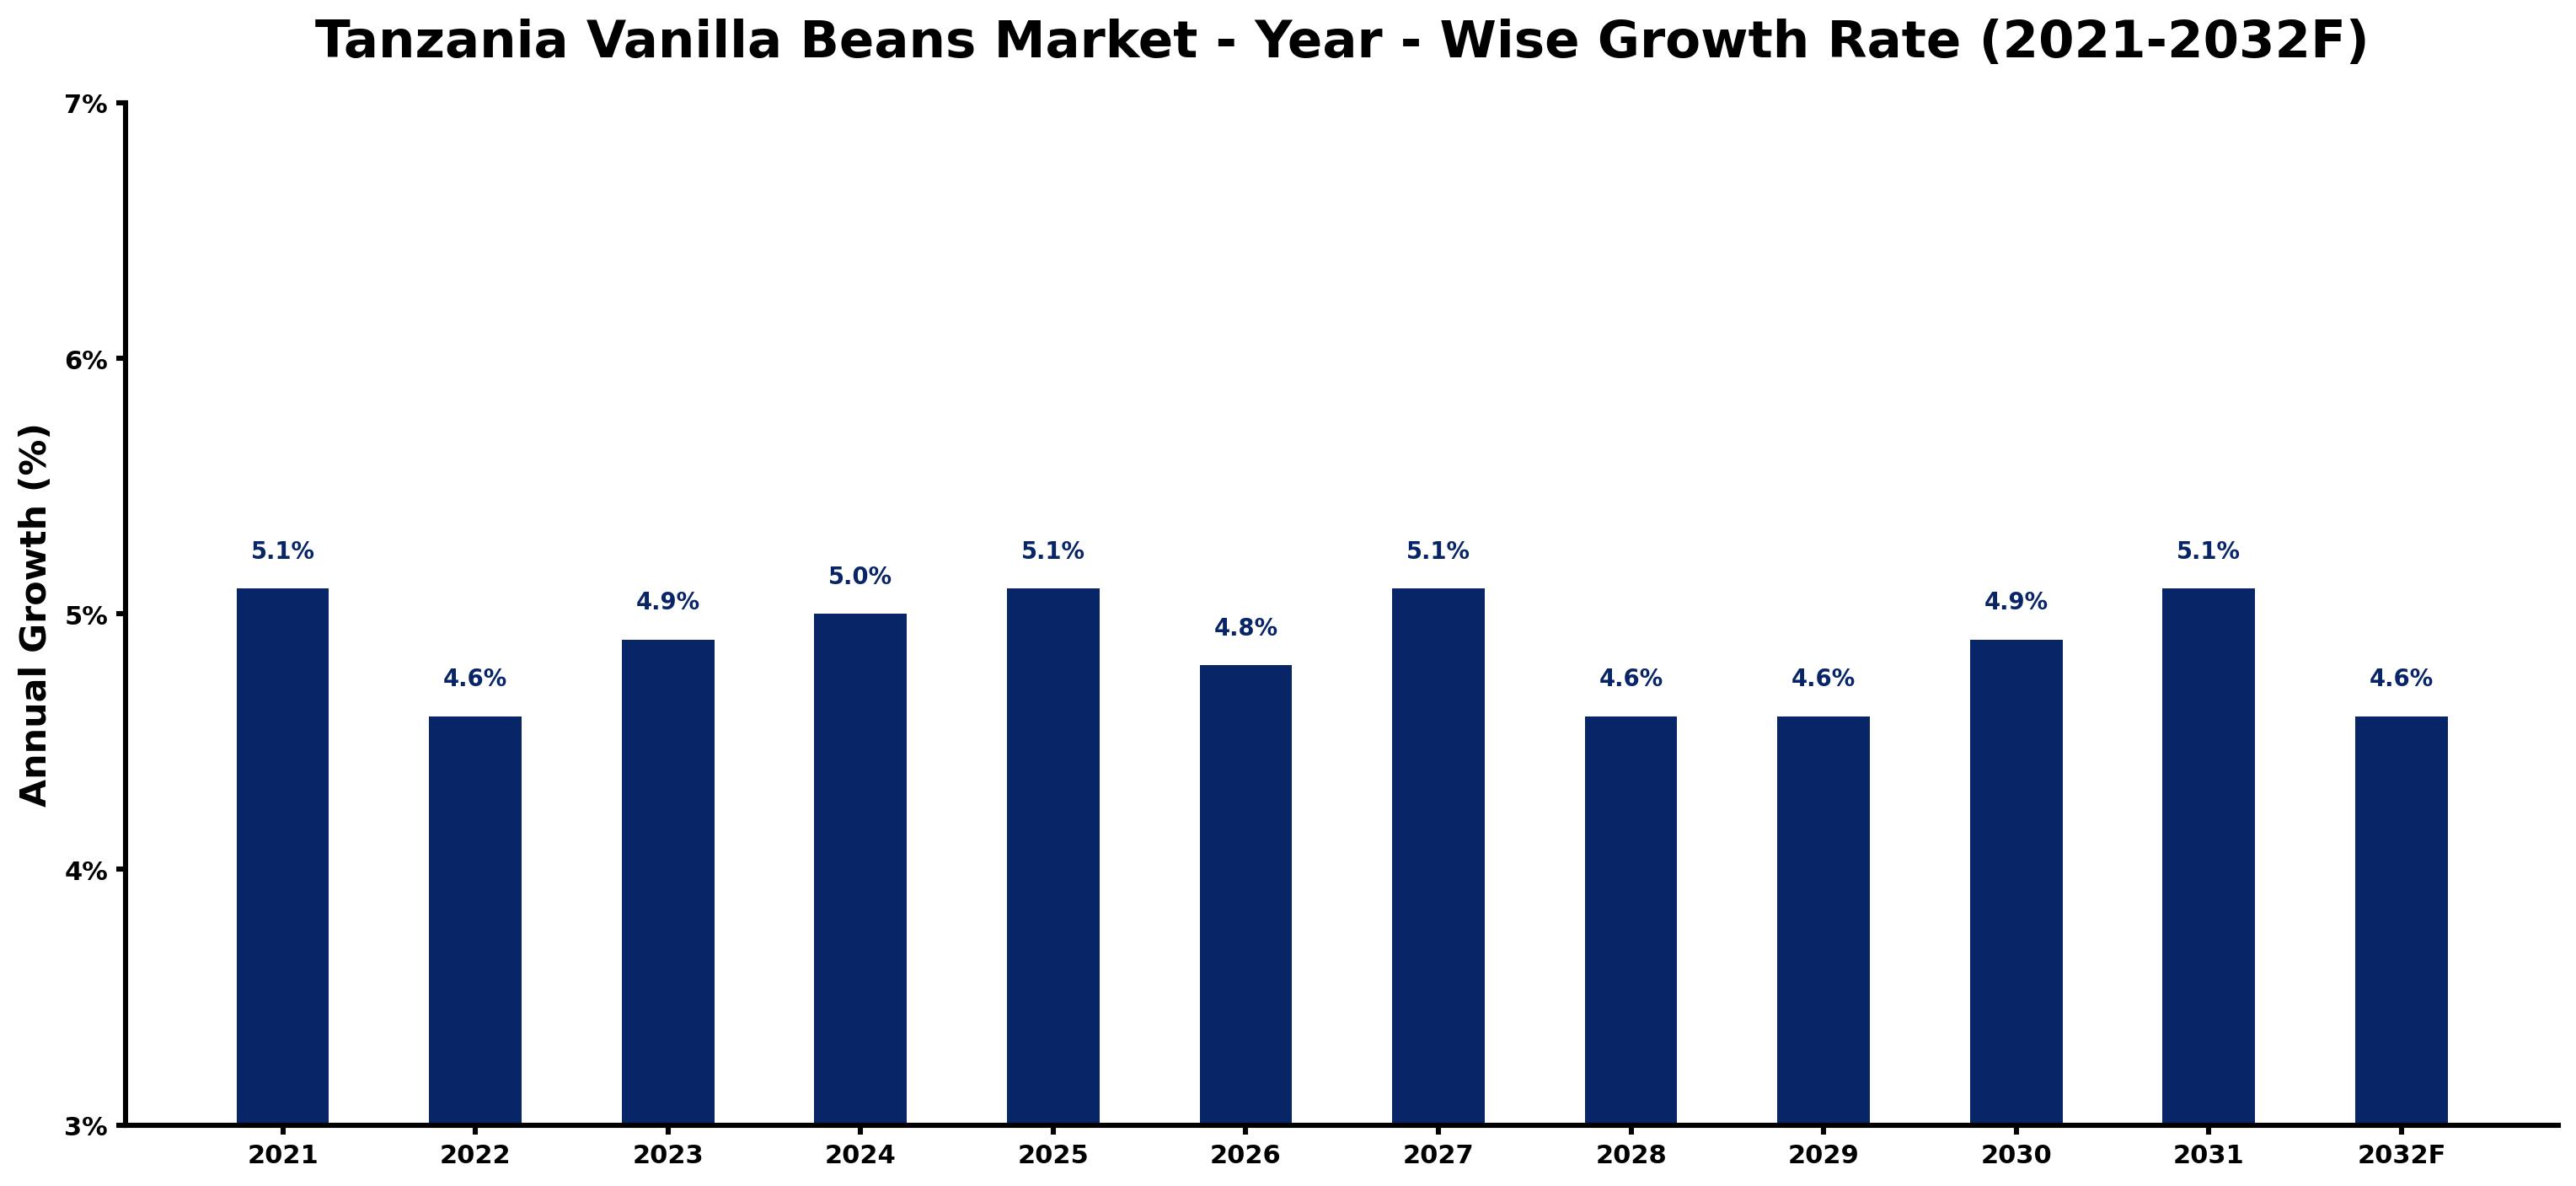
Tanzania Vanilla Beans Market Growth Rate Analysis (2021-2032)
The Tanzania vanilla beans market has exhibited a stable growth pattern, marked by a 5.1% increase in 2021, followed by 4.6% in 2022. A resurgence to 4.9% in 2023 reflects rising consumer demand for quality vanilla in both domestic and international markets. This trend is supported by investments in sustainable agricultural practices and improved farming techniques. Projections indicate continued growth, with rates of 5.1% anticipated in 2025 and again in 2031, though slight fluctuations, such as 4.6% in 2028 and 2029, suggest minor market adjustments due to varying global supply chain dynamics. Overall, ongoing developments in technology and infrastructure are bolstering market resilience and expanding consumer access.
Tanzania Vanilla Beans Market Year-wise Growth Rate and Key Drivers
This graph highlights how the Tanzania Vanilla Beans Market has steadily grown over the past five years, supported by major growth factors.
The table below presents the year wise growth rates along with the key drivers influencing the market
| Year | Growth Rate | Major Drivers |
| 2021 | 5.1% | Matured supply chains began favoring Tanzania's vanilla beans for quality-focused clients. |
| 2022 | 4.6% | Increased global interest in natural flavors highlighted Tanzania's unique vanilla varieties. |
| 2023 | 4.9% | Local farmers adapted traditional methods for organic certification, elevating market appeal significantly. |
| 2024 | 5.0% | Export opportunities expanded as international culinary trends embraced Tanzanian vanilla products. |
| 2025 | 5.1% | Emergence of artisanal products encouraged small producers to enter the vanilla market. |
| 2026 | 4.8% | Partnerships between farmers and exporters improved logistical frameworks for vanilla distribution. |
| 2027 | 5.1% | Tourism growth in Tanzania included culinary experiences featuring locally sourced vanilla beans. |
| 2028 | 4.6% | Innovative marketing strategies showcased Tanzania's vanilla in global food festivals and expos. |
| 2029 | 4.6% | Technological advancements improved agricultural practices, enhancing vanilla yield and quality. |
| 2030 | 4.9% | Sustainable farming practices gained traction among producers, appealing to environmentally-conscious buyers. |
| 2031 | 5.1% | Demand for high-quality organic ingredients soared, confirming Tanzania's market position solidly. |
| 2032 | 4.6% | Collaboration with research institutions fostered developments in vanilla cultivation techniques and resilience. |
Note - Market size estimations and growth projections presented in this report are based on 6Wresearch's advanced forecasting approach, validated with industry datasets as of June 2026.
Tanzania Vanilla Beans Market Synopsis
The Tanzania Vanilla Beans Market is projected to reach 4.8% and witness significant growth during the forecast period (2026-2032). This projected growth is primarily driven by a surge in demand for organic and naturally produced products, coupled with a notable increase in the use of natural flavors in food processing. Rising health consciousness among consumers further fuels this expansion, as many individuals gravitate towards healthier, flavor-rich options.
Tanzania Vanilla Beans Market Growth Drivers
Several key factors are contributing to the growth of the Tanzania vanilla beans market. Firstly, the global trend towards natural ingredient sourcing is reshaping consumer preferences, prompting manufacturers to adopt vanilla beans as a more desirable alternative to synthetic flavors. Secondly, the burgeoning market for non-alcoholic beverages, including mocktails and smoothies, is driving the demand for premium vanilla beans, known for their unique flavor profiles.
- There is a growing inclination among consumers towards organic products, which is reflected in the increasing sales of natural flavors, including vanilla.
- The food processing industry is experiencing a shift towards clean labeling, where consumers prefer products with transparent and natural ingredient lists.
- Health-conscious trends are leading to a rise in the demand for low-sugar and natural flavoring options, thus enhancing the relevance of vanilla beans.
- Ethical sourcing of vanilla beans is appealing to environmentally and socially aware consumers, further boosting demand.
- Tanzania's favorable climate conditions are conducive to producing high-quality vanilla beans, supporting the market's potential growth.
Tanzania Vanilla Beans Market Trends and Opportunities
The Tanzania vanilla beans market is experiencing various trends that are expected to shape its future landscape. A significant trend is the emphasis on sustainability, with producers increasingly adopting eco-friendly farming practices to meet consumer demand for ethically sourced products. Furthermore, the innovation in product formulations within the food and beverage sector presents ample opportunities for vanilla bean applications.
- There is a noticeable rise in the popularity of plant-based and natural food products, which enhances the scope of vanilla beans in diverse culinary applications.
- Emerging markets are showing an increased interest in artisanal and craft food products, which often feature vanilla as a key ingredient.
- Collaborative efforts between local farmers and international distributors are opening new channels for vanilla bean export, thereby enhancing market reach.
- Investment in research and development is paving the way for innovative vanilla-derived products, broadening their application range.
- Rising urbanization and evolving lifestyles are influencing consumer preferences, with more people seeking convenient yet high-quality food options featuring natural flavors.
Tanzania Vanilla Beans Market Challenges and Restraints
Despite the promising aspects of the Tanzania vanilla beans market, several challenges may hinder growth. A key concern is the volatility in vanilla bean prices, which can fluctuate due to various factors including supply chain disruptions and climatic changes. Additionally, the presence of counterfeit vanilla products in the market poses a significant threat to genuine vanilla producers.
- Unpredictable weather patterns and climate change can adversely affect crop yields, leading to supply shortages.
- High labor costs associated with the cultivation and harvesting of vanilla beans can impact profitability for local farmers.
- Challenges in maintaining quality standards during the processing of vanilla beans may affect market perception and demand.
- Competition from synthetic vanilla flavor alternatives may deter some consumers from choosing natural options.
- A lack of adequate infrastructure and funding for farmers can impede their ability to scale production effectively.
Tanzania Vanilla Beans Market Government Investment and Initiatives
The Tanzanian government recognizes the significance of the vanilla beans market and has been proactive in implementing initiatives aimed at promoting its growth. Investments in agricultural development programs focus on enhancing the productivity and quality of vanilla beans through improved farming practices and technology transfer.
- Government policies are increasingly supportive of sustainable agriculture, encouraging farmers to adopt practices that enhance yield while preserving the environment.
- Initiatives aimed at providing training and resources for farmers contribute to increased knowledge on best cultivation practices.
- The government is facilitating access to financial support for smallholder farmers, helping them invest in better farming equipment and inputs.
- Public-private partnerships are being fostered to improve infrastructure, thereby enhancing supply chain efficiency within the vanilla sector.
- Efforts to promote Tanzanian vanilla on international platforms are leading to increased recognition and demand for the country's high-quality vanilla beans.
Tanzania Vanilla Beans Market Latest Developments (May 2025 - June 2026)
Recent developments within the Tanzania vanilla beans market indicate a dynamic shift towards sustainability and quality enhancement. During this period, there has been an increase in collaborations between local farmers and research institutions, focusing on developing resilient vanilla varieties that can withstand climatic challenges. Furthermore, marketing campaigns promoting Tanzanian vanilla on international platforms have gained traction, thereby boosting global visibility.
- Local producers have started adopting certification processes to enhance the credibility and marketability of their vanilla beans.
- The emergence of organic certification initiatives has encouraged farmers to align their practices with global standards.
- Innovative processing techniques are being employed to enhance flavor extraction and quality retention during vanilla bean preparation.
- Collaborative efforts to address the challenges of counterfeit products are leading to increased consumer trust in genuine Tanzanian vanilla.
- Research directed at improving post-harvest handling techniques is focused on maintaining the quality of vanilla beans from farm to market.
Tanzania Vanilla Beans Market - Key Attractiveness of the Report
- 10 Years of Market Numbers
- Historical Data Starting from 2022 to 2025
- Base Year: 2025
- Forecast Data until 2032
- Key Performance Indicators Impacting the Market
- Major Upcoming Developments and Projects
Key Highlights of the Report:
- Tanzania Vanilla Beans Market Outlook
- Market Size of Tanzania Vanilla Beans Market, 2025
- Forecast of Tanzania Vanilla Beans Market, 2032F
- Historical Data and Forecast of Tanzania Vanilla Beans Revenues & Volume for the Period 2022-2032F
- Tanzania Vanilla Beans Market Trend Evolution
- Tanzania Vanilla Beans Market Drivers and Challenges
- Tanzania Vanilla Beans Price Trends
- Tanzania Vanilla Beans Porter's Five Forces
- Tanzania Vanilla Beans Industry Life Cycle
- Historical Data and Forecast of Tanzania Vanilla Beans Market Revenues & Volume By Product Type for the Period 2022-2032F
- Historical Data and Forecast of Tanzania Vanilla Beans Market Revenues & Volume By Organic for the Period 2022-2032F
- Historical Data and Forecast of Tanzania Vanilla Beans Market Revenues & Volume By Conventional for the Period 2022-2032F
- Historical Data and Forecast of Tanzania Vanilla Beans Market Revenues & Volume By Grade for the Period 2022-2032F
- Historical Data and Forecast of Tanzania Vanilla Beans Market Revenues & Volume By Grade A for the Period 2022-2032F
- Historical Data and Forecast of Tanzania Vanilla Beans Market Revenues & Volume By Grade B for the Period 2022-2032F
- Historical Data and Forecast of Tanzania Vanilla Beans Market Revenues & Volume By Origin for the Period 2022-2032F
- Historical Data and Forecast of Tanzania Vanilla Beans Market Revenues & Volume By Natural for the Period 2022-2032F
- Historical Data and Forecast of Tanzania Vanilla Beans Market Revenues & Volume By Synthetic for the Period 2022-2032F
- Historical Data and Forecast of Tanzania Vanilla Beans Market Revenues & Volume By Form for the Period 2022-2032F
- Historical Data and Forecast of Tanzania Vanilla Beans Market Revenues & Volume By Paste for the Period 2022-2032F
- Historical Data and Forecast of Tanzania Vanilla Beans Market Revenues & Volume By Liquid for the Period 2022-2032F
- Historical Data and Forecast of Tanzania Vanilla Beans Market Revenues & Volume By Powder for the Period 2022-2032F
- Historical Data and Forecast of Tanzania Vanilla Beans Market Revenues & Volume By Application for the Period 2022-2032F
- Historical Data and Forecast of Tanzania Vanilla Beans Market Revenues & Volume By Food and Beverages Industry for the Period 2022-2032F
- Historical Data and Forecast of Tanzania Vanilla Beans Market Revenues & Volume By Cosmetics Industry for the Period 2022-2032F
- Historical Data and Forecast of Tanzania Vanilla Beans Market Revenues & Volume By Pharmaceuticals Industry for the Period 2022-2032F
- Historical Data and Forecast of Tanzania Vanilla Beans Market Revenues & Volume By Distribution Channel for the Period 2022-2032F
- Historical Data and Forecast of Tanzania Vanilla Beans Market Revenues & Volume By Retailers for the Period 2022-2032F
- Historical Data and Forecast of Tanzania Vanilla Beans Market Revenues & Volume By Supermarket for the Period 2022-2032F
- Historical Data and Forecast of Tanzania Vanilla Beans Market Revenues & Volume By Hypermarket for the Period 2022-2032F
- Historical Data and Forecast of Tanzania Vanilla Beans Market Revenues & Volume By E-commerce for the Period 2022-2032F
- Tanzania Vanilla Beans Import Export Trade Statistics
- Market Opportunity Assessment By Product Type
- Market Opportunity Assessment By Grade
- Market Opportunity Assessment By Origin
- Market Opportunity Assessment By Form
- Market Opportunity Assessment By Application
- Market Opportunity Assessment By Distribution Channel
- Tanzania Vanilla Beans Top Companies Market Share
- Tanzania Vanilla Beans Competitive Benchmarking By Technical and Operational Parameters
- Tanzania Vanilla Beans Company Profiles
- Tanzania Vanilla Beans Key Strategic Recommendations
Frequently Asked Questions About the Market Study (FAQs):
The growth is primarily driven by increasing demand for organic products, the popularity of natural flavors in food processing, and rising health consciousness among consumers.
The government is investing in agricultural programs, providing training for farmers, and facilitating access to financial resources to enhance production capabilities.
The market faces challenges such as price volatility, climate change impacts on crop yields, and competition from synthetic alternatives.
Recent trends include a focus on sustainability, the adoption of organic practices, and collaborations to enhance product visibility on international platforms.
6Wresearch actively monitors the Tanzania Vanilla Beans Market and publishes its comprehensive annual report, highlighting emerging trends, growth drivers, revenue analysis, and forecast outlook. Our insights help businesses to make data-backed strategic decisions with ongoing market dynamics. Our analysts track relevent industries related to the Tanzania Vanilla Beans Market, allowing our clients with actionable intelligence and reliable forecasts tailored to emerging regional needs.
Yes, we provide customisation as per your requirements. To learn more, feel free to contact us on sales@6wresearch.com
1 Executive Summary |
2 Introduction |
2.1 Key Highlights of the Report |
2.2 Report Description |
2.3 Market Scope & Segmentation |
2.4 Research Methodology |
2.5 Assumptions |
3 Tanzania Vanilla Beans Market Overview |
3.1 Tanzania Country Macro Economic Indicators |
3.2 Tanzania Vanilla Beans Market Revenues & Volume, 2022 & 2032F |
3.3 Tanzania Vanilla Beans Market - Industry Life Cycle |
3.4 Tanzania Vanilla Beans Market - Porter's Five Forces |
3.5 Tanzania Vanilla Beans Market Revenues & Volume Share, By Product Type, 2022 & 2032F |
3.6 Tanzania Vanilla Beans Market Revenues & Volume Share, By Grade, 2022 & 2032F |
3.7 Tanzania Vanilla Beans Market Revenues & Volume Share, By Origin, 2022 & 2032F |
3.8 Tanzania Vanilla Beans Market Revenues & Volume Share, By Form, 2022 & 2032F |
3.9 Tanzania Vanilla Beans Market Revenues & Volume Share, By Application, 2022 & 2032F |
3.10 Tanzania Vanilla Beans Market Revenues & Volume Share, By Distribution Channel, 2022 & 2032F |
4 Tanzania Vanilla Beans Market Dynamics |
4.1 Impact Analysis |
4.2 Market Drivers |
4.3 Market Restraints |
5 Tanzania Vanilla Beans Market Trends |
6 Tanzania Vanilla Beans Market, By Types |
6.1 Tanzania Vanilla Beans Market, By Product Type |
6.1.1 Overview and Analysis |
6.1.2 Tanzania Vanilla Beans Market Revenues & Volume, By Product Type, 2022-2032F |
6.1.3 Tanzania Vanilla Beans Market Revenues & Volume, By Organic, 2022-2032F |
6.1.4 Tanzania Vanilla Beans Market Revenues & Volume, By Conventional, 2022-2032F |
6.2 Tanzania Vanilla Beans Market, By Grade |
6.2.1 Overview and Analysis |
6.2.2 Tanzania Vanilla Beans Market Revenues & Volume, By Grade A, 2022-2032F |
6.2.3 Tanzania Vanilla Beans Market Revenues & Volume, By Grade B, 2022-2032F |
6.3 Tanzania Vanilla Beans Market, By Origin |
6.3.1 Overview and Analysis |
6.3.2 Tanzania Vanilla Beans Market Revenues & Volume, By Natural, 2022-2032F |
6.3.3 Tanzania Vanilla Beans Market Revenues & Volume, By Synthetic, 2022-2032F |
6.4 Tanzania Vanilla Beans Market, By Form |
6.4.1 Overview and Analysis |
6.4.2 Tanzania Vanilla Beans Market Revenues & Volume, By Paste, 2022-2032F |
6.4.3 Tanzania Vanilla Beans Market Revenues & Volume, By Liquid, 2022-2032F |
6.4.4 Tanzania Vanilla Beans Market Revenues & Volume, By Powder, 2022-2032F |
6.5 Tanzania Vanilla Beans Market, By Application |
6.5.1 Overview and Analysis |
6.5.2 Tanzania Vanilla Beans Market Revenues & Volume, By Food and Beverages Industry, 2022-2032F |
6.5.3 Tanzania Vanilla Beans Market Revenues & Volume, By Cosmetics Industry, 2022-2032F |
6.5.4 Tanzania Vanilla Beans Market Revenues & Volume, By Pharmaceuticals Industry, 2022-2032F |
6.6 Tanzania Vanilla Beans Market, By Distribution Channel |
6.6.1 Overview and Analysis |
6.6.2 Tanzania Vanilla Beans Market Revenues & Volume, By Retailers, 2022-2032F |
6.6.3 Tanzania Vanilla Beans Market Revenues & Volume, By Supermarket, 2022-2032F |
6.6.4 Tanzania Vanilla Beans Market Revenues & Volume, By Hypermarket, 2022-2032F |
6.6.5 Tanzania Vanilla Beans Market Revenues & Volume, By E-commerce, 2022-2032F |
7 Tanzania Vanilla Beans Market Import-Export Trade Statistics |
7.1 Tanzania Vanilla Beans Market Export to Major Countries |
7.2 Tanzania Vanilla Beans Market Imports from Major Countries |
8 Tanzania Vanilla Beans Market Key Performance Indicators |
9 Tanzania Vanilla Beans Market - Opportunity Assessment |
9.1 Tanzania Vanilla Beans Market Opportunity Assessment, By Product Type, 2022 & 2032F |
9.2 Tanzania Vanilla Beans Market Opportunity Assessment, By Grade, 2022 & 2032F |
9.3 Tanzania Vanilla Beans Market Opportunity Assessment, By Origin, 2022 & 2032F |
9.4 Tanzania Vanilla Beans Market Opportunity Assessment, By Form, 2022 & 2032F |
9.5 Tanzania Vanilla Beans Market Opportunity Assessment, By Application, 2022 & 2032F |
9.6 Tanzania Vanilla Beans Market Opportunity Assessment, By Distribution Channel, 2022 & 2032F |
10 Tanzania Vanilla Beans Market - Competitive Landscape |
10.1 Tanzania Vanilla Beans Market Revenue Share, By Companies, 2025 |
10.2 Tanzania Vanilla Beans Market Competitive Benchmarking, By Operating and Technical Parameters |
11 Company Profiles |
12 Recommendations |
13 Disclaimer |
Global Go To Market Strategy - 2030
Export potential enables firms to identify high-growth global markets with greater confidence by combining advanced trade intelligence with a structured quantitative methodology. The framework analyzes emerging demand trends and country-level import patterns while integrating macroeconomic and trade datasets such as GDP and population forecasts, bilateral import–export flows, tariff structures, elasticity differentials between developed and developing economies, geographic distance, and import demand projections. Using weighted trade values from 2020–2024 as the base period to project country-to-country export potential for 2030, these inputs are operationalized through calculated drivers such as gravity model parameters, tariff impact factors, and projected GDP per-capita growth. Through an analysis of hidden potentials, demand hotspots, and market conditions that are most favorable to success, this method enables firms to focus on target countries, maximize returns, and global expansion with data, backed by accuracy.
By factoring in the projected importer demand gap that is currently unmet and could be potential opportunity, it identifies the potential for the Exporter (Country) among 190 countries, against the general trade analysis, which identifies the biggest importer or exporter.
To discover high-growth global markets and optimize your business strategy:
Click Here
Pricing
- Single User License$ 1,995
- Department License$ 2,400
- Site License$ 3,120
- Global License$ 3,795

Leadership Perspectives from Industry Events
Search
Thought Leadership and Analyst Meet


Our Clients
6WResearch In News
- India Air Conditioner Market Set for Strong Rebound in 2026 After Weather-Led Correction and GST-Driven Recovery: 6Wresearch
- ADAS in India: How Automatic Emergency Braking, Blind Spot Detection & Driver Monitoring are Transforming Road Safety
- Doha a strategic location for EV manufacturing hub: IPA Qatar
- Demand for luxury TVs surging in the GCC, says Samsung
- Empowering Growth: The Thriving Journey of Bangladesh’s Cable Industry
- Demand for luxury TVs surging in the GCC, says Samsung
Latest Reports
- Poland Fire Protection Systems Market (2026-2032)
- Cape Verde Portable Hand-Thrown Extinguisher Market (2026-2032)
- Canada Portable Hand-Thrown Extinguisher Market (2026-2032)
- Cameroon Portable Hand-Thrown Extinguisher Market (2026-2032)
- Burundi Portable Hand-Thrown Extinguisher Market (2026-2032)
- Burkina Faso Portable Hand-Thrown Extinguisher Market (2026-2032)
- Bulgaria Portable Hand-Thrown Extinguisher Market (2026-2032)
- Brunei Portable Hand-Thrown Extinguisher Market (2026-2032)
- Botswana Portable Hand-Thrown Extinguisher Market (2026-2032)
- Bosnia and Herzegovina Portable Hand-Thrown Extinguisher Market (2026-2032)
Industry Events and Analyst Meet

HIMTEX 2026

India Refining Summit 2026

India EV Show 2026

EV tech India Expo 2026

Auto Tech Asia 2026
Whitepaper
- Middle East & Africa Commercial Security Market Click here to view more.
- Middle East & Africa Fire Safety Systems & Equipment Market Click here to view more.
- GCC Drone Market Click here to view more.
- Middle East Lighting Fixture Market Click here to view more.
- GCC Physical & Perimeter Security Market Click here to view more.