Tanzania Vector Control Market (2025-2031) Outlook | Share, Revenue, Trends, Value, Size, Companies, Industry, Forecast, Analysis & Growth
Market Forecast By Vector Type (Insects , Rodents), By End Use Sector (Commercial & Industrial , Residential), By Method of Control (Chemical, Physical & Mechanical, Biological) And Competitive Landscape
| Product Code: ETC4593116 | Publication Date: Jul 2023 | Updated Date: Nov 2025 | Product Type: Report | |
| Publisher: 6Wresearch | Author: Summon Dutta | No. of Pages: 85 | No. of Figures: 45 | No. of Tables: 25 |
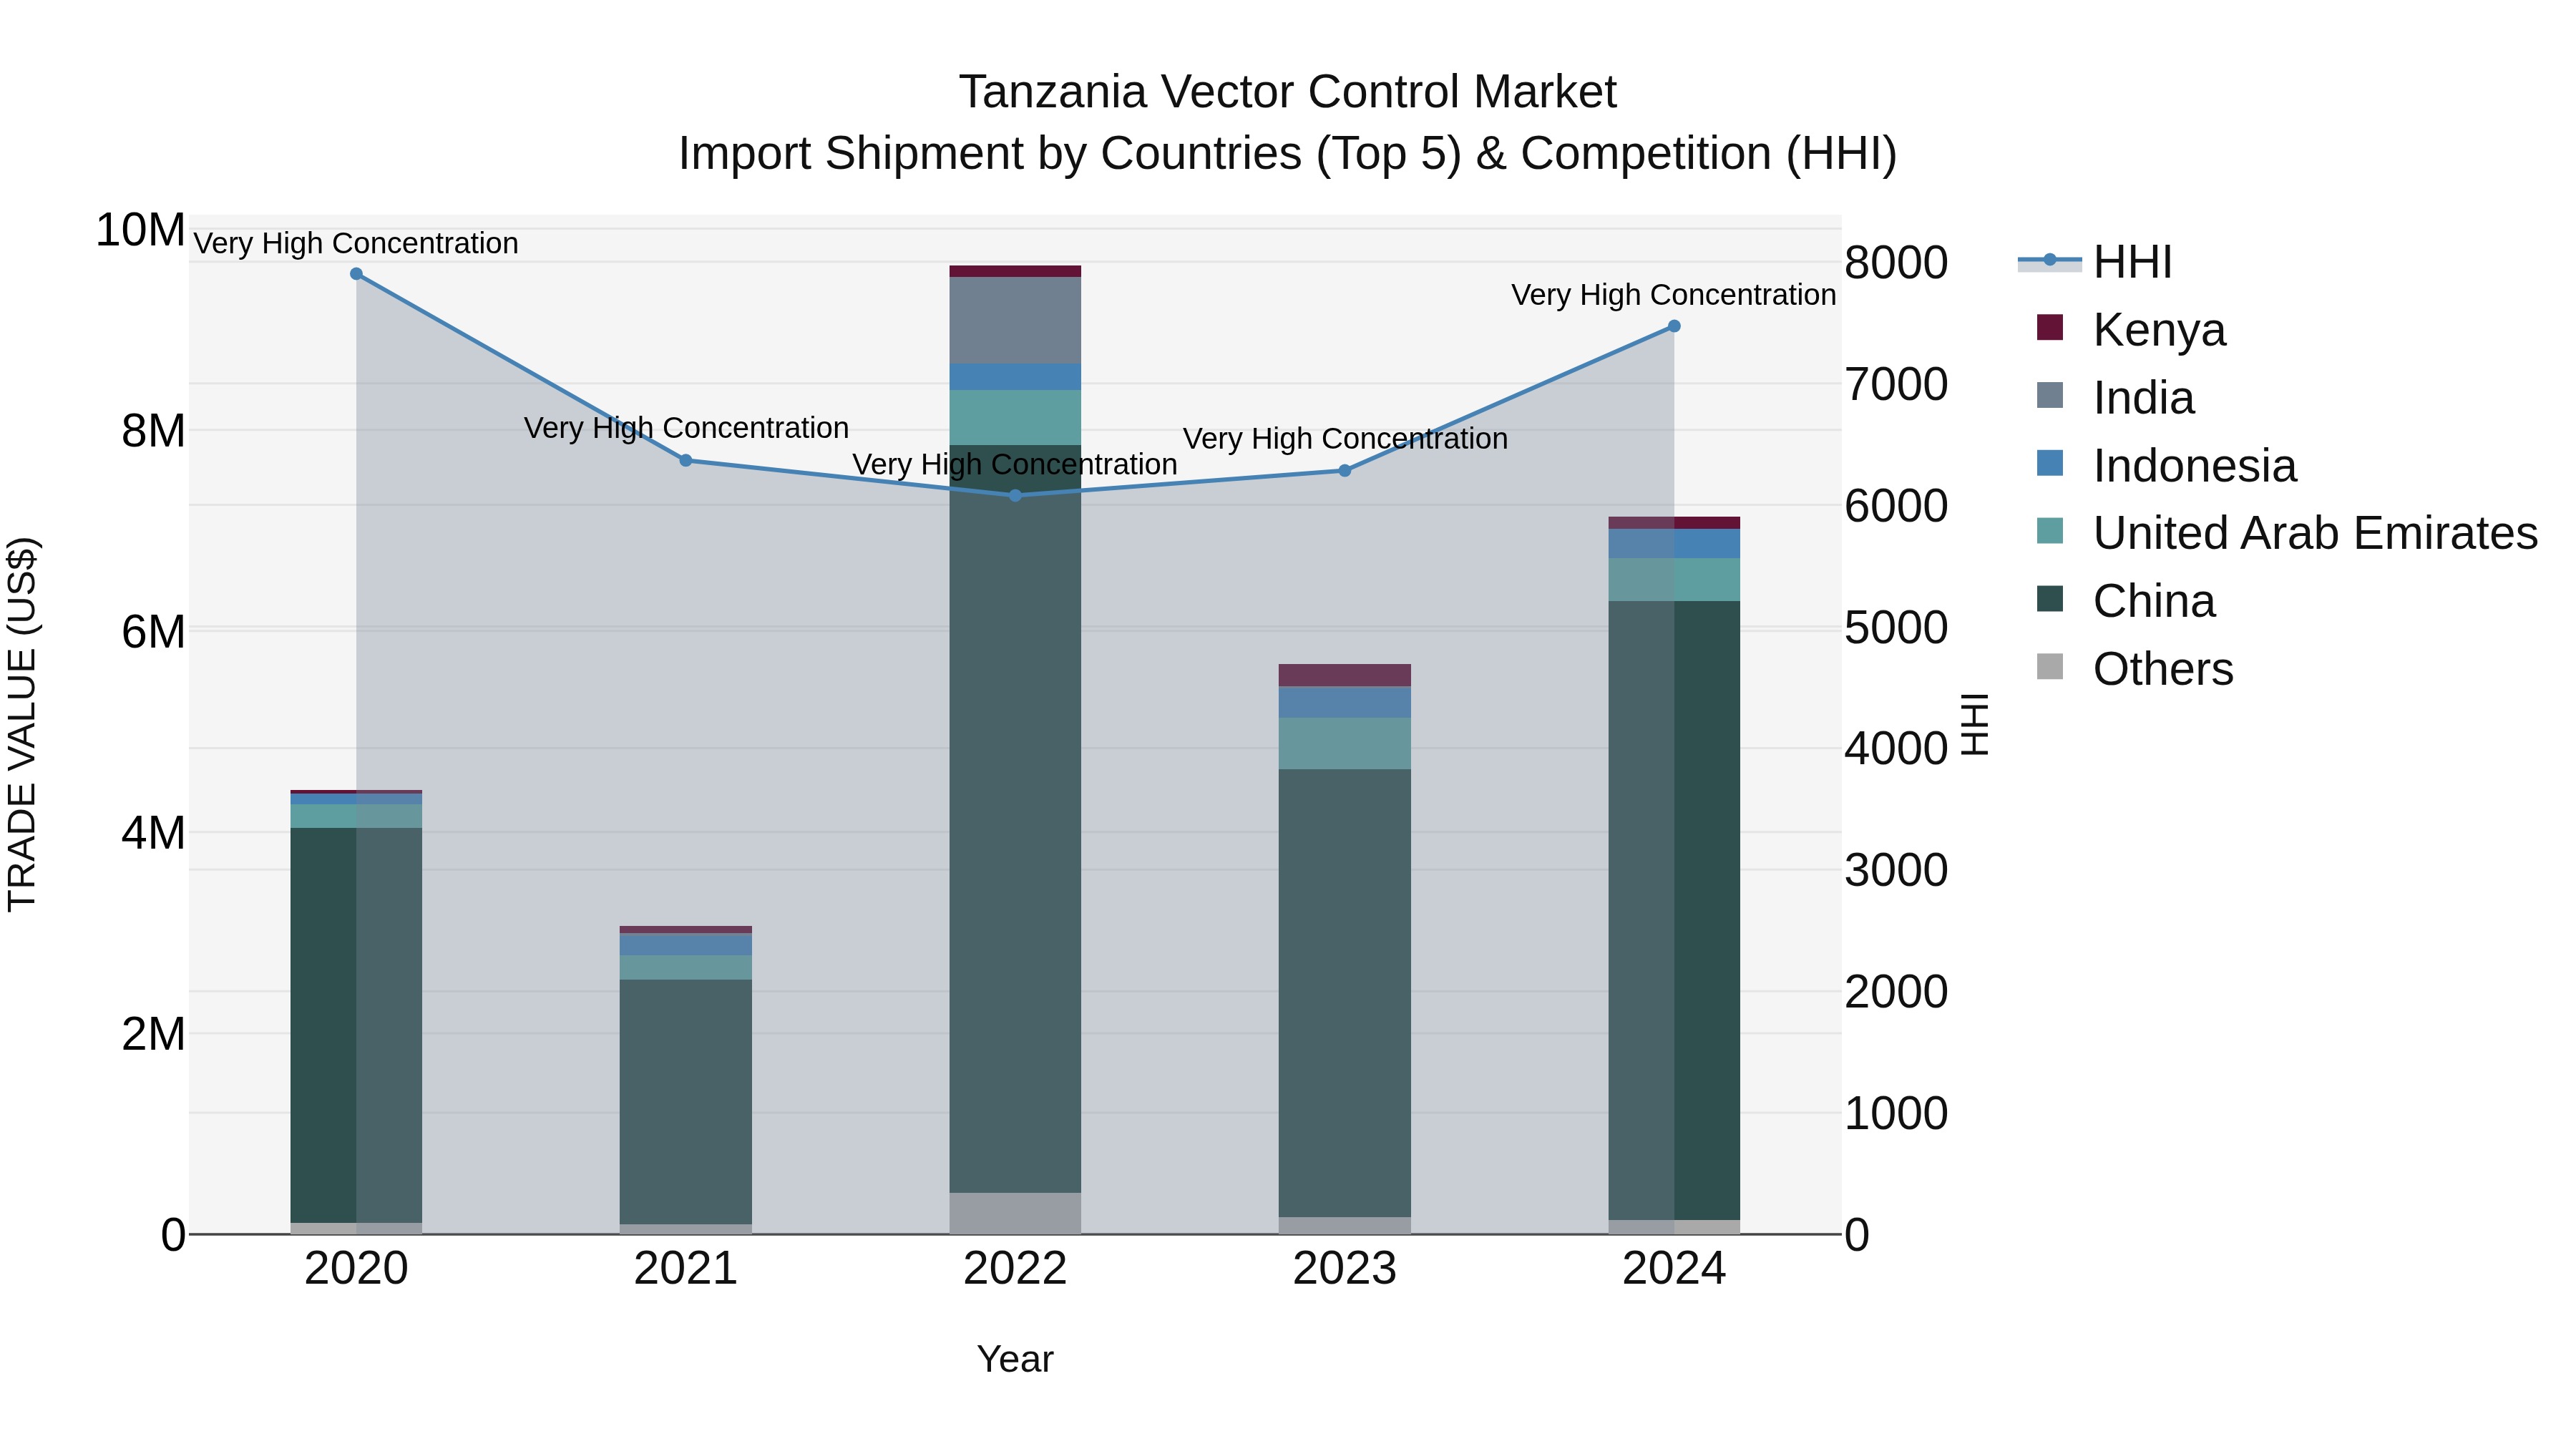
Tanzania Vector Control Market: Top 5 Importing Countries and Market Competition (HHI) Analysis
Tanzania continues to rely heavily on imports for vector control products, with key suppliers in 2024 being China, United Arab Emirates, Indonesia, Kenya, and Belgium. The market shows high concentration with a high Herfindahl-Hirschman Index (HHI) in 2024. The industry has been experiencing significant growth, with a compound annual growth rate (CAGR) of 12.75% from 2020 to 2024, and a notable growth rate of 25.9% from 2023 to 2024. This indicates a growing demand for vector control products in Tanzania, presenting opportunities for both domestic and international suppliers to capitalize on this trend.
Tanzania Vector Control Market Overview
The Vector Control Market in Tanzania is driven by the need for effective strategies to control disease-carrying vectors such as mosquitoes and flies. Vector control programs and products, including insecticides, biological control agents, and environmental management, help reduce the transmission of diseases such as malaria and dengue fever.
Drivers of the market
The Vector Control market in Tanzania is driven by the need for effective solutions to control disease-carrying vectors such as mosquitoes. Public health initiatives and the rising incidence of vector-borne diseases support the demand for vector control products and services.
Challenges of the market
Challenges include combating vector-borne diseases, ensuring effective pest management strategies, and addressing environmental and public health concerns. Adapting to climate change impacts and integrating vector control initiatives with public health policies are critical challenges for market sustainability and disease prevention.
Government Policy of the market
The Vector Control market in Tanzania focuses on strategies and products for preventing and managing vector-borne diseases transmitted by mosquitoes, ticks, and other insects. Vector control initiatives include insecticides, mosquito nets, and environmental management practices to reduce disease transmission and protect public health.
Key Highlights of the Report:
- Tanzania Vector Control Market Outlook
- Market Size of Tanzania Vector Control Market, 2024
- Forecast of Tanzania Vector Control Market, 2031
- Historical Data and Forecast of Tanzania Vector Control Revenues & Volume for the Period 2021-2031
- Tanzania Vector Control Market Trend Evolution
- Tanzania Vector Control Market Drivers and Challenges
- Tanzania Vector Control Price Trends
- Tanzania Vector Control Porter's Five Forces
- Tanzania Vector Control Industry Life Cycle
- Historical Data and Forecast of Tanzania Vector Control Market Revenues & Volume By Vector Type for the Period 2021-2031
- Historical Data and Forecast of Tanzania Vector Control Market Revenues & Volume By Insects for the Period 2021-2031
- Historical Data and Forecast of Tanzania Vector Control Market Revenues & Volume By Rodents for the Period 2021-2031
- Historical Data and Forecast of Tanzania Vector Control Market Revenues & Volume By End Use Sector for the Period 2021-2031
- Historical Data and Forecast of Tanzania Vector Control Market Revenues & Volume By Commercial & Industrial for the Period 2021-2031
- Historical Data and Forecast of Tanzania Vector Control Market Revenues & Volume By Residential for the Period 2021-2031
- Historical Data and Forecast of Tanzania Vector Control Market Revenues & Volume By Method of Control for the Period 2021-2031
- Historical Data and Forecast of Tanzania Vector Control Market Revenues & Volume By Chemical for the Period 2021-2031
- Historical Data and Forecast of Tanzania Vector Control Market Revenues & Volume By Physical & Mechanical for the Period 2021-2031
- Historical Data and Forecast of Tanzania Vector Control Market Revenues & Volume By Biological for the Period 2021-2031
- Tanzania Vector Control Import Export Trade Statistics
- Market Opportunity Assessment By Vector Type
- Market Opportunity Assessment By End Use Sector
- Market Opportunity Assessment By Method of Control
- Tanzania Vector Control Top Companies Market Share
- Tanzania Vector Control Competitive Benchmarking By Technical and Operational Parameters
- Tanzania Vector Control Company Profiles
- Tanzania Vector Control Key Strategic Recommendations
What are the emerging business and investment opportunities in the Tanzania vector control market?
Opportunity lies in the development and distribution of innovative vector control products such as insecticide-treated bed nets, like those produced by companies such as Vestergaard and BASF, to combat diseases like malaria and dengue fever in Tanzania.
Customers in the Tanzania vector control market show a strong preference for eco-friendly and non-toxic solutions. Companies like Mortein and Raid have introduced botanical-based insecticides that have gained popularity among consumers due to their safety and effectiveness in controlling mosquitoes and other disease-carrying vectors. This trend indicates a growing awareness and demand for sustainable and health-conscious products in the market.
The Tanzania vector control market encompasses various products and services aimed at controlling disease-carrying vectors such as mosquitoes, flies, and ticks. This includes insecticide-treated bed nets provided by companies like Sumitomo Chemical and BASF, indoor residual spraying services offered by organizations like the Tanzanian National Institute for Medical Research, as well as larval control programs implemented by the Tanzanian Ministry of Health.
In the Tanzania vector control market, key competitors include companies like Sumitomo Chemical, BASF SE, and Bayer AG. Sumitomo Chemical is known for its innovative vector control products such as SumiLarv granules, while BASF SE offers a wide range of solutions including insecticides and larvicides. Bayer AG, on the other hand, is recognized for its expertise in developing effective vector control strategies. These competitors have strong brand presence and strategic partnerships in Tanzania, positioning them as leaders in the market.
In response to increasing awareness about mosquito-borne diseases like malaria and dengue fever, consumers in Tanzania are increasingly leaning towards environmentally friendly and long-lasting insecticide-treated nets (LLINs) such as those offered by brands like Sumitomo Chemical. On the technology front, the market is witnessing a shift towards innovative vector control solutions like mosquito traps equipped with solar-powered sensors, exemplified by the Suna trap developed by Ifakara Health Institute. Additionally, policymakers are emphasizing the importance of community engagement and sustainable vector control strategies, leading to collaborations between the Tanzanian government and organizations like the World Health Organization (WHO) to implement comprehensive mosquito control programs.
6Wresearch actively monitors the Tanzania Vector Control Market and publishes its comprehensive annual report, highlighting emerging trends, growth drivers, revenue analysis, and forecast outlook. Our insights help businesses to make data-backed strategic decisions with ongoing market dynamics. Our analysts track relevent industries related to the Tanzania Vector Control Market, allowing our clients with actionable intelligence and reliable forecasts tailored to emerging regional needs.
Yes, we provide customisation as per your requirements. To learn more, feel free to contact us on sales@6wresearch.com
1 Executive Summary |
2 Introduction |
2.1 Key Highlights of the Report |
2.2 Report Description |
2.3 Market Scope & Segmentation |
2.4 Research Methodology |
2.5 Assumptions |
3 Tanzania Vector Control Market Overview |
3.1 Tanzania Country Macro Economic Indicators |
3.2 Tanzania Vector Control Market Revenues & Volume, 2021 & 2031F |
3.3 Tanzania Vector Control Market - Industry Life Cycle |
3.4 Tanzania Vector Control Market - Porter's Five Forces |
3.5 Tanzania Vector Control Market Revenues & Volume Share, By Vector Type, 2021 & 2031F |
3.6 Tanzania Vector Control Market Revenues & Volume Share, By End Use Sector, 2021 & 2031F |
3.7 Tanzania Vector Control Market Revenues & Volume Share, By Method of Control, 2021 & 2031F |
4 Tanzania Vector Control Market Dynamics |
4.1 Impact Analysis |
4.2 Market Drivers |
4.2.1 Increasing incidences of vector-borne diseases in Tanzania |
4.2.2 Government initiatives to control vector populations |
4.2.3 Growing awareness about the importance of vector control in public health |
4.3 Market Restraints |
4.3.1 Limited access to vector control products in rural areas |
4.3.2 Lack of skilled personnel for effective vector control measures |
4.3.3 Budget constraints impacting the implementation of comprehensive vector control programs |
5 Tanzania Vector Control Market Trends |
6 Tanzania Vector Control Market, By Types |
6.1 Tanzania Vector Control Market, By Vector Type |
6.1.1 Overview and Analysis |
6.1.2 Tanzania Vector Control Market Revenues & Volume, By Vector Type, 2021-2031F |
6.1.3 Tanzania Vector Control Market Revenues & Volume, By Insects , 2021-2031F |
6.1.4 Tanzania Vector Control Market Revenues & Volume, By Rodents, 2021-2031F |
6.2 Tanzania Vector Control Market, By End Use Sector |
6.2.1 Overview and Analysis |
6.2.2 Tanzania Vector Control Market Revenues & Volume, By Commercial & Industrial , 2021-2031F |
6.2.3 Tanzania Vector Control Market Revenues & Volume, By Residential, 2021-2031F |
6.3 Tanzania Vector Control Market, By Method of Control |
6.3.1 Overview and Analysis |
6.3.2 Tanzania Vector Control Market Revenues & Volume, By Chemical, 2021-2031F |
6.3.3 Tanzania Vector Control Market Revenues & Volume, By Physical & Mechanical, 2021-2031F |
6.3.4 Tanzania Vector Control Market Revenues & Volume, By Biological, 2021-2031F |
7 Tanzania Vector Control Market Import-Export Trade Statistics |
7.1 Tanzania Vector Control Market Export to Major Countries |
7.2 Tanzania Vector Control Market Imports from Major Countries |
8 Tanzania Vector Control Market Key Performance Indicators |
8.1 Percentage increase in the adoption of integrated vector control strategies |
8.2 Number of training programs conducted for vector control personnel |
8.3 Rate of successful vector control interventions implemented |
8.4 Percentage reduction in vector-borne disease cases |
8.5 Level of community engagement and participation in vector control initiatives |
9 Tanzania Vector Control Market - Opportunity Assessment |
9.1 Tanzania Vector Control Market Opportunity Assessment, By Vector Type, 2021 & 2031F |
9.2 Tanzania Vector Control Market Opportunity Assessment, By End Use Sector, 2021 & 2031F |
9.3 Tanzania Vector Control Market Opportunity Assessment, By Method of Control, 2021 & 2031F |
10 Tanzania Vector Control Market - Competitive Landscape |
10.1 Tanzania Vector Control Market Revenue Share, By Companies, 2024 |
10.2 Tanzania Vector Control Market Competitive Benchmarking, By Operating and Technical Parameters |
11 Company Profiles |
12 Recommendations |
13 Disclaimer |
Export potential assessment - trade Analytics for 2030
Export potential enables firms to identify high-growth global markets with greater confidence by combining advanced trade intelligence with a structured quantitative methodology. The framework analyzes emerging demand trends and country-level import patterns while integrating macroeconomic and trade datasets such as GDP and population forecasts, bilateral import–export flows, tariff structures, elasticity differentials between developed and developing economies, geographic distance, and import demand projections. Using weighted trade values from 2020–2024 as the base period to project country-to-country export potential for 2030, these inputs are operationalized through calculated drivers such as gravity model parameters, tariff impact factors, and projected GDP per-capita growth. Through an analysis of hidden potentials, demand hotspots, and market conditions that are most favorable to success, this method enables firms to focus on target countries, maximize returns, and global expansion with data, backed by accuracy.
By factoring in the projected importer demand gap that is currently unmet and could be potential opportunity, it identifies the potential for the Exporter (Country) among 190 countries, against the general trade analysis, which identifies the biggest importer or exporter.
To discover high-growth global markets and optimize your business strategy:
Click Here
Pricing
- Single User License$ 1,995
- Department License$ 2,400
- Site License$ 3,120
- Global License$ 3,795

Search
Thought Leadership and Analyst Meet


Our Clients
Latest Reports
- United Kingdom (UK) Long-term Care Insurance Market (2026-2032) | Growth, Share, Consumer Insights, Drivers, Opportunities, Competition, Pricing Analysis, Segments, Restraints, Companies, Competitive, Value, Outlook, Size, Demand, Analysis, Challenges, Strategic Insights, Investment Trends, Revenue, Trends, Supply, Forecast
- United Kingdom (UK) Long Term Care Market (2026-2032) | Companies, Outlook, Analysis, Trends, Value, Revenue, Segmentation, Share, Forecast, Competitive Landscape, Growth, Size & Forecast
- Iraq Insulation and Waterproofing Market (2026-2032) | Outlook, Drivers, Growth, Size, Share, Industry, Revenue, Trends, Demand, Competitive, Strategic Insights, Opportunities, Segments, Companies, Challenges, Strategy, Consumer Insights, Analysis, Investment Trends, Value, Segmentation, Forecast, Restraints
- India Switchgear Market Outlook (2026 - 2032) | Size, Share, Trends, Growth, Revenue, Forecast, Analysis, Value, Outlook
- Pakistan Contraceptive Implants Market (2025-2031) | Demand, Growth, Size, Share, Industry, Pricing Analysis, Competitive, Strategic Insights, Strategy, Consumer Insights, Analysis, Investment Trends, Opportunities, Revenue, Segments, Value, Segmentation, Supply, Forecast, Restraints, Outlook, Competition, Drivers, Trends, Companies, Challenges
- Sri Lanka Packaging Market (2026-2032) | Outlook, Competition, Drivers, Trends, Demand, Pricing Analysis, Competitive, Strategic Insights, Companies, Challenges, Strategy, Consumer Insights, Analysis, Investment Trends, Opportunities, Growth, Size, Share, Industry, Revenue, Segments, Value, Segmentation, Supply, Forecast, Restraints
- India Kids Watches Market (2026-2032) | Strategy, Consumer Insights, Analysis, Investment Trends, Opportunities, Growth, Size, Share, Industry, Revenue, Segments, Value, Segmentation, Supply, Forecast, Restraints, Outlook, Competition, Drivers, Trends, Demand, Pricing Analysis, Competitive, Strategic Insights, Companies, Challenges
- Saudi Arabia Core Assurance Service Market (2025-2031) | Strategy, Consumer Insights, Analysis, Investment Trends, Opportunities, Growth, Size, Share, Industry, Revenue, Segments, Value, Segmentation, Supply, Forecast, Restraints, Outlook, Competition, Drivers, Trends, Demand, Pricing Analysis, Competitive, Strategic Insights, Companies, Challenges
- Romania Uninterruptible Power Supply (UPS) Market (2026-2032) | Industry, Analysis, Revenue, Size, Forecast, Outlook, Value, Trends, Share, Growth & Companies
- Saudi Arabia Car Window Tinting Film, Paint Protection Film (PPF), and Ceramic Coating Market (2025-2031) | Strategy, Consumer Insights, Analysis, Investment Trends, Opportunities, Growth, Size, Share, Industry, Revenue, Segments, Value, Segmentation, Supply, Forecast, Restraints, Outlook, Competition, Drivers, Trends, Demand, Pricing Analysis, Competitive, Strategic Insights, Companies, Challenges
Industry Events and Analyst Meet

India EV Show 2026

EV tech India Expo 2026

Auto Tech Asia 2026

Battery Tech India 2026

Smart Production Solutions Guangzhou 2026
Whitepaper
- Middle East & Africa Commercial Security Market Click here to view more.
- Middle East & Africa Fire Safety Systems & Equipment Market Click here to view more.
- GCC Drone Market Click here to view more.
- Middle East Lighting Fixture Market Click here to view more.
- GCC Physical & Perimeter Security Market Click here to view more.
6WResearch In News
- Doha a strategic location for EV manufacturing hub: IPA Qatar
- Demand for luxury TVs surging in the GCC, says Samsung
- Empowering Growth: The Thriving Journey of Bangladesh’s Cable Industry
- Demand for luxury TVs surging in the GCC, says Samsung
- Video call with a traditional healer? Once unthinkable, it’s now common in South Africa
- Intelligent Buildings To Smooth GCC’s Path To Net Zero