Thailand Mobility-as-a-service Market (2026-2032) Outlook | Analysis, Industry, Companies, Trends, Growth, Size, Revenue, Value, Share & Forecast
Market Forecast By Solution Type (Technology Platform, Insurance Services, Telecom Connectivity Providers, Payment Engines, Ticketing Solutions, Navigation Solutions), By Service Type (Ride Hailing, Car Sharing, Micromobility, Bus Sharing, Train Services), By Transportation Type (Public, Private), By Vehicle Type (Micro mobility, Trains, Buses, Four-wheelers), By Application Type (Personalized Application Services, Journey Management, Journey Planning, Flexible Payments and Transactions), By Operating System (Android, iOS, Others) And Competitive Landscape
| Product Code: ETC071324 | Publication Date: Jul 2023 | Updated Date: Jun 2026 | Product Type: Report | |
| Publisher: 6Wresearch | Author: Ravi Bhandari | No. of Pages: 70 | No. of Figures: 35 | No. of Tables: 5 |
Thailand Mobility-as-a-service Market Size, Share & Growth Rate
The Thailand Mobility-as-a-service Market was estimated at USD 213 Million in 2025 and is projected to reach USD 244 Million by 2032, growing at a CAGR of 2.0% from 2026 to 2032. This modest growth trajectory reflects the increasing urgency among Thai cities to innovate transportation solutions amidst escalating urban congestion and environmental pressures. Enhanced connectivity through digital platforms will be a driving force, as both the government and private sectors prioritize a seamless user experience in mobility.
Thailand Mobility-as-a-service Market Growth Rate Analysis (2021-2032)
The Thailand Mobility-as-a-Service (MaaS) market has shown a notable upward trend since a decline of 3.1% in 2021, reflecting a recovery propelled by increasing consumer demand and significant investments in digital infrastructure. The growth rebounded to 2.7% in 2022, followed by a more robust 3.0% in 2023 as mobility solutions became more integrated and accessible. Government policies promoting sustainable transportation are also stimulating expansion. The market is projected to continue this upward momentum, with growth rates of 3.2% in 2025 and a steady 3.0% in subsequent years, despite slight fluctuations due to varying consumer sentiment and sectorial challenges. With ongoing digitalization, the MaaS landscape is poised for sustained evolution.
Thailand Mobility-as-a-service Market Year-wise Growth Rate and Key Drivers
This graph highlights how the Thailand Mobility-as-a-service Market has steadily grown over the past five years, supported by major growth factors.
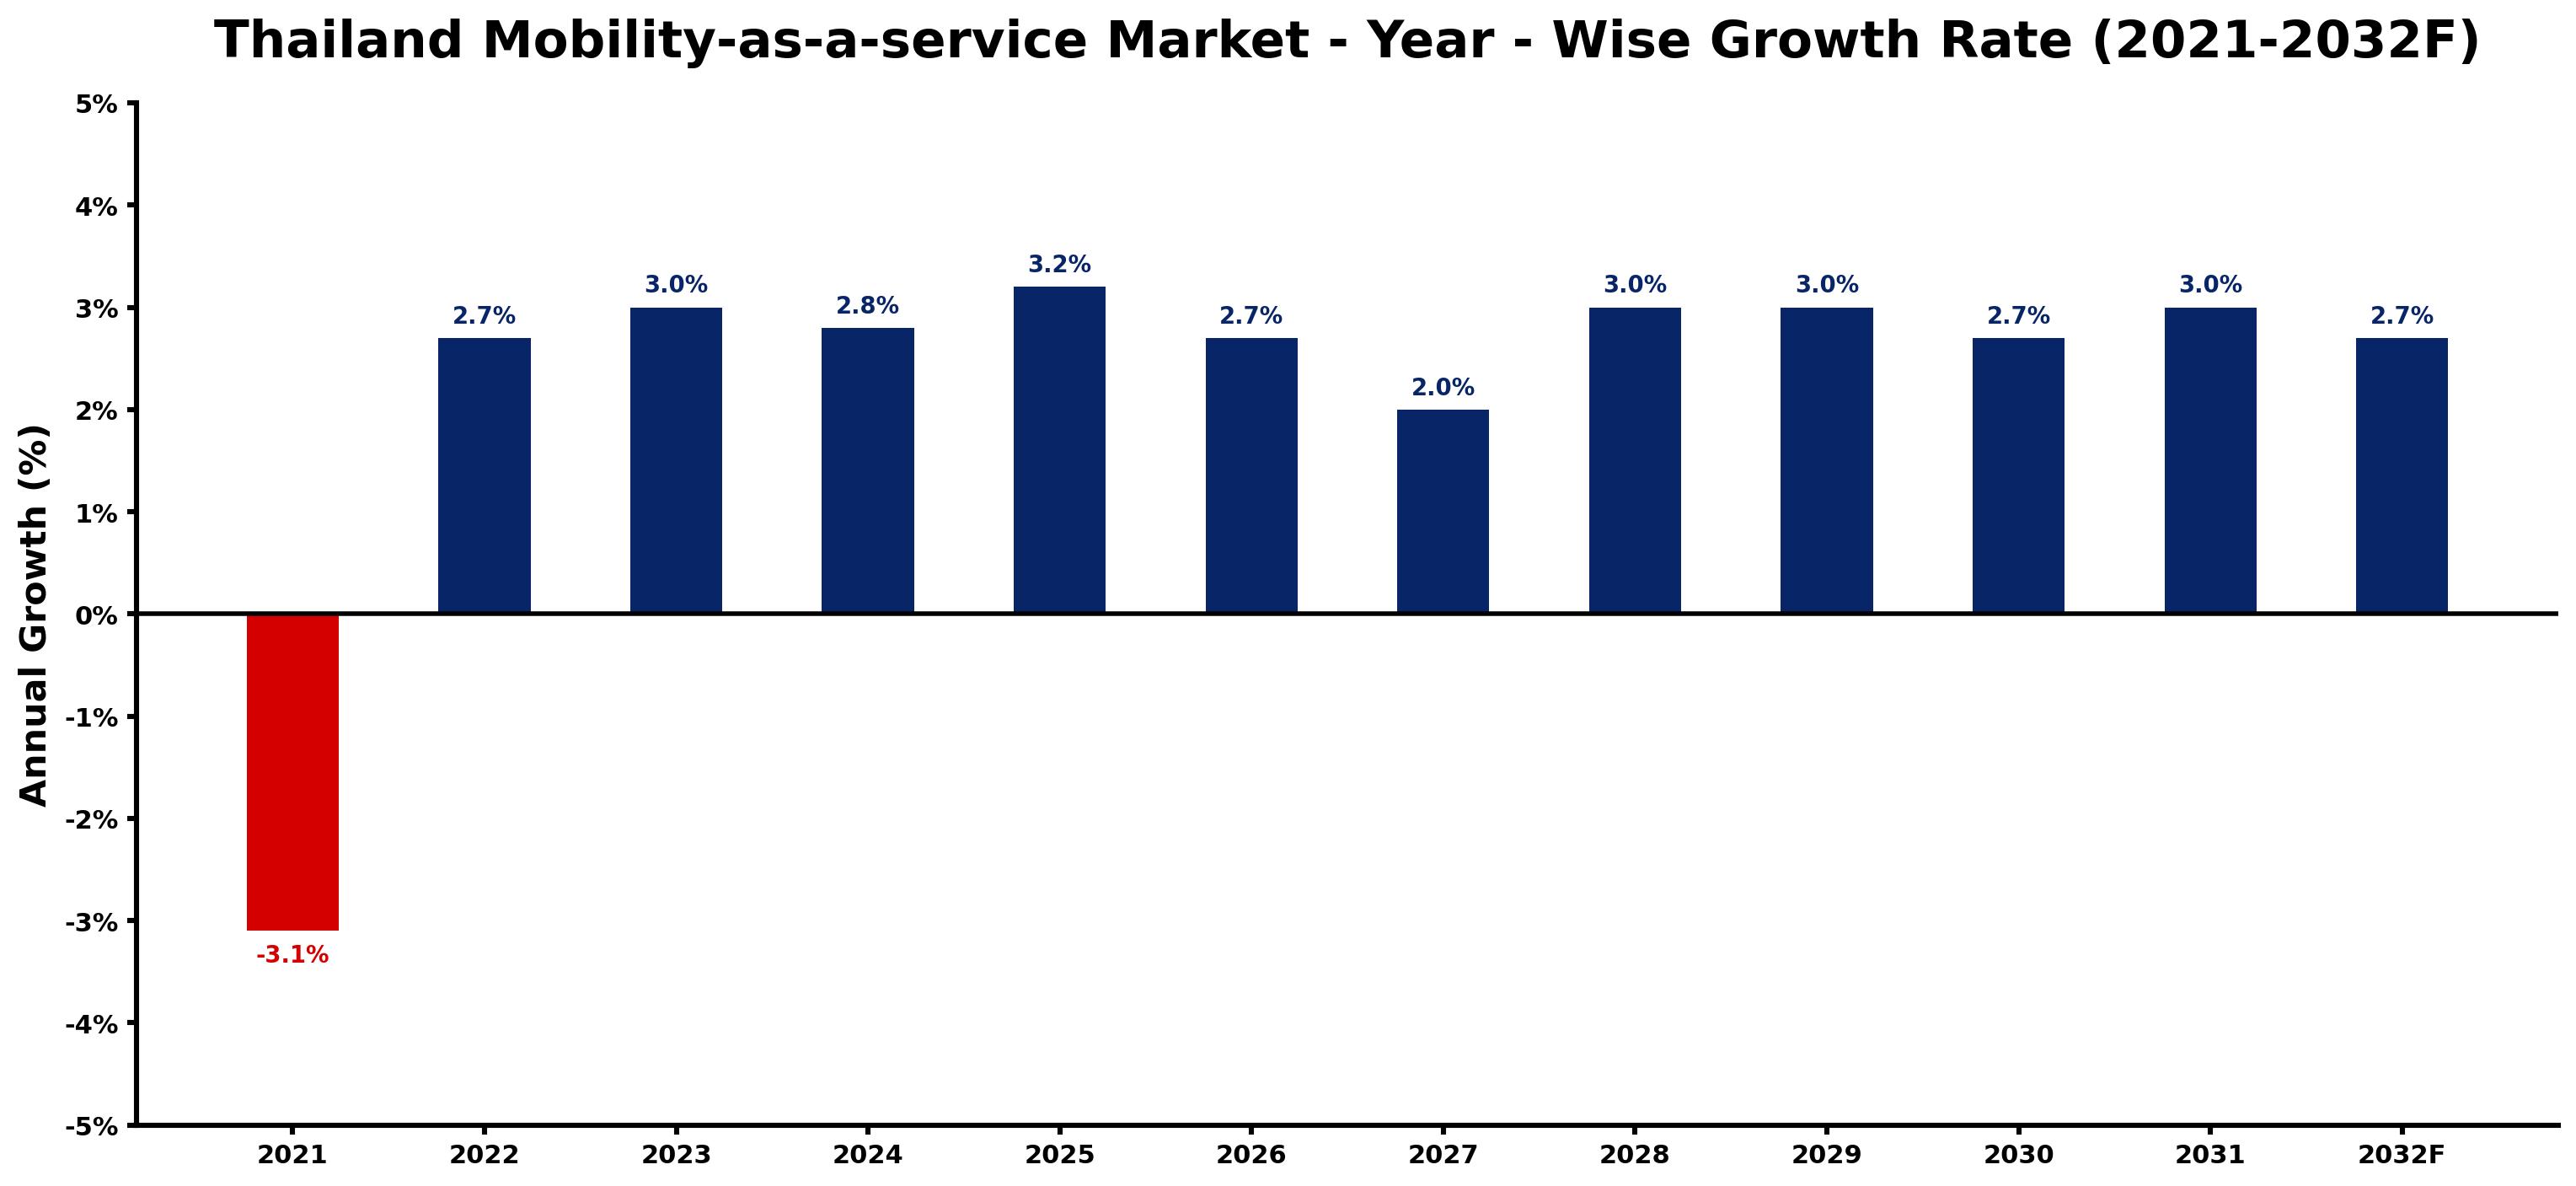
The table below presents the year‑wise growth rates along with the key drivers influencing the market
| Year | Growth Rate | Major Drivers |
| 2021 | -3.1% | Expansion of commercial construction activities |
| 2022 | 2.7% | Growing renewable energy integration projects |
| 2023 | 3.0% | Growing renewable energy integration projects |
| 2024 | 2.8% | Rising electricity demand across industries |
| 2025 | 3.2% | Expansion of transportation and logistics networks |
| 2026 | 2.7% | Growing renewable energy integration projects |
| 2027 | 2.0% | Expansion of transportation and logistics networks |
| 2028 | 3.0% | Rising electricity demand across industries |
| 2029 | 3.0% | Growing urbanization and commercial development |
| 2030 | 2.7% | Expansion of manufacturing activities |
| 2031 | 3.0% | Expansion of transportation and logistics networks |
| 2032 | 2.7% | Expansion of commercial construction activities |
Note - Market size estimations and growth projections presented in this report are based on 6Wresearch’s advanced forecasting approach, validated with industry datasets as of June 2026.
Thailand Mobility-as-a-service Market Synopsis
Currently, the most significant force shaping the Thailand Mobility-as-a-service market is the rapid urbanization of major cities, coupled with the government's push for sustainable transportation solutions. The demand for a cohesive, multimodal transit experience is becoming more pronounced as the population grows and urban areas expand.
Furthermore, the widespread adoption of smartphones and digital payment systems has laid a robust foundation for MaaS solutions. By integrating various modes of transport into single platforms, these solutions not only enhance user convenience but also align with national goals for reducing traffic congestion and emissions.
Thailand Mobility-as-a-service Market Key Takeaways
- The integration of multiple transport modes into a single digital platform is paramount for user adoption.
- Government initiatives to promote sustainable mobility are crucial drivers of market growth.
- Collaboration between private and public sectors is essential for overcoming operational barriers.
- Technological advancements, particularly in mobile apps and payment systems, are enhancing user experiences.
- Real-time data services have become essential to meet evolving consumer expectations.
Evaluation of Restraints in Thailand Mobility-as-a-service Market
While the Thailand Mobility-as-a-service market is on an upward trajectory, significant restraints are hindering its full potential. Chief among these is the challenge of fostering collaboration among disparate transportation service providers. The success of MaaS platforms hinges on the seamless integration of various services, which requires overcoming data-sharing and regulatory obstacles. Additionally, issues related to user data privacy and security must be addressed to build trust and drive wider adoption among commuters.
Thailand Mobility-as-a-service Market Trends
Emerging trends in the Thailand Mobility-as-a-service market are heavily influenced by technological innovations and shifting consumer behaviors. The rise of electric vehicles (EVs) is propelling the development of environmentally friendly mobility options within MaaS frameworks. Moreover, user-centric applications incorporating AI and machine learning are enhancing service personalization. Subscription-based models are also gaining traction, providing users with flexible and cost-effective options for various transportation needs.
Thailand Mobility-as-a-service Market Opportunities
There are substantial opportunities for growth within the Thailand Mobility-as-a-service market, particularly in the realm of smart infrastructure development. Investments in integrated transit hubs and charging stations for EVs could facilitate seamless intermodal transfers. Additionally, the rise of micro-mobility solutions—such as scooters and bike-sharing services—presents an untapped avenue for expanding mobility options in urban areas. Lastly, leveraging data analytics to enhance service delivery and customer engagement can drive further market penetration.
Government Initiatives in the Thailand Mobility-as-a-service Market
The Thai government is actively supporting the growth of the Mobility-as-a-service market through various policies aimed at fostering sustainable urban mobility. Initiatives include investments in public transit infrastructure and the promotion of electric vehicles to reduce carbon emissions. Public-private partnerships are also being encouraged to develop smart transportation systems, thereby enhancing the overall efficiency of urban mobility.
Future Insights of the Thailand Mobility-as-a-service Market
Looking forward to 2026-2032, the Thailand Mobility-as-a-service market is poised for transformation driven by technological advancements and evolving consumer expectations. The adoption of more integrated platforms that facilitate seamless mobility options is likely to increase, as urban populations continue to grow. With the government's commitment to sustainable transport solutions, we can anticipate significant investments in infrastructure, ultimately leading to an improved and diversified mobility landscape.
Thailand Mobility-as-a-service Market Latest Developments (May 2025 - June 2026)
Recent developments in the Thailand Mobility-as-a-service market indicate a focused effort towards creating a more cohesive urban transport ecosystem. Noteworthy advancements in technology have facilitated better integration of transportation services, allowing for improved user experiences. Increasing collaborations between various service providers and governmental organizations have also marked a shift towards a more unified approach in tackling urban mobility challenges.
Thailand Mobility-as-a-service Market - Key Attractiveness of the Report
- 10 Years of Market Numbers
- Historical Data Starting from 2022 to 2025
- Base Year: 2025
- Forecast Data until 2032
- Key Performance Indicators Impacting the Market
- Major Upcoming Developments and Projects
Key Highlights of the Report:
- Thailand Mobility-as-a-service Market Outlook
- Market Size of Thailand Mobility-as-a-service Market, 2025
- Forecast of Thailand Mobility-as-a-service Market, 2032
- Historical Data and Forecast of Thailand Mobility-as-a-service Revenues & Volume for the Period 2022-2032F
- Thailand Mobility-as-a-service Market Trend Evolution
- Thailand Mobility-as-a-service Market Drivers and Challenges
- Thailand Mobility-as-a-service Price Trends
- Thailand Mobility-as-a-service Porter's Five Forces
- Thailand Mobility-as-a-service Industry Life Cycle
- Historical Data and Forecast of Thailand Mobility-as-a-service Market Revenues & Volume By Solution Type for the Period 2022-2032F
- Historical Data and Forecast of Thailand Mobility-as-a-service Market Revenues & Volume By Technology Platform for the Period 2022-2032F
- Historical Data and Forecast of Thailand Mobility-as-a-service Market Revenues & Volume By Insurance Services for the Period 2022-2032F
- Historical Data and Forecast of Thailand Mobility-as-a-service Market Revenues & Volume By Telecom Connectivity Providers for the Period 2022-2032F
- Historical Data and Forecast of Thailand Mobility-as-a-service Market Revenues & Volume By Payment Engines for the Period 2022-2032F
- Historical Data and Forecast of Thailand Mobility-as-a-service Market Revenues & Volume By Ticketing Solutions for the Period 2022-2032F
- Historical Data and Forecast of Thailand Mobility-as-a-service Market Revenues & Volume By Navigation Solutions for the Period 2022-2032F
- Historical Data and Forecast of Thailand Mobility-as-a-service Market Revenues & Volume By Service Type for the Period 2022-2032F
- Historical Data and Forecast of Thailand Mobility-as-a-service Market Revenues & Volume By Ride Hailing for the Period 2022-2032F
- Historical Data and Forecast of Thailand Mobility-as-a-service Market Revenues & Volume By Car Sharing for the Period 2022-2032F
- Historical Data and Forecast of Thailand Mobility-as-a-service Market Revenues & Volume By Micromobility for the Period 2022-2032F
- Historical Data and Forecast of Thailand Mobility-as-a-service Market Revenues & Volume By Bus Sharing for the Period 2022-2032F
- Historical Data and Forecast of Thailand Mobility-as-a-service Market Revenues & Volume By Train Services for the Period 2022-2032F
- Historical Data and Forecast of Thailand Mobility-as-a-service Market Revenues & Volume By Transportation Type for the Period 2022-2032F
- Historical Data and Forecast of Thailand Mobility-as-a-service Market Revenues & Volume By Public for the Period 2022-2032F
- Historical Data and Forecast of Thailand Mobility-as-a-service Market Revenues & Volume By Private for the Period 2022-2032F
- Historical Data and Forecast of Thailand Mobility-as-a-service Market Revenues & Volume By Vehicle Type for the Period 2022-2032F
- Historical Data and Forecast of Thailand Mobility-as-a-service Market Revenues & Volume By Micro mobility for the Period 2022-2032F
- Historical Data and Forecast of Thailand Mobility-as-a-service Market Revenues & Volume By Trains for the Period 2022-2032F
- Historical Data and Forecast of Thailand Mobility-as-a-service Market Revenues & Volume By Buses for the Period 2022-2032F
- Historical Data and Forecast of Thailand Mobility-as-a-service Market Revenues & Volume By Four-wheelers for the Period 2022-2032F
- Historical Data and Forecast of Thailand Mobility-as-a-service Market Revenues & Volume By Application Type for the Period 2022-2032F
- Historical Data and Forecast of Thailand Mobility-as-a-service Market Revenues & Volume By Personalized Application Services for the Period 2022-2032F
- Historical Data and Forecast of Thailand Mobility-as-a-service Market Revenues & Volume By Journey Management for the Period 2022-2032F
- Historical Data and Forecast of Thailand Mobility-as-a-service Market Revenues & Volume By Journey Planning for the Period 2022-2032F
- Historical Data and Forecast of Thailand Mobility-as-a-service Market Revenues & Volume By Flexible Payments and Transactions for the Period 2022-2032F
- Historical Data and Forecast of Thailand Mobility-as-a-service Market Revenues & Volume By Operating System for the Period 2022-2032F
- Historical Data and Forecast of Thailand Mobility-as-a-service Market Revenues & Volume By Android for the Period 2022-2032F
- Historical Data and Forecast of Thailand Mobility-as-a-service Market Revenues & Volume By iOS for the Period 2022-2032F
- Historical Data and Forecast of Thailand Mobility-as-a-service Market Revenues & Volume By Others for the Period 2022-2032F
- Thailand Mobility-as-a-service Import Export Trade Statistics
- Market Opportunity Assessment By Solution Type
- Market Opportunity Assessment By Service Type
- Market Opportunity Assessment By Transportation Type
- Market Opportunity Assessment By Vehicle Type
- Market Opportunity Assessment By Application Type
- Market Opportunity Assessment By Operating System
- Thailand Mobility-as-a-service Top Companies Market Share
- Thailand Mobility-as-a-service Competitive Benchmarking By Technical and Operational Parameters
- Thailand Mobility-as-a-service Company Profiles
- Thailand Mobility-as-a-service Key Strategic Recommendations
Thailand Mobility-as-a-service Market - Frequently Asked Questions
The Thailand Mobility-as-a-service Market is projected to reach USD 244 Million by 2032, growing from an estimated USD 213 Million in 2025, at a CAGR of 2.0% from 2026 to 2032.
The Thai government is investing in public transport infrastructure and promoting electric vehicles as part of its initiatives to foster sustainable urban mobility solutions, while encouraging public-private partnerships to enhance service efficiency.
Technology is central to the MaaS market, enabling seamless integration of various transport modes through digital platforms, enhancing user experience with AI-driven personalization and real-time data access.
Key growth drivers include rapid urbanization, increasing smartphone penetration, and government initiatives aimed at promoting sustainable transportation solutions.
Challenges include the need for collaboration among various transport service providers, as well as addressing data privacy and security concerns to foster user trust in MaaS platforms.
6Wresearch actively monitors the Thailand Mobility-as-a-service Market and publishes its comprehensive annual report, highlighting emerging trends, growth drivers, revenue analysis, and forecast outlook. Our insights help businesses to make data-backed strategic decisions with ongoing market dynamics. Our analysts track relevent industries related to the Thailand Mobility-as-a-service Market, allowing our clients with actionable intelligence and reliable forecasts tailored to emerging regional needs.
Yes, we provide customisation as per your requirements. To learn more, feel free to contact us on sales@6wresearch.com
1 Executive Summary |
2 Introduction |
2.1 Key Highlights of the Report |
2.2 Report Description |
2.3 Market Scope & Segmentation |
2.4 Research Methodology |
2.5 Assumptions |
3 Thailand Mobility-as-a-service Market Overview |
3.1 Thailand Country Macro Economic Indicators |
3.2 Thailand Mobility-as-a-service Market Revenues & Volume, 2022 & 2032F |
3.3 Thailand Mobility-as-a-service Market - Industry Life Cycle |
3.4 Thailand Mobility-as-a-service Market - Porter's Five Forces |
3.5 Thailand Mobility-as-a-service Market Revenues & Volume Share, By Solution Type, 2022 & 2032F |
3.6 Thailand Mobility-as-a-service Market Revenues & Volume Share, By Service Type, 2022 & 2032F |
3.7 Thailand Mobility-as-a-service Market Revenues & Volume Share, By Transportation Type, 2022 & 2032F |
3.8 Thailand Mobility-as-a-service Market Revenues & Volume Share, By Vehicle Type, 2022 & 2032F |
3.9 Thailand Mobility-as-a-service Market Revenues & Volume Share, By Application Type, 2022 & 2032F |
3.10 Thailand Mobility-as-a-service Market Revenues & Volume Share, By Operating System, 2022 & 2032F |
4 Thailand Mobility-as-a-service Market Dynamics |
4.1 Impact Analysis |
4.2 Market Drivers |
4.2.1 Increasing urbanization and congestion in major cities of Thailand leading to a higher demand for efficient mobility solutions. |
4.2.2 Government initiatives promoting sustainable transportation options and reducing carbon emissions. |
4.2.3 Growing smartphone penetration and tech-savvy population embracing digital platforms for transportation services. |
4.3 Market Restraints |
4.3.1 Lack of robust infrastructure and regulatory framework supporting the development of mobility-as-a-service solutions. |
4.3.2 Concerns regarding data privacy and cybersecurity hindering the adoption of digital mobility platforms. |
4.3.3 Competition from traditional transportation modes and existing ride-hailing services impacting market penetration. |
5 Thailand Mobility-as-a-service Market Trends |
6 Thailand Mobility-as-a-service Market, By Types |
6.1 Thailand Mobility-as-a-service Market, By Solution Type |
6.1.1 Overview and Analysis |
6.1.2 Thailand Mobility-as-a-service Market Revenues & Volume, By Solution Type, 2022-2032F |
6.1.3 Thailand Mobility-as-a-service Market Revenues & Volume, By Technology Platform, 2022-2032F |
6.1.4 Thailand Mobility-as-a-service Market Revenues & Volume, By Insurance Services, 2022-2032F |
6.1.5 Thailand Mobility-as-a-service Market Revenues & Volume, By Telecom Connectivity Providers, 2022-2032F |
6.1.6 Thailand Mobility-as-a-service Market Revenues & Volume, By Payment Engines, 2022-2032F |
6.1.7 Thailand Mobility-as-a-service Market Revenues & Volume, By Ticketing Solutions, 2022-2032F |
6.1.8 Thailand Mobility-as-a-service Market Revenues & Volume, By Navigation Solutions, 2022-2032F |
6.2 Thailand Mobility-as-a-service Market, By Service Type |
6.2.1 Overview and Analysis |
6.2.2 Thailand Mobility-as-a-service Market Revenues & Volume, By Ride Hailing, 2022-2032F |
6.2.3 Thailand Mobility-as-a-service Market Revenues & Volume, By Car Sharing, 2022-2032F |
6.2.4 Thailand Mobility-as-a-service Market Revenues & Volume, By Micromobility, 2022-2032F |
6.2.5 Thailand Mobility-as-a-service Market Revenues & Volume, By Bus Sharing, 2022-2032F |
6.2.6 Thailand Mobility-as-a-service Market Revenues & Volume, By Train Services, 2022-2032F |
6.3 Thailand Mobility-as-a-service Market, By Transportation Type |
6.3.1 Overview and Analysis |
6.3.2 Thailand Mobility-as-a-service Market Revenues & Volume, By Public, 2022-2032F |
6.3.3 Thailand Mobility-as-a-service Market Revenues & Volume, By Private , 2022-2032F |
6.4 Thailand Mobility-as-a-service Market, By Vehicle Type |
6.4.1 Overview and Analysis |
6.4.2 Thailand Mobility-as-a-service Market Revenues & Volume, By Micro mobility, 2022-2032F |
6.4.3 Thailand Mobility-as-a-service Market Revenues & Volume, By Trains, 2022-2032F |
6.4.4 Thailand Mobility-as-a-service Market Revenues & Volume, By Buses, 2022-2032F |
6.4.5 Thailand Mobility-as-a-service Market Revenues & Volume, By Four-wheelers, 2022-2032F |
6.5 Thailand Mobility-as-a-service Market, By Application Type |
6.5.1 Overview and Analysis |
6.5.2 Thailand Mobility-as-a-service Market Revenues & Volume, By Personalized Application Services, 2022-2032F |
6.5.3 Thailand Mobility-as-a-service Market Revenues & Volume, By Journey Management, 2022-2032F |
6.5.4 Thailand Mobility-as-a-service Market Revenues & Volume, By Journey Planning, 2022-2032F |
6.5.5 Thailand Mobility-as-a-service Market Revenues & Volume, By Flexible Payments and Transactions, 2022-2032F |
6.6 Thailand Mobility-as-a-service Market, By Operating System |
6.6.1 Overview and Analysis |
6.6.2 Thailand Mobility-as-a-service Market Revenues & Volume, By Android, 2022-2032F |
6.6.3 Thailand Mobility-as-a-service Market Revenues & Volume, By iOS, 2022-2032F |
6.6.4 Thailand Mobility-as-a-service Market Revenues & Volume, By Others, 2022-2032F |
7 Thailand Mobility-as-a-service Market Import-Export Trade Statistics |
7.1 Thailand Mobility-as-a-service Market Export to Major Countries |
7.2 Thailand Mobility-as-a-service Market Imports from Major Countries |
8 Thailand Mobility-as-a-service Market Key Performance Indicators |
8.1 Average daily active users on mobility-as-a-service platforms. |
8.2 Percentage of revenue derived from subscription-based services. |
8.3 Customer retention rate for users utilizing multiple modes of transportation within the platform. |
8.4 Average time spent per user on the mobility-as-a-service platform. |
8.5 Number of partnerships with local transportation authorities for seamless integration of services. |
9 Thailand Mobility-as-a-service Market - Opportunity Assessment |
9.1 Thailand Mobility-as-a-service Market Opportunity Assessment, By Solution Type, 2022 & 2032F |
9.2 Thailand Mobility-as-a-service Market Opportunity Assessment, By Service Type, 2022 & 2032F |
9.3 Thailand Mobility-as-a-service Market Opportunity Assessment, By Transportation Type, 2022 & 2032F |
9.4 Thailand Mobility-as-a-service Market Opportunity Assessment, By Vehicle Type, 2022 & 2032F |
9.5 Thailand Mobility-as-a-service Market Opportunity Assessment, By Application Type, 2022 & 2032F |
9.6 Thailand Mobility-as-a-service Market Opportunity Assessment, By Operating System, 2022 & 2032F |
10 Thailand Mobility-as-a-service Market - Competitive Landscape |
10.1 Thailand Mobility-as-a-service Market Revenue Share, By Companies, 2025 |
10.2 Thailand Mobility-as-a-service Market Competitive Benchmarking, By Operating and Technical Parameters |
11 Company Profiles |
12 Recommendations |
13 Disclaimer |
Global Go To Market Strategy - 2030
Export potential enables firms to identify high-growth global markets with greater confidence by combining advanced trade intelligence with a structured quantitative methodology. The framework analyzes emerging demand trends and country-level import patterns while integrating macroeconomic and trade datasets such as GDP and population forecasts, bilateral import–export flows, tariff structures, elasticity differentials between developed and developing economies, geographic distance, and import demand projections. Using weighted trade values from 2020–2024 as the base period to project country-to-country export potential for 2030, these inputs are operationalized through calculated drivers such as gravity model parameters, tariff impact factors, and projected GDP per-capita growth. Through an analysis of hidden potentials, demand hotspots, and market conditions that are most favorable to success, this method enables firms to focus on target countries, maximize returns, and global expansion with data, backed by accuracy.
By factoring in the projected importer demand gap that is currently unmet and could be potential opportunity, it identifies the potential for the Exporter (Country) among 190 countries, against the general trade analysis, which identifies the biggest importer or exporter.
To discover high-growth global markets and optimize your business strategy:
Click Here
Pricing
- Single User License$ 1,995
- Department License$ 2,400
- Site License$ 3,120
- Global License$ 3,795

Leadership Perspectives from Industry Events
Search
Thought Leadership and Analyst Meet


Our Clients
6WResearch In News
- India Air Conditioner Market Set for Strong Rebound in 2026 After Weather-Led Correction and GST-Driven Recovery: 6Wresearch
- ADAS in India: How Automatic Emergency Braking, Blind Spot Detection & Driver Monitoring are Transforming Road Safety
- Doha a strategic location for EV manufacturing hub: IPA Qatar
- Demand for luxury TVs surging in the GCC, says Samsung
- Empowering Growth: The Thriving Journey of Bangladesh’s Cable Industry
- Demand for luxury TVs surging in the GCC, says Samsung
Latest Reports
- Poland Fire Protection Systems Market (2026-2032)
- Cape Verde Portable Hand-Thrown Extinguisher Market (2026-2032)
- Canada Portable Hand-Thrown Extinguisher Market (2026-2032)
- Cameroon Portable Hand-Thrown Extinguisher Market (2026-2032)
- Burundi Portable Hand-Thrown Extinguisher Market (2026-2032)
- Burkina Faso Portable Hand-Thrown Extinguisher Market (2026-2032)
- Bulgaria Portable Hand-Thrown Extinguisher Market (2026-2032)
- Brunei Portable Hand-Thrown Extinguisher Market (2026-2032)
- Botswana Portable Hand-Thrown Extinguisher Market (2026-2032)
- Bosnia and Herzegovina Portable Hand-Thrown Extinguisher Market (2026-2032)
Industry Events and Analyst Meet

HIMTEX 2026

India Refining Summit 2026

India EV Show 2026

EV tech India Expo 2026

Auto Tech Asia 2026
Whitepaper
- Middle East & Africa Commercial Security Market Click here to view more.
- Middle East & Africa Fire Safety Systems & Equipment Market Click here to view more.
- GCC Drone Market Click here to view more.
- Middle East Lighting Fixture Market Click here to view more.
- GCC Physical & Perimeter Security Market Click here to view more.