Thailand Pea Processed Ingredients Market (2026-2032) Outlook | Share, Value, Size, Analysis, Companies, Forecast, Industry, Growth, Revenue & Trends
Market Forecast By Type (Protein, Starch, Flour, Fiber), By Application (Food, Meat & Meat Substitutes, Performance Nutrition, Functional Foods, Snacks, Bakery, Confectionery, Others), By Source (Yellow Split Peas, Chickpeas, Lentils) And Competitive Landscape
| Product Code: ETC223525 | Publication Date: Aug 2022 | Updated Date: Mar 2026 | Product Type: Market Research Report | |
| Publisher: 6Wresearch | Author: Ravi Bhandari | No. of Pages: 75 | No. of Figures: 35 | No. of Tables: 20 |
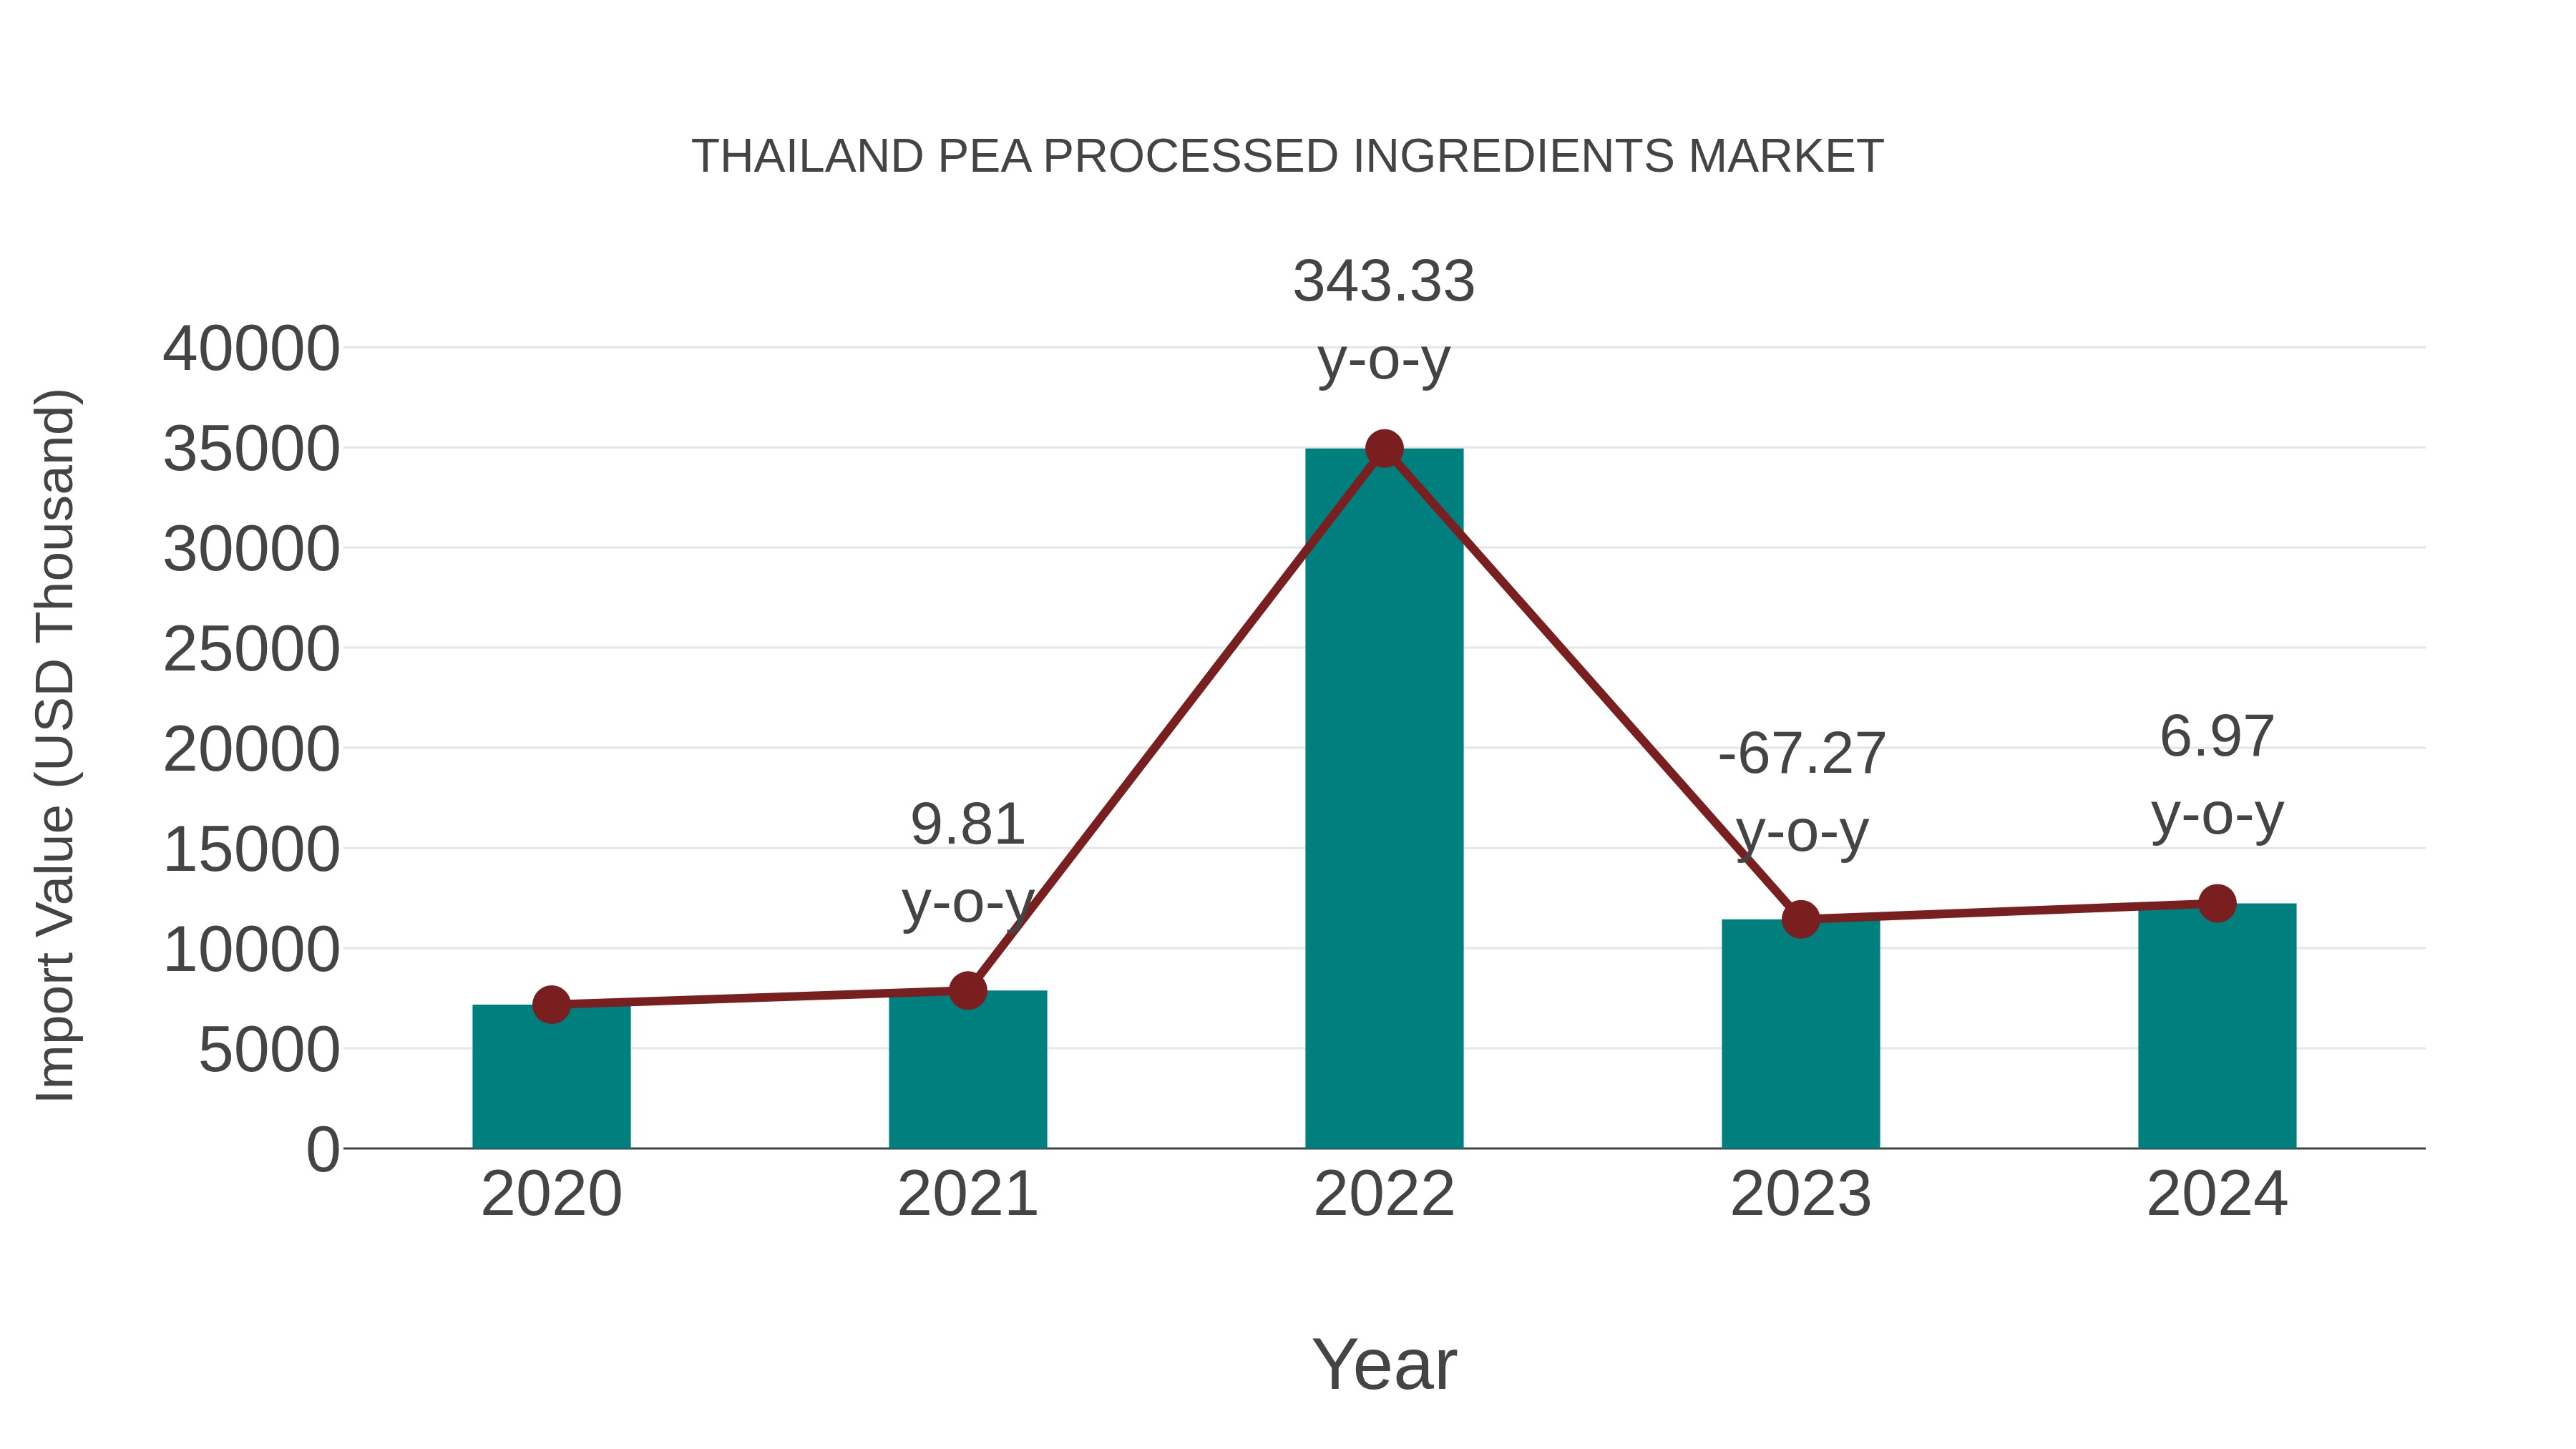
Thailand Pea Processed Ingredients Market: Import Trend Analysis
In the Thailand pea processed ingredients market, the import trend showed a growth rate of 6.97% from 2023 to 2024, with a Compound Annual Growth Rate (CAGR) of 14.26% for the period 2020-2024. This increase can be attributed to a steady demand shift towards processed pea ingredients, indicating market stability and sustained import momentum during this period.
Thailand Pea Processed Ingredients Market Synopsis
The Thailand Pea Processed Ingredients Market is a growing segment within the food processing industry. Pea-based ingredients, such as pea protein and pea starch, are gaining popularity due to their nutritional value and suitability for various food applications, including plant-based meat alternatives and gluten-free products. The market is witnessing increased investment and innovation as manufacturers respond to the demand for healthier and sustainable food ingredients.
Drivers of the Market
The Thailand Pea Processed Ingredients Market has been witnessing significant growth in recent years. One of the key drivers behind this growth is the increasing consumer demand for healthy and plant-based food products. Peas are rich in protein, fiber, and essential nutrients, making them a popular choice among health-conscious consumers. As a result, food manufacturers are incorporating pea-based ingredients into a wide range of products, including snacks, protein bars, and meat alternatives. Additionally, the growing trend of vegetarian and vegan diets has boosted the demand for pea-based processed ingredients as they serve as a valuable source of plant-based protein. Furthermore, government initiatives promoting sustainable agriculture and the production of leguminous crops like peas have also contributed to the expansion of the pea processed ingredients market in Thailand.
Challenges of the Market
Challenges in this market include maintaining a consistent supply of peas, processing challenges, and competition from alternative protein sources. Meeting quality and sustainability standards is crucial.
COVID-19 Impact on the Market
The Pea Processed Ingredients market in Thailand witnessed mixed impacts. While demand for processed pea ingredients used in plant-based products increased as consumers focused on health and sustainability, disruptions in the supply chain posed challenges. Manufacturers in this sector adjusted by exploring local sourcing options and investing in R&D for new pea-based products.
Key Players in the Market
In the Thailand Pea Processed Ingredients market, GreenHarvest Ingredients Co., Ltd. has emerged as a leading player. They specialize in processing peas into various value-added products such as pea protein and pea starch. With a focus on sustainable sourcing and state-of-the-art processing technology, they cater to both domestic and international markets. Another significant player is ThaiPea Foods Co., Ltd., known for its diverse pea-based ingredient portfolio and commitment to meeting the growing demand for plant-based alternatives.
Key Highlights of the Report:
- Thailand Pea Processed Ingredients Market Outlook
- Market Size of Thailand Pea Processed Ingredients Market, 2025
- Forecast of Thailand Pea Processed Ingredients Market, 2032
- Historical Data and Forecast of Thailand Pea Processed Ingredients Revenues & Volume for the Period 2022-2032F
- Thailand Pea Processed Ingredients Market Trend Evolution
- Thailand Pea Processed Ingredients Market Drivers and Challenges
- Thailand Pea Processed Ingredients Price Trends
- Thailand Pea Processed Ingredients Porter's Five Forces
- Thailand Pea Processed Ingredients Industry Life Cycle
- Historical Data and Forecast of Thailand Pea Processed Ingredients Market Revenues & Volume By Type for the Period 2022-2032F
- Historical Data and Forecast of Thailand Pea Processed Ingredients Market Revenues & Volume By Protein for the Period 2022-2032F
- Historical Data and Forecast of Thailand Pea Processed Ingredients Market Revenues & Volume By Starch for the Period 2022-2032F
- Historical Data and Forecast of Thailand Pea Processed Ingredients Market Revenues & Volume By Flour for the Period 2022-2032F
- Historical Data and Forecast of Thailand Pea Processed Ingredients Market Revenues & Volume By Fiber for the Period 2022-2032F
- Historical Data and Forecast of Thailand Pea Processed Ingredients Market Revenues & Volume By Application for the Period 2022-2032F
- Historical Data and Forecast of Thailand Pea Processed Ingredients Market Revenues & Volume By Food for the Period 2022-2032F
- Historical Data and Forecast of Thailand Pea Processed Ingredients Market Revenues & Volume By Meat & Meat Substitutes for the Period 2022-2032F
- Historical Data and Forecast of Thailand Pea Processed Ingredients Market Revenues & Volume By Performance Nutrition for the Period 2022-2032F
- Historical Data and Forecast of Thailand Pea Processed Ingredients Market Revenues & Volume By Functional Foods for the Period 2022-2032F
- Historical Data and Forecast of Thailand Pea Processed Ingredients Market Revenues & Volume By Snacks for the Period 2022-2032F
- Historical Data and Forecast of Thailand Pea Processed Ingredients Market Revenues & Volume By Bakery for the Period 2022-2032F
- Historical Data and Forecast of Thailand Pea Processed Ingredients Market Revenues & Volume By Confectionery for the Period 2022-2032F
- Historical Data and Forecast of Thailand Pea Processed Ingredients Market Revenues & Volume By Others for the Period 2022-2032F
- Historical Data and Forecast of Thailand Pea Processed Ingredients Market Revenues & Volume By Source for the Period 2022-2032F
- Historical Data and Forecast of Thailand Pea Processed Ingredients Market Revenues & Volume By Yellow Split Peas for the Period 2022-2032F
- Historical Data and Forecast of Thailand Pea Processed Ingredients Market Revenues & Volume By Chickpeas for the Period 2022-2032F
- Historical Data and Forecast of Thailand Pea Processed Ingredients Market Revenues & Volume By Lentils for the Period 2022-2032F
- Thailand Pea Processed Ingredients Import Export Trade Statistics
- Market Opportunity Assessment By Type
- Market Opportunity Assessment By Application
- Market Opportunity Assessment By Source
- Thailand Pea Processed Ingredients Top Companies Market Share
- Thailand Pea Processed Ingredients Competitive Benchmarking By Technical and Operational Parameters
- Thailand Pea Processed Ingredients Company Profiles
- Thailand Pea Processed Ingredients Key Strategic Recommendations
Thailand Pea Processed Ingredients Market (2026-2032): FAQs
6Wresearch actively monitors the Thailand Pea Processed Ingredients Market and publishes its comprehensive annual report, highlighting emerging trends, growth drivers, revenue analysis, and forecast outlook. Our insights help businesses to make data-backed strategic decisions with ongoing market dynamics. Our analysts track relevent industries related to the Thailand Pea Processed Ingredients Market, allowing our clients with actionable intelligence and reliable forecasts tailored to emerging regional needs.
Yes, we provide customisation as per your requirements. To learn more, feel free to contact us on sales@6wresearch.com
1 Executive Summary |
2 Introduction |
2.1 Key Highlights of the Report |
2.2 Report Description |
2.3 Market Scope & Segmentation |
2.4 Research Methodology |
2.5 Assumptions |
3 Thailand Pea Processed Ingredients Market Overview |
3.1 Thailand Country Macro Economic Indicators |
3.2 Thailand Pea Processed Ingredients Market Revenues & Volume, 2022 & 2032F |
3.3 Thailand Pea Processed Ingredients Market - Industry Life Cycle |
3.4 Thailand Pea Processed Ingredients Market - Porter's Five Forces |
3.5 Thailand Pea Processed Ingredients Market Revenues & Volume Share, By Type, 2022 & 2032F |
3.6 Thailand Pea Processed Ingredients Market Revenues & Volume Share, By Application, 2022 & 2032F |
3.7 Thailand Pea Processed Ingredients Market Revenues & Volume Share, By Source, 2022 & 2032F |
4 Thailand Pea Processed Ingredients Market Dynamics |
4.1 Impact Analysis |
4.2 Market Drivers |
4.2.1 Growing consumer preference for plant-based protein sources |
4.2.2 Increasing awareness about the health benefits of pea protein |
4.2.3 Rise in demand for clean-label and natural ingredients in food products |
4.3 Market Restraints |
4.3.1 Price volatility of raw materials |
4.3.2 Intense competition from other plant-based protein sources |
4.3.3 Regulatory challenges related to labeling and claims |
5 Thailand Pea Processed Ingredients Market Trends |
6 Thailand Pea Processed Ingredients Market, By Types |
6.1 Thailand Pea Processed Ingredients Market, By Type |
6.1.1 Overview and Analysis |
6.1.2 Thailand Pea Processed Ingredients Market Revenues & Volume, By Type, 2022-2032F |
6.1.3 Thailand Pea Processed Ingredients Market Revenues & Volume, By Protein, 2022-2032F |
6.1.4 Thailand Pea Processed Ingredients Market Revenues & Volume, By Starch, 2022-2032F |
6.1.5 Thailand Pea Processed Ingredients Market Revenues & Volume, By Flour, 2022-2032F |
6.1.6 Thailand Pea Processed Ingredients Market Revenues & Volume, By Fiber, 2022-2032F |
6.2 Thailand Pea Processed Ingredients Market, By Application |
6.2.1 Overview and Analysis |
6.2.2 Thailand Pea Processed Ingredients Market Revenues & Volume, By Food, 2022-2032F |
6.2.3 Thailand Pea Processed Ingredients Market Revenues & Volume, By Meat & Meat Substitutes, 2022-2032F |
6.2.4 Thailand Pea Processed Ingredients Market Revenues & Volume, By Performance Nutrition, 2022-2032F |
6.2.5 Thailand Pea Processed Ingredients Market Revenues & Volume, By Functional Foods, 2022-2032F |
6.2.6 Thailand Pea Processed Ingredients Market Revenues & Volume, By Snacks, 2022-2032F |
6.2.7 Thailand Pea Processed Ingredients Market Revenues & Volume, By Bakery, 2022-2032F |
6.2.8 Thailand Pea Processed Ingredients Market Revenues & Volume, By Others, 2022-2032F |
6.2.9 Thailand Pea Processed Ingredients Market Revenues & Volume, By Others, 2022-2032F |
6.3 Thailand Pea Processed Ingredients Market, By Source |
6.3.1 Overview and Analysis |
6.3.2 Thailand Pea Processed Ingredients Market Revenues & Volume, By Yellow Split Peas, 2022-2032F |
6.3.3 Thailand Pea Processed Ingredients Market Revenues & Volume, By Chickpeas, 2022-2032F |
6.3.4 Thailand Pea Processed Ingredients Market Revenues & Volume, By Lentils, 2022-2032F |
7 Thailand Pea Processed Ingredients Market Import-Export Trade Statistics |
7.1 Thailand Pea Processed Ingredients Market Export to Major Countries |
7.2 Thailand Pea Processed Ingredients Market Imports from Major Countries |
8 Thailand Pea Processed Ingredients Market Key Performance Indicators |
8.1 Percentage of food products in Thailand incorporating pea processed ingredients |
8.2 Number of new product launches containing pea protein |
8.3 Growth in investments in research and development for pea processed ingredients |
9 Thailand Pea Processed Ingredients Market - Opportunity Assessment |
9.1 Thailand Pea Processed Ingredients Market Opportunity Assessment, By Type, 2022 & 2032F |
9.2 Thailand Pea Processed Ingredients Market Opportunity Assessment, By Application, 2022 & 2032F |
9.3 Thailand Pea Processed Ingredients Market Opportunity Assessment, By Source, 2022 & 2032F |
10 Thailand Pea Processed Ingredients Market - Competitive Landscape |
10.1 Thailand Pea Processed Ingredients Market Revenue Share, By Companies, 2025 |
10.2 Thailand Pea Processed Ingredients Market Competitive Benchmarking, By Operating and Technical Parameters |
11 Company Profiles |
12 Recommendations |
13 Disclaimer |
Global Go To Market Strategy - 2030
Export potential enables firms to identify high-growth global markets with greater confidence by combining advanced trade intelligence with a structured quantitative methodology. The framework analyzes emerging demand trends and country-level import patterns while integrating macroeconomic and trade datasets such as GDP and population forecasts, bilateral import–export flows, tariff structures, elasticity differentials between developed and developing economies, geographic distance, and import demand projections. Using weighted trade values from 2020–2024 as the base period to project country-to-country export potential for 2030, these inputs are operationalized through calculated drivers such as gravity model parameters, tariff impact factors, and projected GDP per-capita growth. Through an analysis of hidden potentials, demand hotspots, and market conditions that are most favorable to success, this method enables firms to focus on target countries, maximize returns, and global expansion with data, backed by accuracy.
By factoring in the projected importer demand gap that is currently unmet and could be potential opportunity, it identifies the potential for the Exporter (Country) among 190 countries, against the general trade analysis, which identifies the biggest importer or exporter.
To discover high-growth global markets and optimize your business strategy:
Click Here
Pricing
- Single User License$ 1,995
- Department License$ 2,400
- Site License$ 3,120
- Global License$ 3,795

Leadership Perspectives from Industry Events
Search
Thought Leadership and Analyst Meet


Our Clients
6WResearch In News
- India Air Conditioner Market Set for Strong Rebound in 2026 After Weather-Led Correction and GST-Driven Recovery: 6Wresearch
- ADAS in India: How Automatic Emergency Braking, Blind Spot Detection & Driver Monitoring are Transforming Road Safety
- Doha a strategic location for EV manufacturing hub: IPA Qatar
- Demand for luxury TVs surging in the GCC, says Samsung
- Empowering Growth: The Thriving Journey of Bangladesh’s Cable Industry
- Demand for luxury TVs surging in the GCC, says Samsung
Latest Reports
- Poland Fire Protection Systems Market (2026-2032)
- Cape Verde Portable Hand-Thrown Extinguisher Market (2026-2032)
- Canada Portable Hand-Thrown Extinguisher Market (2026-2032)
- Cameroon Portable Hand-Thrown Extinguisher Market (2026-2032)
- Burundi Portable Hand-Thrown Extinguisher Market (2026-2032)
- Burkina Faso Portable Hand-Thrown Extinguisher Market (2026-2032)
- Bulgaria Portable Hand-Thrown Extinguisher Market (2026-2032)
- Brunei Portable Hand-Thrown Extinguisher Market (2026-2032)
- Botswana Portable Hand-Thrown Extinguisher Market (2026-2032)
- Bosnia and Herzegovina Portable Hand-Thrown Extinguisher Market (2026-2032)
Industry Events and Analyst Meet

HIMTEX 2026

India Refining Summit 2026

India EV Show 2026

EV tech India Expo 2026

Auto Tech Asia 2026
Whitepaper
- Middle East & Africa Commercial Security Market Click here to view more.
- Middle East & Africa Fire Safety Systems & Equipment Market Click here to view more.
- GCC Drone Market Click here to view more.
- Middle East Lighting Fixture Market Click here to view more.
- GCC Physical & Perimeter Security Market Click here to view more.