Togo Refrigerated Truck Market (2026-2032) | Growth, Size, Pricing Analysis, Demand, Revenue, Challenges, Consumer Insights, Competitive, Segmentation, Forecast, Opportunities, Trends, Drivers, Outlook, Restraints, Value, Investment Trends, Industry, Companies, Share, Strategic Insights, Supply, Analysis, Segments, Strategy, Competition
Market Forecast By Type (Light-Duty Trucks, Medium-Duty Trucks, Heavy-Duty Trucks, Electric Refrigerated Trucks, Hybrid Refrigerated Trucks), By Vehicle Class (Class 1-3, Class 4-6, Class 7-8, EVs, Hybrid), By Refrigerant Type (R-134a, CO2, Ammonia, HFOs, Hydrocarbons), By Application (Fresh Produce, Frozen Foods, Meat & Dairy, Pharmaceuticals, E-commerce) And Competitive Landscape
| Product Code: ETC10411824 | Publication Date: Apr 2025 | Updated Date: Apr 2026 | Product Type: Market Research Report | |
| Publisher: 6Wresearch | Author: Bhawna Singh | No. of Pages: 65 | No. of Figures: 34 | No. of Tables: 19 |
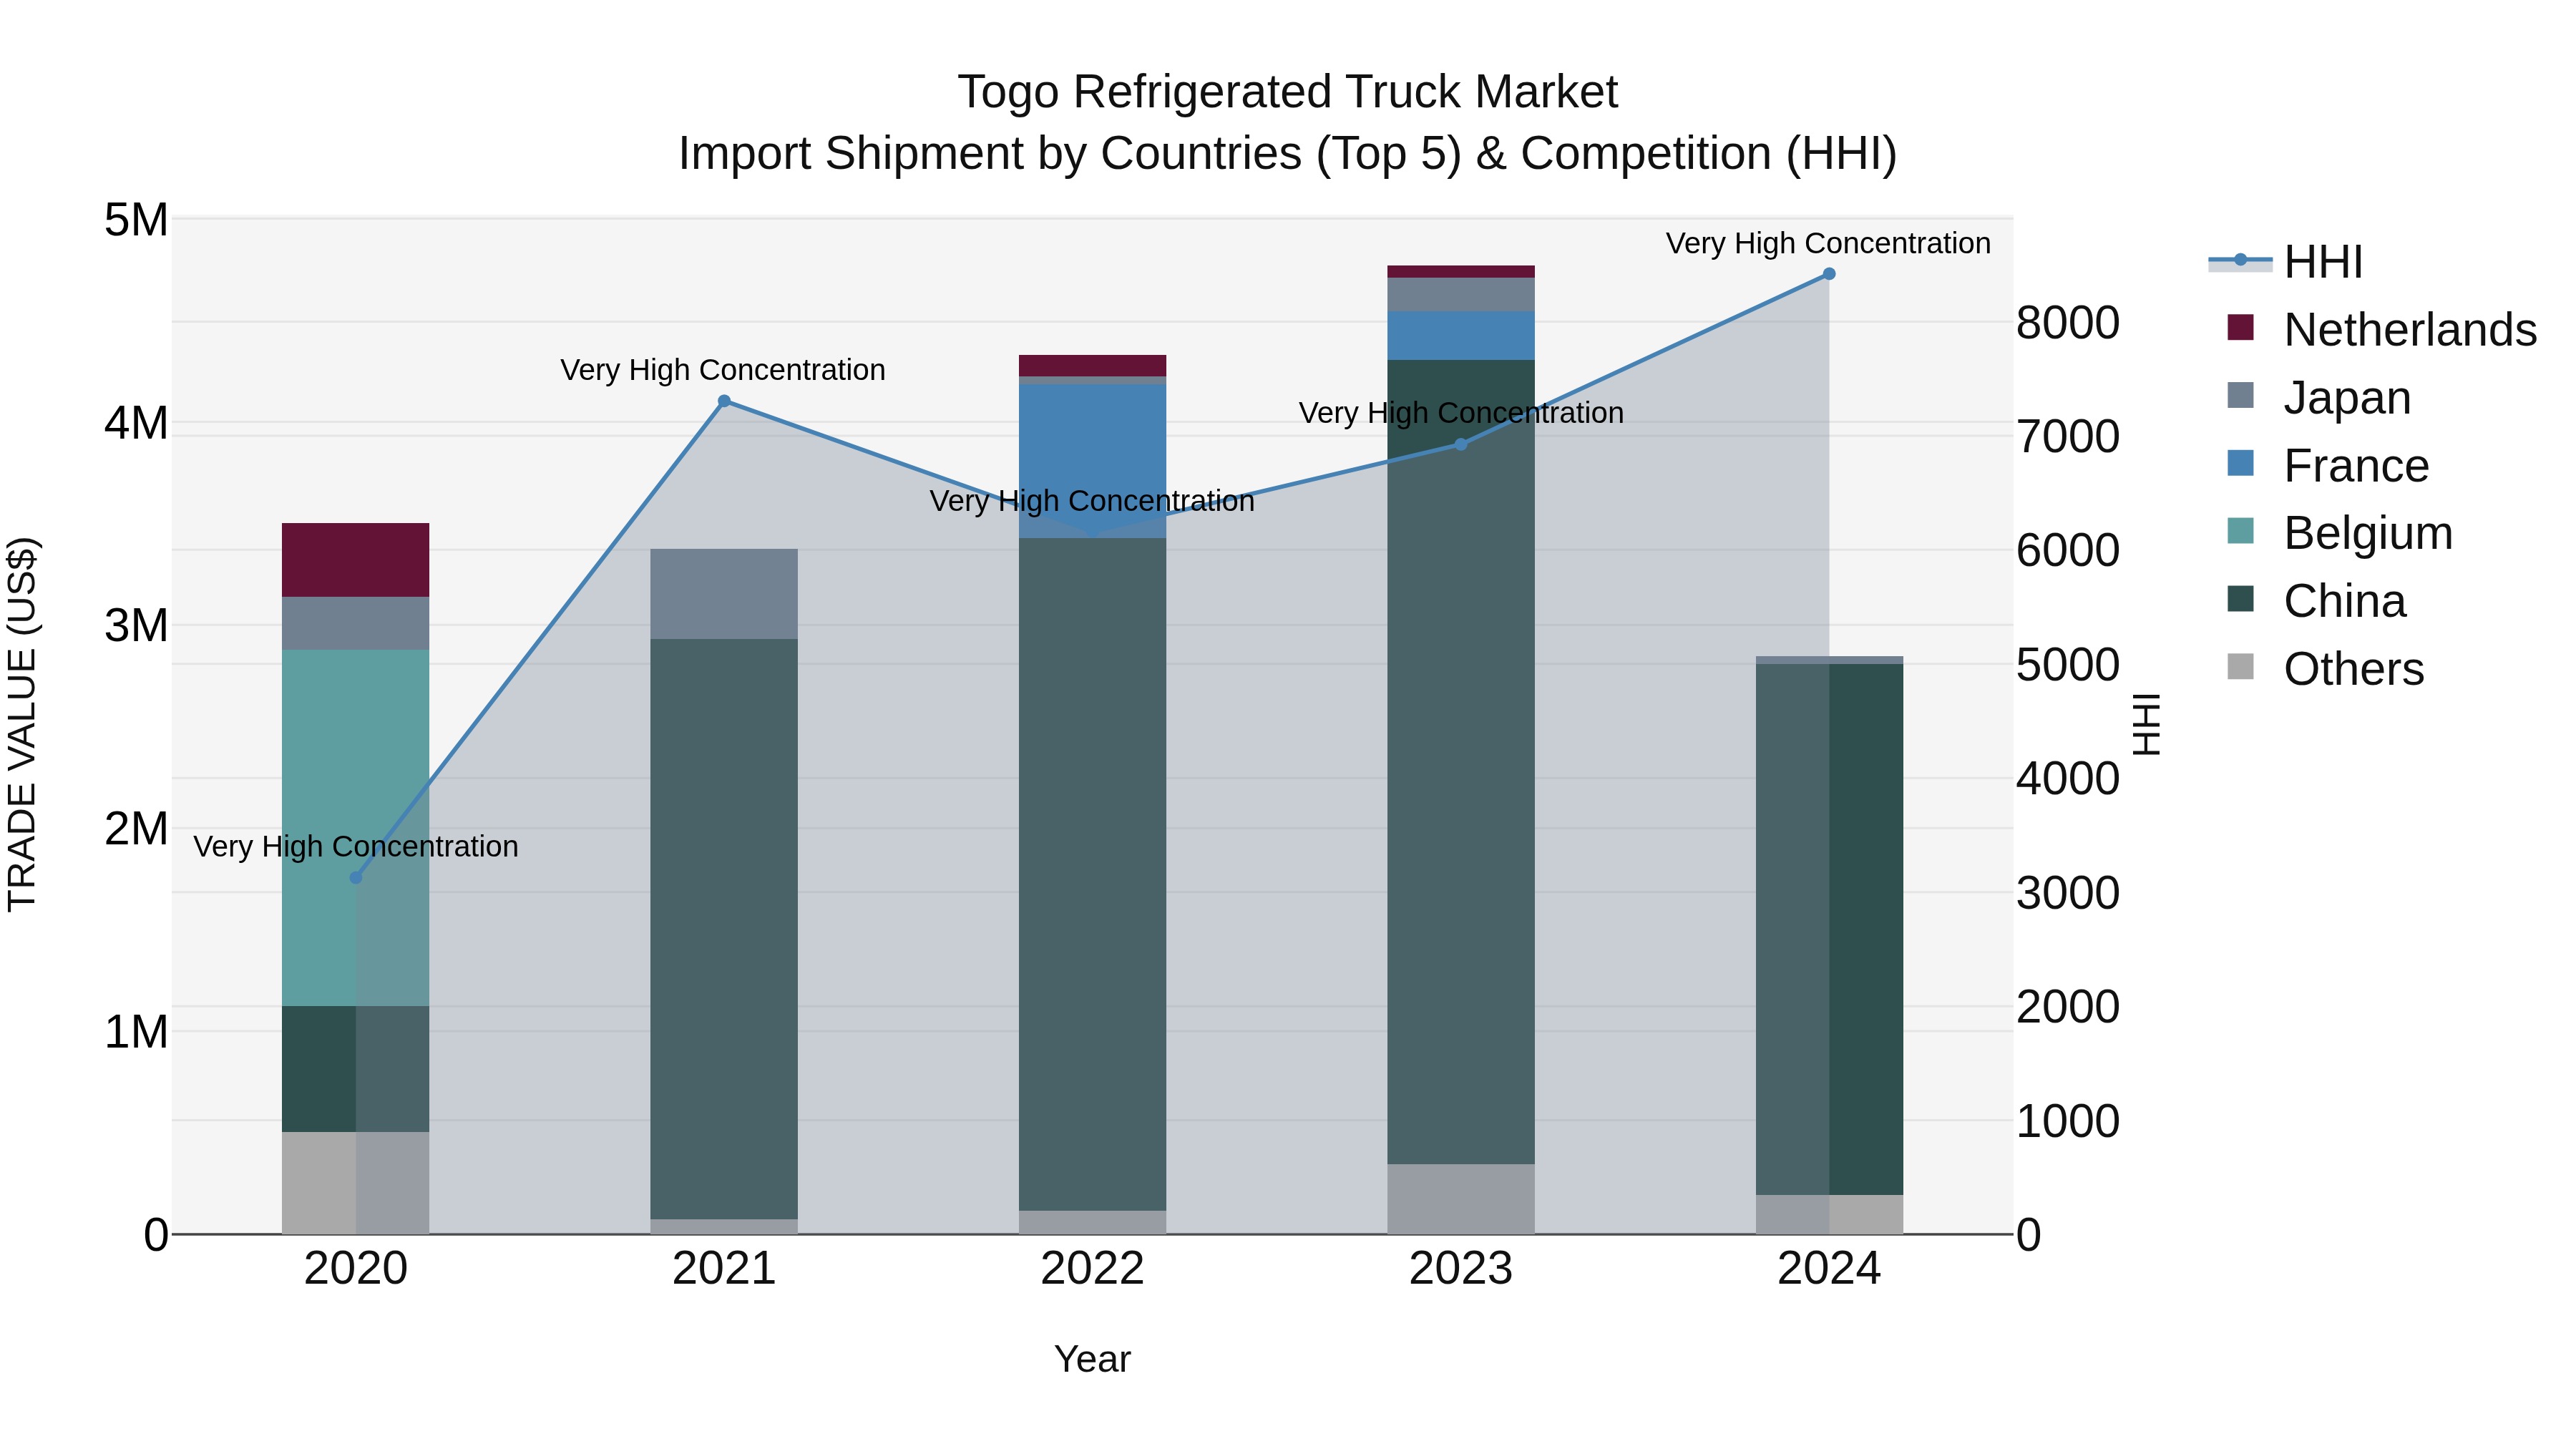
Togo Refrigerated Truck Market Top 5 Importing Countries and Market Competition (HHI) Analysis
Togo`s refrigerated truck import market in 2024 saw significant imports from major players such as China, India, USA, Japan, and South Korea. Despite a high concentration with a high Herfindahl-Hirschman Index (HHI), the market experienced a sharp decline with a Compound Annual Growth Rate (CAGR) of -5.05% from 2020 to 2024. The growth rate plummeted by -40.35% from 2023 to 2024, indicating a challenging year for refrigerated truck imports in Togo. Analyzing these trends can provide valuable insights for stakeholders in the industry.
Key Highlights of the Report:
- Togo Refrigerated Truck Market Outlook
- Market Size of Togo Refrigerated Truck Market, 2025
- Forecast of Togo Refrigerated Truck Market, 2032
- Historical Data and Forecast of Togo Refrigerated Truck Revenues & Volume for the Period 2022 - 2032F
- Togo Refrigerated Truck Market Trend Evolution
- Togo Refrigerated Truck Market Drivers and Challenges
- Togo Refrigerated Truck Price Trends
- Togo Refrigerated Truck Porter's Five Forces
- Togo Refrigerated Truck Industry Life Cycle
- Historical Data and Forecast of Togo Refrigerated Truck Market Revenues & Volume By Type for the Period 2022 - 2032F
- Historical Data and Forecast of Togo Refrigerated Truck Market Revenues & Volume By Light-Duty Trucks for the Period 2022 - 2032F
- Historical Data and Forecast of Togo Refrigerated Truck Market Revenues & Volume By Medium-Duty Trucks for the Period 2022 - 2032F
- Historical Data and Forecast of Togo Refrigerated Truck Market Revenues & Volume By Heavy-Duty Trucks for the Period 2022 - 2032F
- Historical Data and Forecast of Togo Refrigerated Truck Market Revenues & Volume By Electric Refrigerated Trucks for the Period 2022 - 2032F
- Historical Data and Forecast of Togo Refrigerated Truck Market Revenues & Volume By Hybrid Refrigerated Trucks for the Period 2022 - 2032F
- Historical Data and Forecast of Togo Refrigerated Truck Market Revenues & Volume By Vehicle Class for the Period 2022 - 2032F
- Historical Data and Forecast of Togo Refrigerated Truck Market Revenues & Volume By Class 1-3 for the Period 2022 - 2032F
- Historical Data and Forecast of Togo Refrigerated Truck Market Revenues & Volume By Class 4-6 for the Period 2022 - 2032F
- Historical Data and Forecast of Togo Refrigerated Truck Market Revenues & Volume By Class 7-8 for the Period 2022 - 2032F
- Historical Data and Forecast of Togo Refrigerated Truck Market Revenues & Volume By EVs for the Period 2022 - 2032F
- Historical Data and Forecast of Togo Refrigerated Truck Market Revenues & Volume By Hybrid for the Period 2022 - 2032F
- Historical Data and Forecast of Togo Refrigerated Truck Market Revenues & Volume By Refrigerant Type for the Period 2022 - 2032F
- Historical Data and Forecast of Togo Refrigerated Truck Market Revenues & Volume By R-134a for the Period 2022 - 2032F
- Historical Data and Forecast of Togo Refrigerated Truck Market Revenues & Volume By CO2 for the Period 2022 - 2032F
- Historical Data and Forecast of Togo Refrigerated Truck Market Revenues & Volume By Ammonia for the Period 2022 - 2032F
- Historical Data and Forecast of Togo Refrigerated Truck Market Revenues & Volume By HFOs for the Period 2022 - 2032F
- Historical Data and Forecast of Togo Refrigerated Truck Market Revenues & Volume By Hydrocarbons for the Period 2022 - 2032F
- Historical Data and Forecast of Togo Refrigerated Truck Market Revenues & Volume By Application for the Period 2022 - 2032F
- Historical Data and Forecast of Togo Refrigerated Truck Market Revenues & Volume By Fresh Produce for the Period 2022 - 2032F
- Historical Data and Forecast of Togo Refrigerated Truck Market Revenues & Volume By Frozen Foods for the Period 2022 - 2032F
- Historical Data and Forecast of Togo Refrigerated Truck Market Revenues & Volume By Meat & Dairy for the Period 2022 - 2032F
- Historical Data and Forecast of Togo Refrigerated Truck Market Revenues & Volume By Pharmaceuticals for the Period 2022 - 2032F
- Historical Data and Forecast of Togo Refrigerated Truck Market Revenues & Volume By E-commerce for the Period 2022 - 2032F
- Togo Refrigerated Truck Import Export Trade Statistics
- Market Opportunity Assessment By Type
- Market Opportunity Assessment By Vehicle Class
- Market Opportunity Assessment By Refrigerant Type
- Market Opportunity Assessment By Application
- Togo Refrigerated Truck Top Companies Market Share
- Togo Refrigerated Truck Competitive Benchmarking By Technical and Operational Parameters
- Togo Refrigerated Truck Company Profiles
- Togo Refrigerated Truck Key Strategic Recommendations
Frequently Asked Questions About the Market Study (FAQs):
6Wresearch actively monitors the Togo Refrigerated Truck Market and publishes its comprehensive annual report, highlighting emerging trends, growth drivers, revenue analysis, and forecast outlook. Our insights help businesses to make data-backed strategic decisions with ongoing market dynamics. Our analysts track relevent industries related to the Togo Refrigerated Truck Market, allowing our clients with actionable intelligence and reliable forecasts tailored to emerging regional needs.
Yes, we provide customisation as per your requirements. To learn more, feel free to contact us on sales@6wresearch.com
1 Executive Summary |
2 Introduction |
2.1 Key Highlights of the Report |
2.2 Report Description |
2.3 Market Scope & Segmentation |
2.4 Research Methodology |
2.5 Assumptions |
3 Togo Refrigerated Truck Market Overview |
3.1 Togo Country Macro Economic Indicators |
3.2 Togo Refrigerated Truck Market Revenues & Volume, 2022 & 2032F |
3.3 Togo Refrigerated Truck Market - Industry Life Cycle |
3.4 Togo Refrigerated Truck Market - Porter's Five Forces |
3.5 Togo Refrigerated Truck Market Revenues & Volume Share, By Type, 2022 & 2032F |
3.6 Togo Refrigerated Truck Market Revenues & Volume Share, By Vehicle Class, 2022 & 2032F |
3.7 Togo Refrigerated Truck Market Revenues & Volume Share, By Refrigerant Type, 2022 & 2032F |
3.8 Togo Refrigerated Truck Market Revenues & Volume Share, By Application, 2022 & 2032F |
4 Togo Refrigerated Truck Market Dynamics |
4.1 Impact Analysis |
4.2 Market Drivers |
4.2.1 Growth in the food and beverage industry leading to increased demand for refrigerated transportation. |
4.2.2 Expansion of pharmaceutical and healthcare sectors requiring temperature-controlled logistics. |
4.2.3 Government regulations promoting the use of refrigerated trucks for perishable goods transportation. |
4.3 Market Restraints |
4.3.1 High initial investment costs associated with purchasing and maintaining refrigerated trucks. |
4.3.2 Limited infrastructure and cold chain facilities in certain regions impacting the deployment of refrigerated trucks. |
4.3.3 Fluctuating fuel prices affecting operational costs of refrigerated truck fleets. |
5 Togo Refrigerated Truck Market Trends |
6 Togo Refrigerated Truck Market, By Types |
6.1 Togo Refrigerated Truck Market, By Type |
6.1.1 Overview and Analysis |
6.1.2 Togo Refrigerated Truck Market Revenues & Volume, By Type, 2022 - 2032F |
6.1.3 Togo Refrigerated Truck Market Revenues & Volume, By Light-Duty Trucks, 2022 - 2032F |
6.1.4 Togo Refrigerated Truck Market Revenues & Volume, By Medium-Duty Trucks, 2022 - 2032F |
6.1.5 Togo Refrigerated Truck Market Revenues & Volume, By Heavy-Duty Trucks, 2022 - 2032F |
6.1.6 Togo Refrigerated Truck Market Revenues & Volume, By Electric Refrigerated Trucks, 2022 - 2032F |
6.1.7 Togo Refrigerated Truck Market Revenues & Volume, By Hybrid Refrigerated Trucks, 2022 - 2032F |
6.2 Togo Refrigerated Truck Market, By Vehicle Class |
6.2.1 Overview and Analysis |
6.2.2 Togo Refrigerated Truck Market Revenues & Volume, By Class 1-3, 2022 - 2032F |
6.2.3 Togo Refrigerated Truck Market Revenues & Volume, By Class 4-6, 2022 - 2032F |
6.2.4 Togo Refrigerated Truck Market Revenues & Volume, By Class 7-8, 2022 - 2032F |
6.2.5 Togo Refrigerated Truck Market Revenues & Volume, By EVs, 2022 - 2032F |
6.2.6 Togo Refrigerated Truck Market Revenues & Volume, By Hybrid, 2022 - 2032F |
6.3 Togo Refrigerated Truck Market, By Refrigerant Type |
6.3.1 Overview and Analysis |
6.3.2 Togo Refrigerated Truck Market Revenues & Volume, By R-134a, 2022 - 2032F |
6.3.3 Togo Refrigerated Truck Market Revenues & Volume, By CO2, 2022 - 2032F |
6.3.4 Togo Refrigerated Truck Market Revenues & Volume, By Ammonia, 2022 - 2032F |
6.3.5 Togo Refrigerated Truck Market Revenues & Volume, By HFOs, 2022 - 2032F |
6.3.6 Togo Refrigerated Truck Market Revenues & Volume, By Hydrocarbons, 2022 - 2032F |
6.4 Togo Refrigerated Truck Market, By Application |
6.4.1 Overview and Analysis |
6.4.2 Togo Refrigerated Truck Market Revenues & Volume, By Fresh Produce, 2022 - 2032F |
6.4.3 Togo Refrigerated Truck Market Revenues & Volume, By Frozen Foods, 2022 - 2032F |
6.4.4 Togo Refrigerated Truck Market Revenues & Volume, By Meat & Dairy, 2022 - 2032F |
6.4.5 Togo Refrigerated Truck Market Revenues & Volume, By Pharmaceuticals, 2022 - 2032F |
6.4.6 Togo Refrigerated Truck Market Revenues & Volume, By E-commerce, 2022 - 2032F |
7 Togo Refrigerated Truck Market Import-Export Trade Statistics |
7.1 Togo Refrigerated Truck Market Export to Major Countries |
7.2 Togo Refrigerated Truck Market Imports from Major Countries |
8 Togo Refrigerated Truck Market Key Performance Indicators |
8.1 Average fleet utilization rate to measure the efficiency of refrigerated truck operations. |
8.2 On-time delivery performance to assess the reliability of refrigerated transportation services. |
8.3 Maintenance cost per mile to monitor the operational expenses and efficiency of refrigerated truck fleets. |
9 Togo Refrigerated Truck Market - Opportunity Assessment |
9.1 Togo Refrigerated Truck Market Opportunity Assessment, By Type, 2022 & 2032F |
9.2 Togo Refrigerated Truck Market Opportunity Assessment, By Vehicle Class, 2022 & 2032F |
9.3 Togo Refrigerated Truck Market Opportunity Assessment, By Refrigerant Type, 2022 & 2032F |
9.4 Togo Refrigerated Truck Market Opportunity Assessment, By Application, 2022 & 2032F |
10 Togo Refrigerated Truck Market - Competitive Landscape |
10.1 Togo Refrigerated Truck Market Revenue Share, By Companies, 2025 |
10.2 Togo Refrigerated Truck Market Competitive Benchmarking, By Operating and Technical Parameters |
11 Company Profiles |
12 Recommendations |
13 Disclaimer |
Export potential assessment - trade Analytics for 2030
Export potential enables firms to identify high-growth global markets with greater confidence by combining advanced trade intelligence with a structured quantitative methodology. The framework analyzes emerging demand trends and country-level import patterns while integrating macroeconomic and trade datasets such as GDP and population forecasts, bilateral import–export flows, tariff structures, elasticity differentials between developed and developing economies, geographic distance, and import demand projections. Using weighted trade values from 2020–2024 as the base period to project country-to-country export potential for 2030, these inputs are operationalized through calculated drivers such as gravity model parameters, tariff impact factors, and projected GDP per-capita growth. Through an analysis of hidden potentials, demand hotspots, and market conditions that are most favorable to success, this method enables firms to focus on target countries, maximize returns, and global expansion with data, backed by accuracy.
By factoring in the projected importer demand gap that is currently unmet and could be potential opportunity, it identifies the potential for the Exporter (Country) among 190 countries, against the general trade analysis, which identifies the biggest importer or exporter.
To discover high-growth global markets and optimize your business strategy:
Click Here
Pricing
- Single User License$ 1,995
- Department License$ 2,400
- Site License$ 3,120
- Global License$ 3,795

Search
Thought Leadership and Analyst Meet


Our Clients
Latest Reports
- Philippines Polyhydroxybutyrate-co-Hydroxyvalerate Market (2026-2032) | Trends, Insights, Challenges, Restraints, Competition, Size, Value, Forecast, Pricing, Share, Outlook, Revenue, Investment Opportunities, Strategy, Drivers, Demand, Growth, segmentation, Analysis, Companies
- Peru Polyhydroxybutyrate-co-Hydroxyvalerate Market (2026-2032) | Growth, Demand, Challenges, Share, Trends, Analysis, Pricing, Investment Opportunities, Drivers, Value, Forecast, Competition, Size, Companies, Insights, Outlook, Restraints, segmentation, Revenue, Strategy
- Pakistan Polyhydroxybutyrate-co-Hydroxyvalerate Market (2026-2032) | Restraints, segmentation, Pricing, Forecast, Share, Strategy, Competition, Trends, Insights, Drivers, Challenges, Growth, Revenue, Outlook, Value, Investment Opportunities, Companies, Size, Analysis, Demand
- Oman Polyhydroxybutyrate-co-Hydroxyvalerate Market (2026-2032) | Drivers, segmentation, Insights, Competition, Pricing, Outlook, Size, Revenue, Challenges, Forecast, Analysis, Growth, Value, Share, Trends, Investment Opportunities, Strategy, Restraints, Companies, Demand
- Nigeria Polyhydroxybutyrate-co-Hydroxyvalerate Market (2026-2032) | Value, Investment Opportunities, Analysis, Revenue, Restraints, Pricing, Outlook, Competition, Demand, Growth, Forecast, Companies, Trends, Challenges, segmentation, Drivers, Insights, Share, Size, Strategy
- Nepal Polyhydroxybutyrate-co-Hydroxyvalerate Market (2026-2032) | Insights, Analysis, Drivers, Share, Revenue, Demand, segmentation, Investment Opportunities, Competition, Forecast, Growth, Pricing, Companies, Strategy, Trends, Restraints, Challenges, Outlook, Size, Value
- Myanmar Polyhydroxybutyrate-co-Hydroxyvalerate Market (2026-2032) | Outlook, Revenue, Strategy, Restraints, Drivers, segmentation, Share, Forecast, Competition, Insights, Growth, Pricing, Size, Demand, Value, Companies, Trends, Challenges, Investment Opportunities, Analysis
- Morocco Polyhydroxybutyrate-co-Hydroxyvalerate Market (2026-2032) | Outlook, Investment Opportunities, Restraints, Strategy, Forecast, Challenges, Drivers, Growth, Companies, segmentation, Trends, Size, Competition, Revenue, Demand, Insights, Share, Analysis, Value, Pricing
- Mexico Polyhydroxybutyrate-co-Hydroxyvalerate Market (2026-2032) | Size, Drivers, Outlook, Share, Strategy, Growth, Pricing, Challenges, Companies, Demand, Value, Investment Opportunities, Restraints, Trends, Forecast, segmentation, Analysis, Insights, Competition, Revenue
- Malaysia Polyhydroxybutyrate-co-Hydroxyvalerate Market (2026-2032) | Share, segmentation, Size, Companies, Analysis, Insights, Forecast, Value, Revenue, Drivers, Restraints, Challenges, Investment Opportunities, Trends, Competition, Strategy, Demand, Growth, Outlook, Pricing
Industry Events and Analyst Meet

HIMTEX 2026

India Refining Summit 2026

India EV Show 2026

EV tech India Expo 2026

Auto Tech Asia 2026
Whitepaper
- Middle East & Africa Commercial Security Market Click here to view more.
- Middle East & Africa Fire Safety Systems & Equipment Market Click here to view more.
- GCC Drone Market Click here to view more.
- Middle East Lighting Fixture Market Click here to view more.
- GCC Physical & Perimeter Security Market Click here to view more.
6WResearch In News
- Doha a strategic location for EV manufacturing hub: IPA Qatar
- Demand for luxury TVs surging in the GCC, says Samsung
- Empowering Growth: The Thriving Journey of Bangladesh’s Cable Industry
- Demand for luxury TVs surging in the GCC, says Samsung
- Video call with a traditional healer? Once unthinkable, it’s now common in South Africa
- Intelligent Buildings To Smooth GCC’s Path To Net Zero