Togo Route Optimization Software Market (2026-2032) | Analysis, Industry, Growth, Trends, Forecast, Outlook, Companies, Segmentation, Revenue, Share, Value & Size
Market Forecast By Component (Software, Services), By Vertical (On-demand Food Delivery, Retail & FMCG, Field Services, Ride Hailing & Taxi Services, Others), By Deployment Type (On-premises, Cloud), By Organization Size (Small & Medium Enterprises, Large Enterprises) And Competitive Landscape
| Product Code: ETC5490866 | Publication Date: Nov 2023 | Updated Date: Apr 2026 | Product Type: Market Research Report | |
| Publisher: 6Wresearch | Author: Ravi Bhandari | No. of Pages: 60 | No. of Figures: 30 | No. of Tables: 5 |
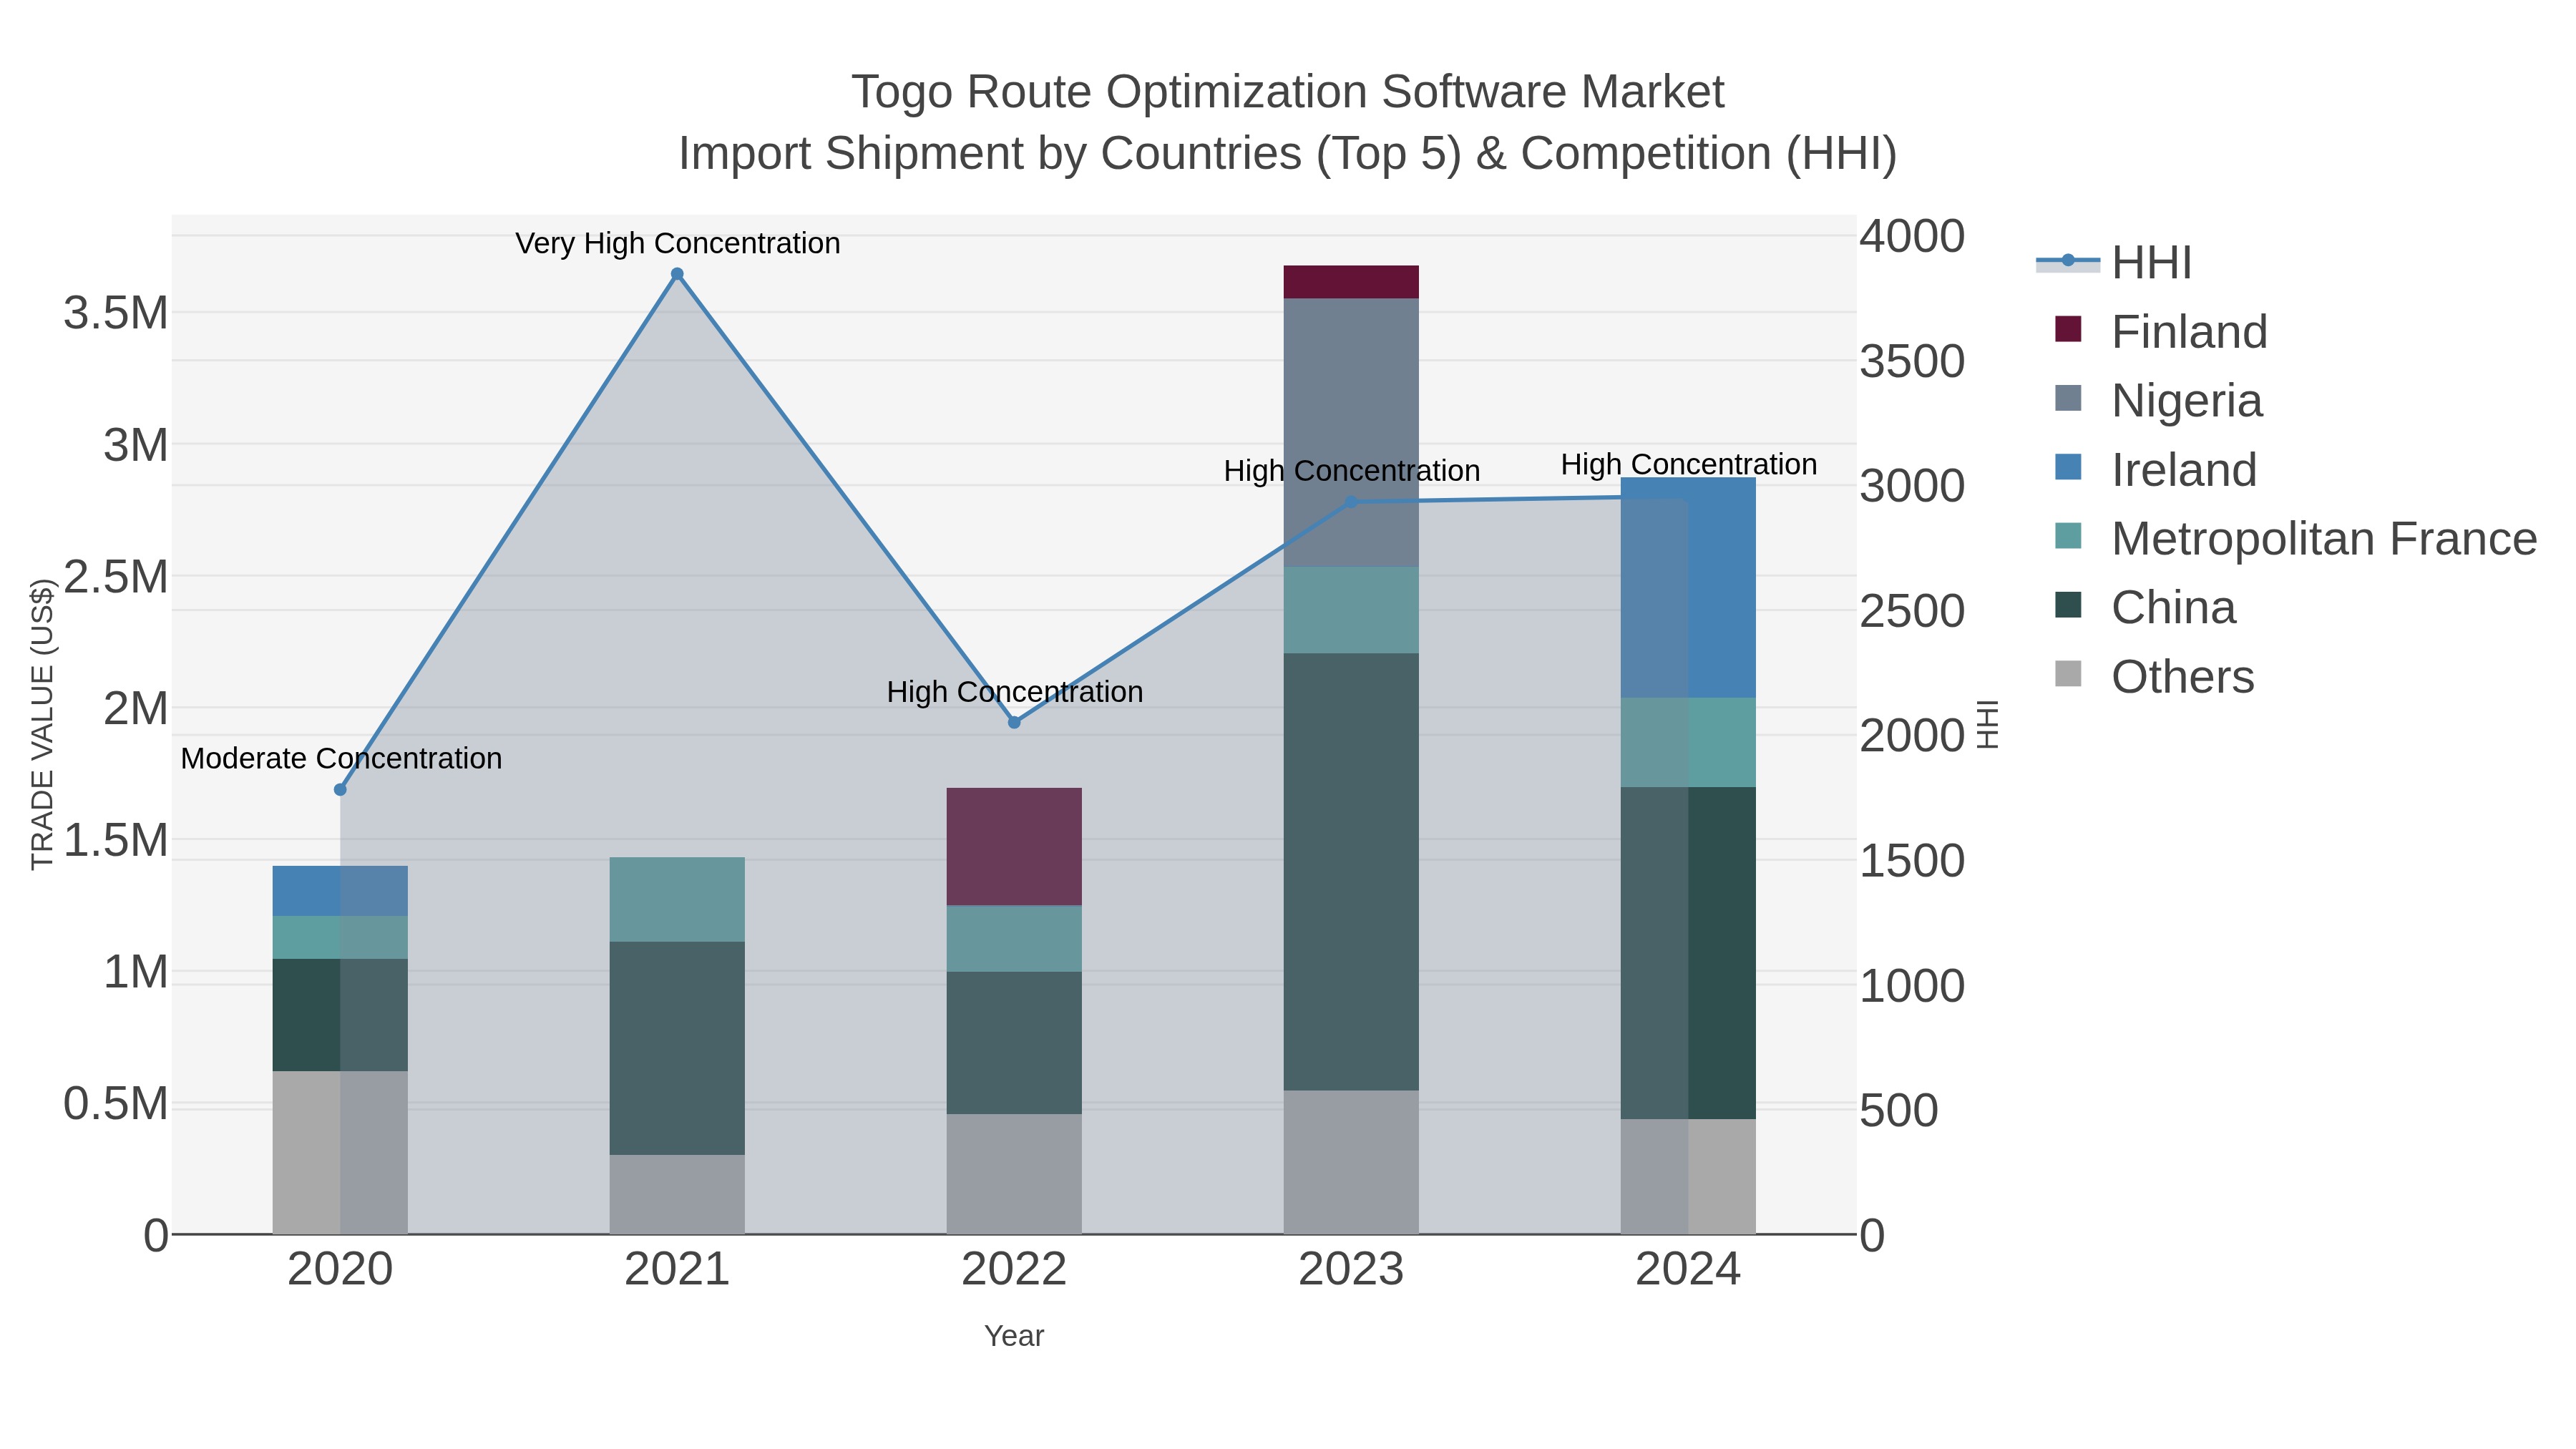
Togo Route Optimization Software Market Top 5 Importing Countries and Market Competition (HHI) Analysis
The Togo route optimization software market for import shipments continues to see a diverse range of countries exporting goods, with China, Ireland, Metropolitan France, Morocco, and Ghana leading the pack in 2024. Despite this varied export landscape, the market remains highly competitive with a low Herfindahl-Hirschman Index (HHI) indicating low concentration. While specific growth rate data is not available for the period 2023-24, the market is poised for further evolution as these key exporting countries continue to play a significant role in shaping Togo`s import landscape.
Key Highlights of the Report:
- Togo Route Optimization Software Market Outlook
- Market Size of Togo Route Optimization Software Market, 2025
- Forecast of Togo Route Optimization Software Market, 2032
- Historical Data and Forecast of Togo Route Optimization Software Revenues & Volume for the Period 2022 - 2032F
- Togo Route Optimization Software Market Trend Evolution
- Togo Route Optimization Software Market Drivers and Challenges
- Togo Route Optimization Software Price Trends
- Togo Route Optimization Software Porter`s Five Forces
- Togo Route Optimization Software Industry Life Cycle
- Historical Data and Forecast of Togo Route Optimization Software Market Revenues & Volume By Component for the Period 2022 - 2032F
- Historical Data and Forecast of Togo Route Optimization Software Market Revenues & Volume By Software for the Period 2022 - 2032F
- Historical Data and Forecast of Togo Route Optimization Software Market Revenues & Volume By Services for the Period 2022 - 2032F
- Historical Data and Forecast of Togo Route Optimization Software Market Revenues & Volume By Vertical for the Period 2022 - 2032F
- Historical Data and Forecast of Togo Route Optimization Software Market Revenues & Volume By On-demand Food Delivery for the Period 2022 - 2032F
- Historical Data and Forecast of Togo Route Optimization Software Market Revenues & Volume By Retail & FMCG for the Period 2022 - 2032F
- Historical Data and Forecast of Togo Route Optimization Software Market Revenues & Volume By Field Services for the Period 2022 - 2032F
- Historical Data and Forecast of Togo Route Optimization Software Market Revenues & Volume By Ride Hailing & Taxi Services for the Period 2022 - 2032F
- Historical Data and Forecast of Togo Route Optimization Software Market Revenues & Volume By Others for the Period 2022 - 2032F
- Historical Data and Forecast of Togo Route Optimization Software Market Revenues & Volume By Deployment Type for the Period 2022 - 2032F
- Historical Data and Forecast of Togo Route Optimization Software Market Revenues & Volume By On-premises for the Period 2022 - 2032F
- Historical Data and Forecast of Togo Route Optimization Software Market Revenues & Volume By Cloud for the Period 2022 - 2032F
- Historical Data and Forecast of Togo Route Optimization Software Market Revenues & Volume By Organization Size for the Period 2022 - 2032F
- Historical Data and Forecast of Togo Route Optimization Software Market Revenues & Volume By Small & Medium Enterprises for the Period 2022 - 2032F
- Historical Data and Forecast of Togo Route Optimization Software Market Revenues & Volume By Large Enterprises for the Period 2022 - 2032F
- Togo Route Optimization Software Import Export Trade Statistics
- Market Opportunity Assessment By Component
- Market Opportunity Assessment By Vertical
- Market Opportunity Assessment By Deployment Type
- Market Opportunity Assessment By Organization Size
- Togo Route Optimization Software Top Companies Market Share
- Togo Route Optimization Software Competitive Benchmarking By Technical and Operational Parameters
- Togo Route Optimization Software Company Profiles
- Togo Route Optimization Software Key Strategic Recommendations
Frequently Asked Questions About the Market Study (FAQs):
6Wresearch actively monitors the Togo Route Optimization Software Market and publishes its comprehensive annual report, highlighting emerging trends, growth drivers, revenue analysis, and forecast outlook. Our insights help businesses to make data-backed strategic decisions with ongoing market dynamics. Our analysts track relevent industries related to the Togo Route Optimization Software Market, allowing our clients with actionable intelligence and reliable forecasts tailored to emerging regional needs.
Yes, we provide customisation as per your requirements. To learn more, feel free to contact us on sales@6wresearch.com
1 Executive Summary |
2 Introduction |
2.1 Key Highlights of the Report |
2.2 Report Description |
2.3 Market Scope & Segmentation |
2.4 Research Methodology |
2.5 Assumptions |
3 Togo Route Optimization Software Market Overview |
3.1 Togo Country Macro Economic Indicators |
3.2 Togo Route Optimization Software Market Revenues & Volume, 2022 & 2032F |
3.3 Togo Route Optimization Software Market - Industry Life Cycle |
3.4 Togo Route Optimization Software Market - Porter's Five Forces |
3.5 Togo Route Optimization Software Market Revenues & Volume Share, By Component, 2022 & 2032F |
3.6 Togo Route Optimization Software Market Revenues & Volume Share, By Vertical , 2022 & 2032F |
3.7 Togo Route Optimization Software Market Revenues & Volume Share, By Deployment Type, 2022 & 2032F |
3.8 Togo Route Optimization Software Market Revenues & Volume Share, By Organization Size, 2022 & 2032F |
4 Togo Route Optimization Software Market Dynamics |
4.1 Impact Analysis |
4.2 Market Drivers |
4.2.1 Increasing demand for efficient logistics and supply chain management solutions |
4.2.2 Growing adoption of route optimization software to reduce operational costs and improve productivity |
4.2.3 Technological advancements leading to more sophisticated and customizable route optimization solutions |
4.3 Market Restraints |
4.3.1 High initial investment required for implementing route optimization software |
4.3.2 Resistance to change and reluctance to adopt new technologies among traditional businesses |
4.3.3 Data privacy and security concerns related to sharing sensitive information for optimization purposes |
5 Togo Route Optimization Software Market Trends |
6 Togo Route Optimization Software Market Segmentations |
6.1 Togo Route Optimization Software Market, By Component |
6.1.1 Overview and Analysis |
6.1.2 Togo Route Optimization Software Market Revenues & Volume, By Software, 2022 - 2032F |
6.1.3 Togo Route Optimization Software Market Revenues & Volume, By Services, 2022 - 2032F |
6.2 Togo Route Optimization Software Market, By Vertical |
6.2.1 Overview and Analysis |
6.2.2 Togo Route Optimization Software Market Revenues & Volume, By On-demand Food Delivery, 2022 - 2032F |
6.2.3 Togo Route Optimization Software Market Revenues & Volume, By Retail & FMCG, 2022 - 2032F |
6.2.4 Togo Route Optimization Software Market Revenues & Volume, By Field Services, 2022 - 2032F |
6.2.5 Togo Route Optimization Software Market Revenues & Volume, By Ride Hailing & Taxi Services, 2022 - 2032F |
6.2.6 Togo Route Optimization Software Market Revenues & Volume, By Others, 2022 - 2032F |
6.3 Togo Route Optimization Software Market, By Deployment Type |
6.3.1 Overview and Analysis |
6.3.2 Togo Route Optimization Software Market Revenues & Volume, By On-premises, 2022 - 2032F |
6.3.3 Togo Route Optimization Software Market Revenues & Volume, By Cloud, 2022 - 2032F |
6.4 Togo Route Optimization Software Market, By Organization Size |
6.4.1 Overview and Analysis |
6.4.2 Togo Route Optimization Software Market Revenues & Volume, By Small & Medium Enterprises, 2022 - 2032F |
6.4.3 Togo Route Optimization Software Market Revenues & Volume, By Large Enterprises, 2022 - 2032F |
7 Togo Route Optimization Software Market Import-Export Trade Statistics |
7.1 Togo Route Optimization Software Market Export to Major Countries |
7.2 Togo Route Optimization Software Market Imports from Major Countries |
8 Togo Route Optimization Software Market Key Performance Indicators |
8.1 Average reduction in transportation costs achieved by using the route optimization software |
8.2 Percentage increase in on-time deliveries after implementing the software |
8.3 Improvement in fuel efficiency and reduction in carbon emissions per delivery |
8.4 Increase in customer satisfaction scores due to optimized routes and faster delivery times |
8.5 Percentage decrease in the number of vehicles needed to meet delivery demands |
9 Togo Route Optimization Software Market - Opportunity Assessment |
9.1 Togo Route Optimization Software Market Opportunity Assessment, By Component, 2022 & 2032F |
9.2 Togo Route Optimization Software Market Opportunity Assessment, By Vertical , 2022 & 2032F |
9.3 Togo Route Optimization Software Market Opportunity Assessment, By Deployment Type, 2022 & 2032F |
9.4 Togo Route Optimization Software Market Opportunity Assessment, By Organization Size, 2022 & 2032F |
10 Togo Route Optimization Software Market - Competitive Landscape |
10.1 Togo Route Optimization Software Market Revenue Share, By Companies, 2025 |
10.2 Togo Route Optimization Software Market Competitive Benchmarking, By Operating and Technical Parameters |
11 Company Profiles |
12 Recommendations | 13 Disclaimer |
Export potential assessment - trade Analytics for 2030
Export potential enables firms to identify high-growth global markets with greater confidence by combining advanced trade intelligence with a structured quantitative methodology. The framework analyzes emerging demand trends and country-level import patterns while integrating macroeconomic and trade datasets such as GDP and population forecasts, bilateral import–export flows, tariff structures, elasticity differentials between developed and developing economies, geographic distance, and import demand projections. Using weighted trade values from 2020–2024 as the base period to project country-to-country export potential for 2030, these inputs are operationalized through calculated drivers such as gravity model parameters, tariff impact factors, and projected GDP per-capita growth. Through an analysis of hidden potentials, demand hotspots, and market conditions that are most favorable to success, this method enables firms to focus on target countries, maximize returns, and global expansion with data, backed by accuracy.
By factoring in the projected importer demand gap that is currently unmet and could be potential opportunity, it identifies the potential for the Exporter (Country) among 190 countries, against the general trade analysis, which identifies the biggest importer or exporter.
To discover high-growth global markets and optimize your business strategy:
Click Here
Pricing
- Single User License$ 1,995
- Department License$ 2,400
- Site License$ 3,120
- Global License$ 3,795

Search
Thought Leadership and Analyst Meet


Our Clients
Latest Reports
- China Electric Appliance Rental Market (2026-2032) | Trends, Revenue, Growth, Challenges, Size, Value, Outlook, Pricing, Strategy, Insights, Restraints, segmentation, Companies, Investment Opportunities, Analysis, Demand, Drivers, Competition, Forecast, Share
- Chile Electric Appliance Rental Market (2026-2032) | Outlook, Competition, Drivers, Strategy, Revenue, Analysis, Value, Pricing, Restraints, Size, Demand, Share, Growth, Forecast, Challenges, Insights, Investment Opportunities, Companies, Trends, segmentation
- Cambodia Electric Appliance Rental Market (2026-2032) | Companies, Analysis, Restraints, Pricing, Insights, Challenges, Outlook, Strategy, Forecast, Trends, Competition, Value, Revenue, Investment Opportunities, segmentation, Drivers, Size, Demand, Growth, Share
- Brazil Electric Appliance Rental Market (2026-2032) | Revenue, Strategy, Forecast, Companies, segmentation, Competition, Size, Investment Opportunities, Pricing, Restraints, Outlook, Challenges, Analysis, Drivers, Value, Demand, Insights, Trends, Growth, Share
- Bangladesh Electric Appliance Rental Market (2026-2032) | Drivers, Forecast, Investment Opportunities, Strategy, Insights, Demand, Challenges, Outlook, Trends, Competition, Value, Revenue, Size, Pricing, Analysis, Companies, Restraints, segmentation, Share, Growth
- Bahrain Electric Appliance Rental Market (2026-2032) | Outlook, Size, Competition, Restraints, Drivers, Value, Trends, Investment Opportunities, Insights, Forecast, Revenue, Strategy, Growth, Share, Demand, Analysis, Challenges, Companies, segmentation, Pricing
- Azerbaijan Electric Appliance Rental Market (2026-2032) | Trends, Investment Opportunities, Restraints, Insights, Strategy, Competition, Value, Growth, Demand, Drivers, Analysis, Forecast, Size, Share, Outlook, segmentation, Pricing, Challenges, Revenue, Companies
- Australia Electric Appliance Rental Market (2026-2032) | Challenges, Restraints, Forecast, Demand, Size, Competition, Pricing, Investment Opportunities, Revenue, Trends, Drivers, Growth, Outlook, Analysis, Strategy, Value, segmentation, Insights, Companies, Share
- Argentina Electric Appliance Rental Market (2026-2032) | Growth, Trends, Insights, Outlook, Forecast, Size, Drivers, Analysis, Restraints, Challenges, Share, Revenue, Investment Opportunities, Strategy, Demand, Value, Companies, segmentation, Competition, Pricing
- Algeria Electric Appliance Rental Market (2026-2032) | Share, Size, Value, Strategy, Competition, Outlook, Challenges, Companies, Trends, Pricing, Insights, Forecast, Investment Opportunities, Revenue, Growth, Restraints, segmentation, Analysis, Demand, Drivers
Industry Events and Analyst Meet

HIMTEX 2026

India Refining Summit 2026

India EV Show 2026

EV tech India Expo 2026

Auto Tech Asia 2026
Whitepaper
- Middle East & Africa Commercial Security Market Click here to view more.
- Middle East & Africa Fire Safety Systems & Equipment Market Click here to view more.
- GCC Drone Market Click here to view more.
- Middle East Lighting Fixture Market Click here to view more.
- GCC Physical & Perimeter Security Market Click here to view more.
6WResearch In News
- Doha a strategic location for EV manufacturing hub: IPA Qatar
- Demand for luxury TVs surging in the GCC, says Samsung
- Empowering Growth: The Thriving Journey of Bangladesh’s Cable Industry
- Demand for luxury TVs surging in the GCC, says Samsung
- Video call with a traditional healer? Once unthinkable, it’s now common in South Africa
- Intelligent Buildings To Smooth GCC’s Path To Net Zero