Togo Smart Process Application Market (2026-2032) | Companies, Revenue, Growth, Trends, Value, Analysis, Forecast, Industry, Segmentation, Outlook, Size & Share
Market Forecast By Solution (Audit, Risk & Compliance Management, BI & Analytics Applications, Business Transaction Processing, Customer Experience, Enterprise IT), By Service (Consulting Services, Integration Services, Training & Support Services, Operations and Maintenance Services), By Organization Size (Small Sized Businesses, Medium Sized Businesses, Large Enterprises), By Vertical (BFSI, Telecom & IT, Public Sector, Energy, and Utilities, Media and Entertainment, Manufacturing, Retail, Healthcare, Academia and Education) And Competitive Landscape
| Product Code: ETC5501506 | Publication Date: Nov 2023 | Updated Date: Apr 2026 | Product Type: Market Research Report | |
| Publisher: 6Wresearch | Author: Ravi Bhandari | No. of Pages: 60 | No. of Figures: 30 | No. of Tables: 5 |
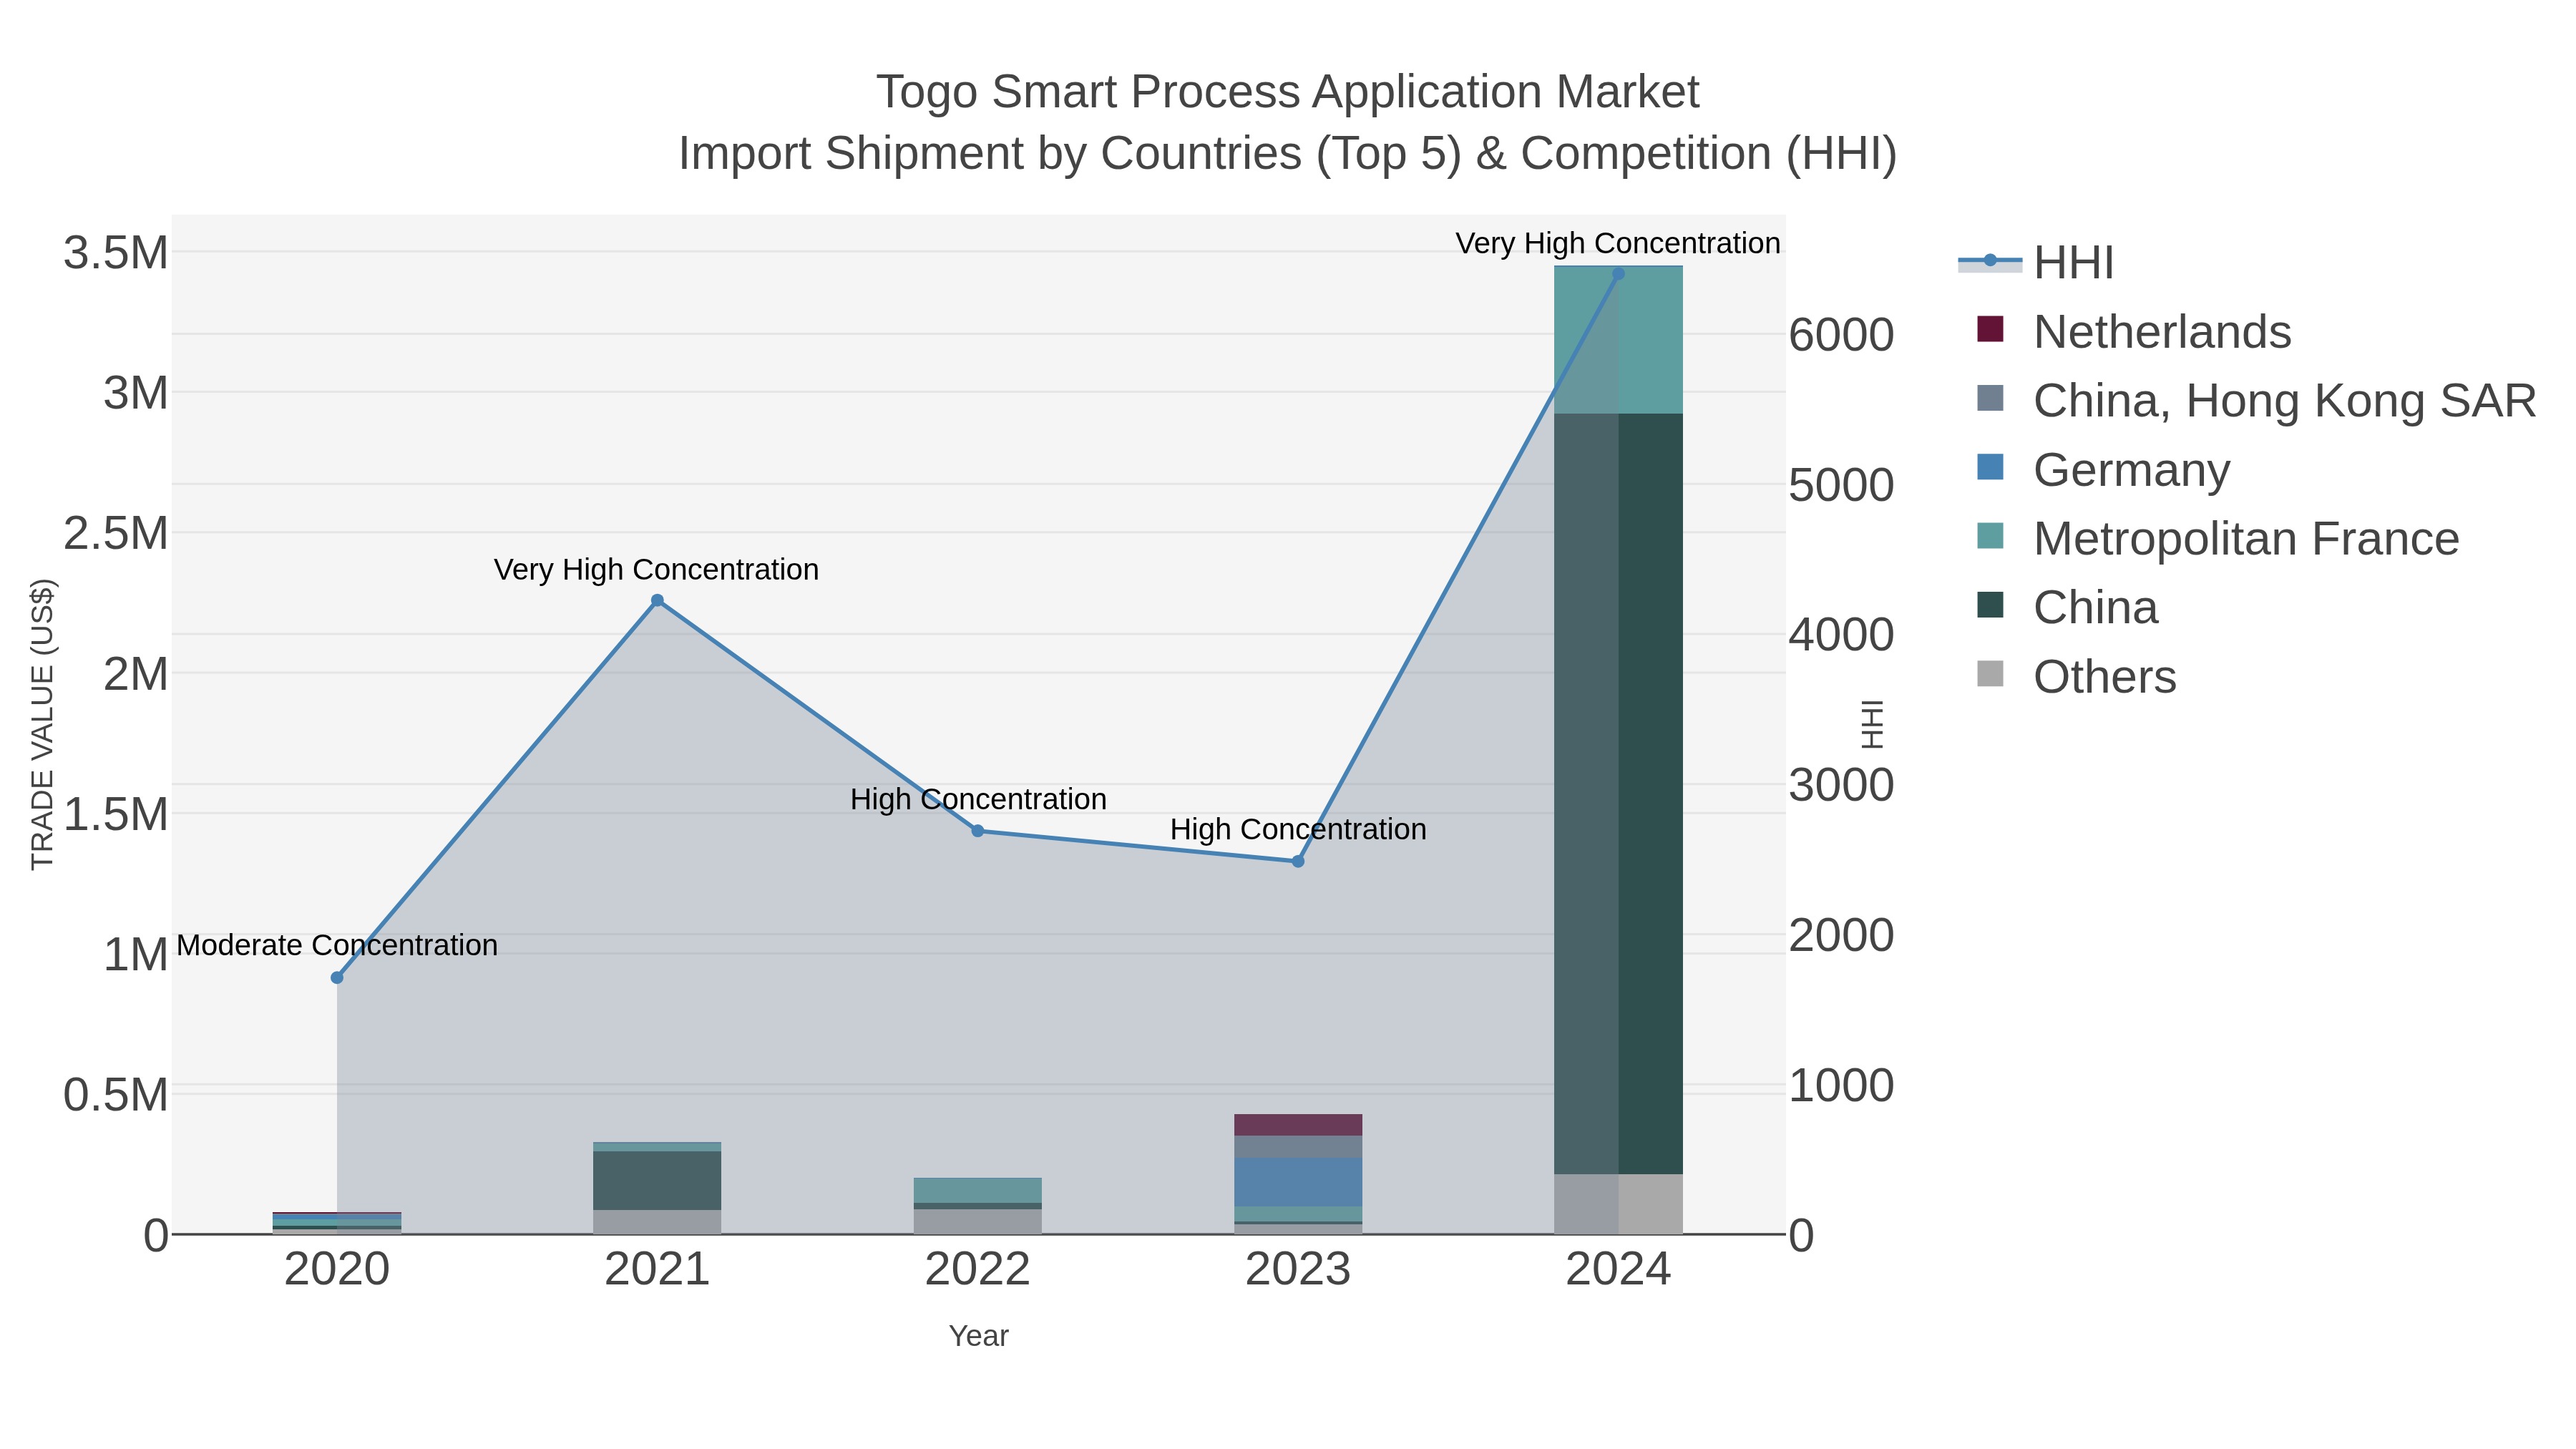
Togo Smart Process Application Market Top 5 Importing Countries and Market Competition (HHI) Analysis
In 2024, Togo`s import shipments from top countries like China, Metropolitan France, Estonia, Morocco, and Switzerland indicate diverse sourcing. The low concentration in the HHI index suggests a competitive market landscape. However, the lack of available data on CAGR and growth rate for this period hinders a comprehensive analysis of the market dynamics. Monitoring future trends and developments in Togo`s import sector will be crucial for stakeholders to capitalize on emerging opportunities.
Key Highlights of the Report:
- Togo Smart Process Application Market Outlook
- Market Size of Togo Smart Process Application Market, 2025
- Forecast of Togo Smart Process Application Market, 2032
- Historical Data and Forecast of Togo Smart Process Application Revenues & Volume for the Period 2022 - 2032F
- Togo Smart Process Application Market Trend Evolution
- Togo Smart Process Application Market Drivers and Challenges
- Togo Smart Process Application Price Trends
- Togo Smart Process Application Porter`s Five Forces
- Togo Smart Process Application Industry Life Cycle
- Historical Data and Forecast of Togo Smart Process Application Market Revenues & Volume By Solution for the Period 2022 - 2032F
- Historical Data and Forecast of Togo Smart Process Application Market Revenues & Volume By Audit, Risk & Compliance Management for the Period 2022 - 2032F
- Historical Data and Forecast of Togo Smart Process Application Market Revenues & Volume By BI & Analytics Applications for the Period 2022 - 2032F
- Historical Data and Forecast of Togo Smart Process Application Market Revenues & Volume By Business Transaction Processing for the Period 2022 - 2032F
- Historical Data and Forecast of Togo Smart Process Application Market Revenues & Volume By Customer Experience for the Period 2022 - 2032F
- Historical Data and Forecast of Togo Smart Process Application Market Revenues & Volume By Enterprise IT for the Period 2022 - 2032F
- Historical Data and Forecast of Togo Smart Process Application Market Revenues & Volume By Service for the Period 2022 - 2032F
- Historical Data and Forecast of Togo Smart Process Application Market Revenues & Volume By Consulting Services for the Period 2022 - 2032F
- Historical Data and Forecast of Togo Smart Process Application Market Revenues & Volume By Integration Services for the Period 2022 - 2032F
- Historical Data and Forecast of Togo Smart Process Application Market Revenues & Volume By Training & Support Services for the Period 2022 - 2032F
- Historical Data and Forecast of Togo Smart Process Application Market Revenues & Volume By Operations and Maintenance Services for the Period 2022 - 2032F
- Historical Data and Forecast of Togo Smart Process Application Market Revenues & Volume By Organization Size for the Period 2022 - 2032F
- Historical Data and Forecast of Togo Smart Process Application Market Revenues & Volume By Small Sized Businesses for the Period 2022 - 2032F
- Historical Data and Forecast of Togo Smart Process Application Market Revenues & Volume By Medium Sized Businesses for the Period 2022 - 2032F
- Historical Data and Forecast of Togo Smart Process Application Market Revenues & Volume By Large Enterprises for the Period 2022 - 2032F
- Historical Data and Forecast of Togo Smart Process Application Market Revenues & Volume By Vertical for the Period 2022 - 2032F
- Historical Data and Forecast of Togo Smart Process Application Market Revenues & Volume By BFSI for the Period 2022 - 2032F
- Historical Data and Forecast of Togo Smart Process Application Market Revenues & Volume By Telecom & IT for the Period 2022 - 2032F
- Historical Data and Forecast of Togo Smart Process Application Market Revenues & Volume By Public Sector, Energy, and Utilities for the Period 2022 - 2032F
- Historical Data and Forecast of Togo Smart Process Application Market Revenues & Volume By Media and Entertainment for the Period 2022 - 2032F
- Historical Data and Forecast of Togo Smart Process Application Market Revenues & Volume By Manufacturing for the Period 2022 - 2032F
- Historical Data and Forecast of Togo Smart Process Application Market Revenues & Volume By Retail for the Period 2022 - 2032F
- Historical Data and Forecast of Togo Smart Process Application Market Revenues & Volume By Healthcare for the Period 2022 - 2032F
- Historical Data and Forecast of Togo Smart Process Application Market Revenues & Volume By Academia and Education for the Period 2022 - 2032F
- Togo Smart Process Application Import Export Trade Statistics
- Market Opportunity Assessment By Solution
- Market Opportunity Assessment By Service
- Market Opportunity Assessment By Organization Size
- Market Opportunity Assessment By Vertical
- Togo Smart Process Application Top Companies Market Share
- Togo Smart Process Application Competitive Benchmarking By Technical and Operational Parameters
- Togo Smart Process Application Company Profiles
- Togo Smart Process Application Key Strategic Recommendations
Frequently Asked Questions About the Market Study (FAQs):
6Wresearch actively monitors the Togo Smart Process Application Market and publishes its comprehensive annual report, highlighting emerging trends, growth drivers, revenue analysis, and forecast outlook. Our insights help businesses to make data-backed strategic decisions with ongoing market dynamics. Our analysts track relevent industries related to the Togo Smart Process Application Market, allowing our clients with actionable intelligence and reliable forecasts tailored to emerging regional needs.
Yes, we provide customisation as per your requirements. To learn more, feel free to contact us on sales@6wresearch.com
1 Executive Summary |
2 Introduction |
2.1 Key Highlights of the Report |
2.2 Report Description |
2.3 Market Scope & Segmentation |
2.4 Research Methodology |
2.5 Assumptions |
3 Togo Smart Process Application Market Overview |
3.1 Togo Country Macro Economic Indicators |
3.2 Togo Smart Process Application Market Revenues & Volume, 2022 & 2032F |
3.3 Togo Smart Process Application Market - Industry Life Cycle |
3.4 Togo Smart Process Application Market - Porter's Five Forces |
3.5 Togo Smart Process Application Market Revenues & Volume Share, By Solution , 2022 & 2032F |
3.6 Togo Smart Process Application Market Revenues & Volume Share, By Service, 2022 & 2032F |
3.7 Togo Smart Process Application Market Revenues & Volume Share, By Organization Size, 2022 & 2032F |
3.8 Togo Smart Process Application Market Revenues & Volume Share, By Vertical, 2022 & 2032F |
4 Togo Smart Process Application Market Dynamics |
4.1 Impact Analysis |
4.2 Market Drivers |
4.2.1 Increasing demand for automation and streamlining of business processes |
4.2.2 Growing adoption of cloud-based solutions and digital transformation initiatives |
4.2.3 Rising need for better data management and analytics capabilities |
4.3 Market Restraints |
4.3.1 Concerns over data security and privacy issues |
4.3.2 High initial investment costs associated with implementing smart process applications |
4.3.3 Resistance to change and lack of awareness about the benefits of smart process applications |
5 Togo Smart Process Application Market Trends |
6 Togo Smart Process Application Market Segmentations |
6.1 Togo Smart Process Application Market, By Solution |
6.1.1 Overview and Analysis |
6.1.2 Togo Smart Process Application Market Revenues & Volume, By Audit, Risk & Compliance Management, 2022 - 2032F |
6.1.3 Togo Smart Process Application Market Revenues & Volume, By BI & Analytics Applications, 2022 - 2032F |
6.1.4 Togo Smart Process Application Market Revenues & Volume, By Business Transaction Processing, 2022 - 2032F |
6.1.5 Togo Smart Process Application Market Revenues & Volume, By Customer Experience, 2022 - 2032F |
6.1.6 Togo Smart Process Application Market Revenues & Volume, By Enterprise IT, 2022 - 2032F |
6.2 Togo Smart Process Application Market, By Service |
6.2.1 Overview and Analysis |
6.2.2 Togo Smart Process Application Market Revenues & Volume, By Consulting Services, 2022 - 2032F |
6.2.3 Togo Smart Process Application Market Revenues & Volume, By Integration Services, 2022 - 2032F |
6.2.4 Togo Smart Process Application Market Revenues & Volume, By Training & Support Services, 2022 - 2032F |
6.2.5 Togo Smart Process Application Market Revenues & Volume, By Operations and Maintenance Services, 2022 - 2032F |
6.3 Togo Smart Process Application Market, By Organization Size |
6.3.1 Overview and Analysis |
6.3.2 Togo Smart Process Application Market Revenues & Volume, By Small Sized Businesses, 2022 - 2032F |
6.3.3 Togo Smart Process Application Market Revenues & Volume, By Medium Sized Businesses, 2022 - 2032F |
6.3.4 Togo Smart Process Application Market Revenues & Volume, By Large Enterprises, 2022 - 2032F |
6.4 Togo Smart Process Application Market, By Vertical |
6.4.1 Overview and Analysis |
6.4.2 Togo Smart Process Application Market Revenues & Volume, By BFSI, 2022 - 2032F |
6.4.3 Togo Smart Process Application Market Revenues & Volume, By Telecom & IT, 2022 - 2032F |
6.4.4 Togo Smart Process Application Market Revenues & Volume, By Public Sector, Energy, and Utilities, 2022 - 2032F |
6.4.5 Togo Smart Process Application Market Revenues & Volume, By Media and Entertainment, 2022 - 2032F |
6.4.6 Togo Smart Process Application Market Revenues & Volume, By Manufacturing, 2022 - 2032F |
6.4.7 Togo Smart Process Application Market Revenues & Volume, By Retail, 2022 - 2032F |
6.4.8 Togo Smart Process Application Market Revenues & Volume, By Academia and Education, 2022 - 2032F |
6.4.9 Togo Smart Process Application Market Revenues & Volume, By Academia and Education, 2022 - 2032F |
7 Togo Smart Process Application Market Import-Export Trade Statistics |
7.1 Togo Smart Process Application Market Export to Major Countries |
7.2 Togo Smart Process Application Market Imports from Major Countries |
8 Togo Smart Process Application Market Key Performance Indicators |
8.1 Percentage increase in process efficiency and automation levels |
8.2 Reduction in average processing time for key business operations |
8.3 Number of successful process optimization projects implemented |
8.4 Percentage improvement in data accuracy and quality |
8.5 Increase in user satisfaction and engagement with smart process applications |
9 Togo Smart Process Application Market - Opportunity Assessment |
9.1 Togo Smart Process Application Market Opportunity Assessment, By Solution , 2022 & 2032F |
9.2 Togo Smart Process Application Market Opportunity Assessment, By Service, 2022 & 2032F |
9.3 Togo Smart Process Application Market Opportunity Assessment, By Organization Size, 2022 & 2032F |
9.4 Togo Smart Process Application Market Opportunity Assessment, By Vertical, 2022 & 2032F |
10 Togo Smart Process Application Market - Competitive Landscape |
10.1 Togo Smart Process Application Market Revenue Share, By Companies, 2025 |
10.2 Togo Smart Process Application Market Competitive Benchmarking, By Operating and Technical Parameters |
11 Company Profiles |
12 Recommendations | 13 Disclaimer |
Export potential assessment - trade Analytics for 2030
Export potential enables firms to identify high-growth global markets with greater confidence by combining advanced trade intelligence with a structured quantitative methodology. The framework analyzes emerging demand trends and country-level import patterns while integrating macroeconomic and trade datasets such as GDP and population forecasts, bilateral import–export flows, tariff structures, elasticity differentials between developed and developing economies, geographic distance, and import demand projections. Using weighted trade values from 2020–2024 as the base period to project country-to-country export potential for 2030, these inputs are operationalized through calculated drivers such as gravity model parameters, tariff impact factors, and projected GDP per-capita growth. Through an analysis of hidden potentials, demand hotspots, and market conditions that are most favorable to success, this method enables firms to focus on target countries, maximize returns, and global expansion with data, backed by accuracy.
By factoring in the projected importer demand gap that is currently unmet and could be potential opportunity, it identifies the potential for the Exporter (Country) among 190 countries, against the general trade analysis, which identifies the biggest importer or exporter.
To discover high-growth global markets and optimize your business strategy:
Click Here
Pricing
- Single User License$ 1,995
- Department License$ 2,400
- Site License$ 3,120
- Global License$ 3,795

Search
Thought Leadership and Analyst Meet


Our Clients
Latest Reports
- United Kingdom (UK) Outdoor Cooking Equipment Market (2026-2032) | Investment Opportunities, Outlook, Growth, Competition, Trends, Pricing, Demand, Insights, Challenges, Drivers, Size, Restraints, segmentation, Value, Share, Forecast, Companies, Analysis, Revenue, Strategy
- United Arab Emirates (UAE) Outdoor Cooking Equipment Market (2026-2032) | Challenges, Value, Restraints, Growth, Competition, Revenue, Trends, Outlook, Analysis, Drivers, Share, Investment Opportunities, Strategy, Demand, Companies, Forecast, Pricing, segmentation, Size, Insights
- Vietnam Outdoor Cooking Equipment Market (2026-2032) | Demand, Investment Opportunities, Growth, Pricing, Trends, Restraints, Competition, Outlook, Drivers, Strategy, Challenges, Revenue, Analysis, segmentation, Value, Size, Share, Insights, Companies, Forecast
- Venezuela Outdoor Cooking Equipment Market (2026-2032) | Challenges, Revenue, Demand, Value, Pricing, Strategy, Competition, Analysis, Companies, Insights, Growth, Outlook, Forecast, Size, Restraints, segmentation, Drivers, Trends, Investment Opportunities, Share
- Uganda Outdoor Cooking Equipment Market (2026-2032) | Drivers, Pricing, Challenges, Value, Growth, Companies, segmentation, Strategy, Analysis, Demand, Outlook, Size, Competition, Restraints, Revenue, Forecast, Investment Opportunities, Insights, Trends, Share
- Turkey Outdoor Cooking Equipment Market (2026-2032) | Size, Competition, Outlook, Strategy, Forecast, Drivers, Trends, Companies, Revenue, Growth, Analysis, segmentation, Insights, Pricing, Restraints, Demand, Investment Opportunities, Value, Share, Challenges
- Tunisia Outdoor Cooking Equipment Market (2026-2032) | Analysis, Share, Pricing, Trends, Size, Outlook, Revenue, segmentation, Demand, Insights, Investment Opportunities, Restraints, Growth, Forecast, Competition, Drivers, Challenges, Companies, Strategy, Value
- Thailand Outdoor Cooking Equipment Market (2026-2032) | Growth, Revenue, Insights, Companies, Drivers, Strategy, Forecast, Size, Analysis, segmentation, Trends, Challenges, Competition, Share, Investment Opportunities, Demand, Pricing, Value, Restraints, Outlook
- Tanzania Outdoor Cooking Equipment Market (2026-2032) | Share, Drivers, Forecast, Revenue, Growth, Outlook, Analysis, Investment Opportunities, Restraints, segmentation, Demand, Pricing, Size, Insights, Challenges, Competition, Companies, Value, Trends, Strategy
- Tajikistan Outdoor Cooking Equipment Market (2026-2032) | Value, Pricing, Companies, Share, Strategy, Revenue, Investment Opportunities, Demand, Forecast, Size, Competition, Challenges, Growth, Insights, Restraints, segmentation, Analysis, Trends, Drivers, Outlook
Industry Events and Analyst Meet

HIMTEX 2026

India Refining Summit 2026

India EV Show 2026

EV tech India Expo 2026

Auto Tech Asia 2026
Whitepaper
- Middle East & Africa Commercial Security Market Click here to view more.
- Middle East & Africa Fire Safety Systems & Equipment Market Click here to view more.
- GCC Drone Market Click here to view more.
- Middle East Lighting Fixture Market Click here to view more.
- GCC Physical & Perimeter Security Market Click here to view more.
6WResearch In News
- Doha a strategic location for EV manufacturing hub: IPA Qatar
- Demand for luxury TVs surging in the GCC, says Samsung
- Empowering Growth: The Thriving Journey of Bangladesh’s Cable Industry
- Demand for luxury TVs surging in the GCC, says Samsung
- Video call with a traditional healer? Once unthinkable, it’s now common in South Africa
- Intelligent Buildings To Smooth GCC’s Path To Net Zero