Tunisia Chemical Packaging Market (2026-2032) | Industry, Value, Forecast, Outlook, Trends, Revenue, Size, Companies, Analysis, Share & Growth
Market Forecast By Product Types (Sacks, Drums, FIBC, Other), By Applications (Pharmaceutical Factory, Laboratory, Chemical Plant, Others) And Competitive Landscape
| Product Code: ETC006914 | Publication Date: Sep 2020 | Updated Date: Jun 2026 | Product Type: Report | |
| Publisher: 6Wresearch | Author: Ravi Bhandari | No. of Pages: 70 | No. of Figures: 35 | No. of Tables: 5 |
Tunisia Chemical Packaging Market Summary
The tunisia chemical packaging market was estimated at USD 1103 Million in 2025 and is projected to reach USD 1607 Million by 2032, growing at a CAGR of 6.5% from 2026 to 2032.
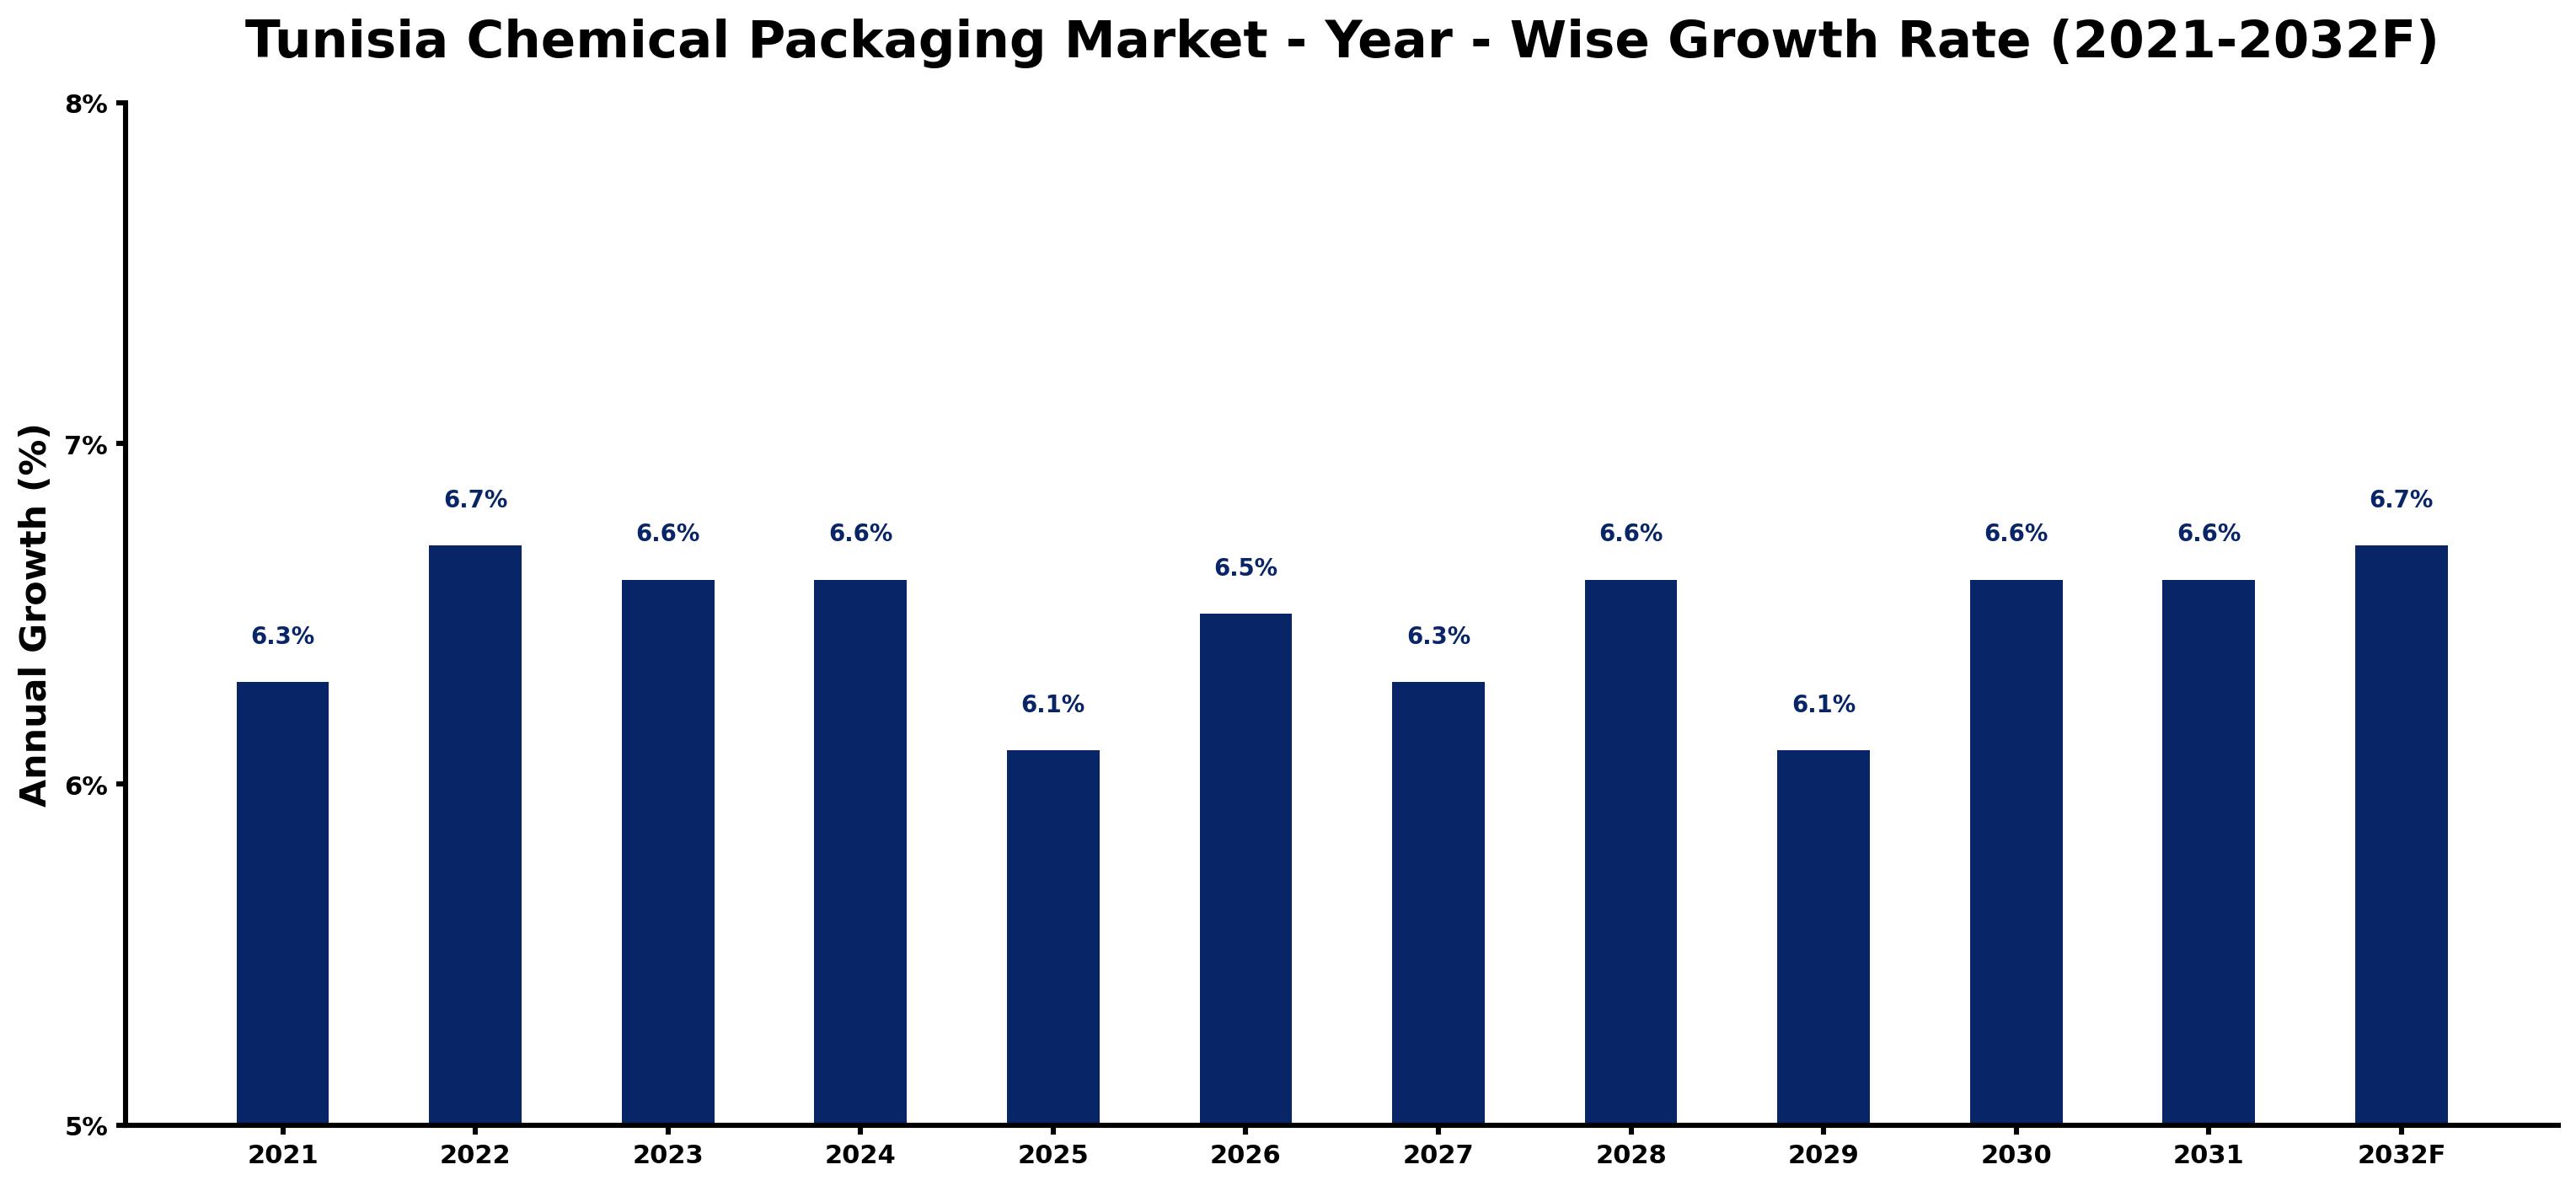
Tunisia Chemical Packaging Market Growth Rate Analysis (2021-2032)
The Tunisia Chemical Packaging Market has displayed stable growth, with increases of 6.3% in 2021 and peaking at 6.7% in 2022. Factors driving this upward trend include expansive industrial growth and an increased emphasis on sustainable packaging solutions, aligning with global energy transition goals. The market maintained a growth rate of 6.6% in both 2023 and 2024, reflecting steady consumer demand and heightened investments in technological advancements. While slight fluctuations to 6.1% are expected in subsequent years due to market saturation and policy adjustments, the sector is anticipated to rebound, achieving 6.7% by 2032, fueled by digitalization and innovations in packaging materials.
Tunisia Chemical Packaging Market Year-wise Growth Rate and Key Drivers
This graph highlights how the Tunisia Chemical Packaging Market has steadily grown over the past five years, supported by major growth factors.
The table below presents the year wise growth rates along with the key drivers influencing the market
| Year | Growth Rate | Major Drivers |
| 2021 | 6.3% | Market recovery followed supply chain disruptions, encouraging local chemical packaging production. |
| 2022 | 6.7% | Increased infrastructure projects spurred demand for specialized chemical packaging solutions. |
| 2023 | 6.6% | Sustainability concerns prompted innovations in biodegradable and recyclable packaging materials. |
| 2024 | 6.6% | International partnerships expanded local manufacturers' access to advanced packaging technologies. |
| 2025 | 6.1% | E-commerce growth necessitated efficient packaging solutions for chemical products distribution. |
| 2026 | 6.5% | Investment in logistics infrastructure enhanced distribution channels for chemical packaging. |
| 2027 | 6.3% | Consumer preferences shifted towards sustainable packaging, influencing manufacturers' product lines. |
| 2028 | 6.6% | Investment in renewable energy sources impacted production processes within the chemical sector. |
| 2029 | 6.1% | Emerging markets within North Africa increased competition in chemical packaging offerings. |
| 2030 | 6.6% | Technological advancements in automation improved manufacturing efficiency for chemical packaging. |
| 2031 | 6.6% | Regulatory frameworks evolved, enforcing stricter standards on packaging materials and safety. |
| 2032 | 6.7% | Focus on circular economy practices transformed product lifecycle management within the industry. |
Note - Market size estimations and growth projections presented in this report are based on 6Wresearch's advanced forecasting approach, validated with industry datasets as of June 2026.
Tunisia Chemical Packaging Market Synopsis
The Tunisia Chemical Packaging Market is projected to reach 6.5% and witness significant growth during the forecast period (2026-2032). This market encompasses a variety of packaging solutions specifically engineered for the safe storage, handling, and transportation of chemicals. Containers, drums, and bottles are designed not only for efficiency but also to comply with stringent safety regulations, thereby reducing environmental impact during chemical distribution.
Tunisia Chemical Packaging Market Growth Drivers
The Tunisia Chemical Packaging Market is experiencing robust growth driven by several factors. Firstly, the increasing demand for safe and effective packaging solutions across multiple industries has become a significant catalyst. Many sectors, including agriculture, pharmaceuticals, and manufacturing, require specialized packaging to manage both hazardous and non-hazardous chemicals securely.
- Technological advancements are pivotal in enhancing packaging materials, offering improved barrier properties and compliance with international safety standards.
- Heightened awareness surrounding environmental issues has led to a growing preference for eco-friendly packaging solutions, thereby driving innovation.
- Regulatory frameworks are tightening, necessitating upgrades in packaging to ensure that materials meet the latest safety and handling regulations.
- As global supply chains evolve, the demand for more efficient logistics and packaging systems to minimize waste and improve safety is rising.
- The trend towards sustainable practices among organizations is creating opportunities for manufacturers focused on developing greener packaging solutions.
Tunisia Chemical Packaging Market Challenges and Restraints
Despite the upward trajectory of the Tunisia Chemical Packaging Market, several challenges may impede growth. High production costs pose significant concern, particularly for small and medium-sized enterprises striving to compete against larger manufacturers. Compliance with stringent regulatory standards related to environmental sustainability and safety can strain resources and operational capabilities.
- Competition from alternative packaging materials, including biodegradable options, is intensifying, forcing traditional chemical packaging suppliers to innovate continuously.
- Limited consumer awareness about the benefits and importance of specialized chemical packaging often leads to underutilization of available products.
- The potential for economic instability can hinder investment in necessary upgrades and innovations within packaging facilities.
- Supply chain disruptions can affect the availability and delivery of raw materials, complicating production processes for packaging solutions.
- As sustainability takes center stage, there exists a pressing need for the industry to pivot towards practices that not only comply with regulations but also meet consumer expectations for eco-friendly products.
Tunisia Chemical Packaging Market Government Investment and Initiatives
Government policies and initiatives play a vital role in shaping the Tunisia Chemical Packaging Market. Regulations focused on safety and environmental sustainability are designed to ensure that chemical packaging adheres to international standards, especially in handling hazardous materials. The government is providing various incentives for manufacturers who adopt eco-friendly materials and technologies, encouraging a shift towards sustainable operations.
- Public spending on infrastructure improvements is aimed at enhancing logistics and distribution networks, benefiting the overall chemical packaging sector.
- Development plans targeting the chemical industry are being implemented to foster a safe and efficient operational environment.
- Collaboration between government entities and industry stakeholders helps to facilitate knowledge sharing and best practices in packaging standards.
- Investment in research and development is being promoted to encourage innovation within the chemical packaging landscape.
- Awareness campaigns are being launched to educate businesses about the importance of specialized chemical packaging and compliance with safety regulations.
Tunisia Chemical Packaging Market Latest Developments (May 2025 - June 2026)
Recent developments in the Tunisia Chemical Packaging Market reflect a period of adaptation and innovation. The industry is witnessing a gradual transition towards materials that not only meet safety guidelines but also address sustainability concerns. There has been an increased emphasis on research and technological advancements aimed at enhancing the durability and eco-friendliness of packaging solutions.
- Significant strides in material science have led to the development of new packaging options that offer better protection and reduced environmental impact.
- The market is increasingly focusing on circular economy initiatives, prompting many manufacturers to explore recyclable and reusable packaging designs.
- Industry conferences and seminars have gained popularity, serving as platforms for stakeholders to exchange insights on regulatory updates and best practices.
- Collaborations between packaging manufacturers and environmental organizations are on the rise, aimed at creating awareness and implementing more sustainable practices.
- Consumer demand for transparency regarding material sourcing and manufacturing processes is prompting businesses to adopt more stringent quality control measures.
Tunisia Chemical Packaging Market - Key Attractiveness of the Report
- 10 Years of Market Numbers
- Historical Data Starting from 2022 to 2025
- Base Year: 2025
- Forecast Data until 2032
- Key Performance Indicators Impacting the Market
- Major Upcoming Developments and Projects
Key Highlights of the Report:
- Tunisia Chemical Packaging Market Outlook
- Market Size of Tunisia Chemical Packaging Market, 2025
- Forecast of Tunisia Chemical Packaging Market, 2032
- Historical Data and Forecast of Tunisia Chemical Packaging Revenues & Volume for the Period 2022-2032F
- Tunisia Chemical Packaging Market Trend Evolution
- Tunisia Chemical Packaging Market Drivers and Challenges
- Tunisia Chemical Packaging Price Trends
- Tunisia Chemical Packaging Porter's Five Forces
- Tunisia Chemical Packaging Industry Life Cycle
- Historical Data and Forecast of Tunisia Chemical Packaging Market Revenues & Volume By Product Types for the Period 2022-2032F
- Historical Data and Forecast of Tunisia Chemical Packaging Market Revenues & Volume By Sacks for the Period 2022-2032F
- Historical Data and Forecast of Tunisia Chemical Packaging Market Revenues & Volume By Drums for the Period 2022-2032F
- Historical Data and Forecast of Tunisia Chemical Packaging Market Revenues & Volume By FIBC for the Period 2022-2032F
- Historical Data and Forecast of Tunisia Chemical Packaging Market Revenues & Volume By Other for the Period 2022-2032F
- Historical Data and Forecast of Tunisia Chemical Packaging Market Revenues & Volume By Applications for the Period 2022-2032F
- Historical Data and Forecast of Tunisia Chemical Packaging Market Revenues & Volume By Pharmaceutical Factory? for the Period 2022-2032F
- Historical Data and Forecast of Tunisia Chemical Packaging Market Revenues & Volume By Laboratory for the Period 2022-2032F
- Historical Data and Forecast of Tunisia Chemical Packaging Market Revenues & Volume By Chemical Plant? for the Period 2022-2032F
- Historical Data and Forecast of Tunisia Chemical Packaging Market Revenues & Volume By Others for the Period 2022-2032F
- Tunisia Chemical Packaging Import Export Trade Statistics
- Market Opportunity Assessment By Product Types
- Market Opportunity Assessment By Applications
- Tunisia Chemical Packaging Top Companies Market Share
- Tunisia Chemical Packaging Competitive Benchmarking By Technical and Operational Parameters
- Tunisia Chemical Packaging Company Profiles
- Tunisia Chemical Packaging Key Strategic Recommendations
Frequently Asked Questions About the Market Study (FAQs):
The growth is primarily driven by the increasing demand for safe and efficient packaging solutions across various industries, alongside advancements in technology that improve packaging design and materials.
Challenges include high production costs, stringent regulatory requirements, and competition from alternative packaging materials, which can impede market growth.
The government is investing in safety regulations, providing incentives for eco-friendly practices, and promoting public spending on infrastructure improvements within the chemical packaging sector.
Companies should focus on innovation, particularly in sustainable packaging solutions, compliance with regulations, and enhancing consumer awareness of the benefits of specialized chemical packaging.
6Wresearch actively monitors the Tunisia Chemical Packaging Market and publishes its comprehensive annual report, highlighting emerging trends, growth drivers, revenue analysis, and forecast outlook. Our insights help businesses to make data-backed strategic decisions with ongoing market dynamics. Our analysts track relevent industries related to the Tunisia Chemical Packaging Market, allowing our clients with actionable intelligence and reliable forecasts tailored to emerging regional needs.
Yes, we provide customisation as per your requirements. To learn more, feel free to contact us on sales@6wresearch.com
1 Executive Summary |
2 Introduction |
2.1 Key Highlights of the Report |
2.2 Report Description |
2.3 Market Scope & Segmentation |
2.4 Research Methodology |
2.5 Assumptions |
3 Tunisia Chemical Packaging Market Overview |
3.1 Tunisia Country Macro Economic Indicators |
3.2 Tunisia Chemical Packaging Market Revenues & Volume, 2022 & 2032F |
3.3 Tunisia Chemical Packaging Market - Industry Life Cycle |
3.4 Tunisia Chemical Packaging Market - Porter's Five Forces |
3.5 Tunisia Chemical Packaging Market Revenues & Volume Share, By Product Types, 2022 & 2032F |
3.6 Tunisia Chemical Packaging Market Revenues & Volume Share, By Applications, 2022 & 2032F |
4 Tunisia Chemical Packaging Market Dynamics |
4.1 Impact Analysis |
4.2 Market Drivers |
4.3 Market Restraints |
5 Tunisia Chemical Packaging Market Trends |
6 Tunisia Chemical Packaging Market, By Types |
6.1 Tunisia Chemical Packaging Market, By Product Types |
6.1.1 Overview and Analysis |
6.1.2 Tunisia Chemical Packaging Market Revenues & Volume, By Product Types, 2022-2032F |
6.1.3 Tunisia Chemical Packaging Market Revenues & Volume, By Sacks, 2022-2032F |
6.1.4 Tunisia Chemical Packaging Market Revenues & Volume, By Drums, 2022-2032F |
6.1.5 Tunisia Chemical Packaging Market Revenues & Volume, By FIBC, 2022-2032F |
6.1.6 Tunisia Chemical Packaging Market Revenues & Volume, By Other, 2022-2032F |
6.2 Tunisia Chemical Packaging Market, By Applications |
6.2.1 Overview and Analysis |
6.2.2 Tunisia Chemical Packaging Market Revenues & Volume, By Pharmaceutical Factory , 2022-2032F |
6.2.3 Tunisia Chemical Packaging Market Revenues & Volume, By Laboratory, 2022-2032F |
6.2.4 Tunisia Chemical Packaging Market Revenues & Volume, By Chemical Plant , 2022-2032F |
6.2.5 Tunisia Chemical Packaging Market Revenues & Volume, By Others, 2022-2032F |
7 Tunisia Chemical Packaging Market Import-Export Trade Statistics |
7.1 Tunisia Chemical Packaging Market Export to Major Countries |
7.2 Tunisia Chemical Packaging Market Imports from Major Countries |
8 Tunisia Chemical Packaging Market Key Performance Indicators |
9 Tunisia Chemical Packaging Market - Opportunity Assessment |
9.1 Tunisia Chemical Packaging Market Opportunity Assessment, By Product Types, 2022 & 2032F |
9.2 Tunisia Chemical Packaging Market Opportunity Assessment, By Applications, 2022 & 2032F |
10 Tunisia Chemical Packaging Market - Competitive Landscape |
10.1 Tunisia Chemical Packaging Market Revenue Share, By Companies, 2025 |
10.2 Tunisia Chemical Packaging Market Competitive Benchmarking, By Operating and Technical Parameters |
11 Company Profiles |
12 Recommendations |
13 Disclaimer |
Global Go To Market Strategy - 2030
Export potential enables firms to identify high-growth global markets with greater confidence by combining advanced trade intelligence with a structured quantitative methodology. The framework analyzes emerging demand trends and country-level import patterns while integrating macroeconomic and trade datasets such as GDP and population forecasts, bilateral import–export flows, tariff structures, elasticity differentials between developed and developing economies, geographic distance, and import demand projections. Using weighted trade values from 2020–2024 as the base period to project country-to-country export potential for 2030, these inputs are operationalized through calculated drivers such as gravity model parameters, tariff impact factors, and projected GDP per-capita growth. Through an analysis of hidden potentials, demand hotspots, and market conditions that are most favorable to success, this method enables firms to focus on target countries, maximize returns, and global expansion with data, backed by accuracy.
By factoring in the projected importer demand gap that is currently unmet and could be potential opportunity, it identifies the potential for the Exporter (Country) among 190 countries, against the general trade analysis, which identifies the biggest importer or exporter.
To discover high-growth global markets and optimize your business strategy:
Click Here
Pricing
- Single User License$ 1,995
- Department License$ 2,400
- Site License$ 3,120
- Global License$ 3,795

Leadership Perspectives from Industry Events
Search
Thought Leadership and Analyst Meet


Our Clients
6WResearch In News
- India Air Conditioner Market Set for Strong Rebound in 2026 After Weather-Led Correction and GST-Driven Recovery: 6Wresearch
- ADAS in India: How Automatic Emergency Braking, Blind Spot Detection & Driver Monitoring are Transforming Road Safety
- Doha a strategic location for EV manufacturing hub: IPA Qatar
- Demand for luxury TVs surging in the GCC, says Samsung
- Empowering Growth: The Thriving Journey of Bangladesh’s Cable Industry
- Demand for luxury TVs surging in the GCC, says Samsung
Latest Reports
- Nicaragua RPG Gaming Market (2026-2032)
- New Zealand RPG Gaming Market (2026-2032)
- Netherlands RPG Gaming Market (2026-2032)
- Nauru RPG Gaming Market (2026-2032)
- Namibia RPG Gaming Market (2026-2032)
- Mozambique RPG Gaming Market (2026-2032)
- Montenegro RPG Gaming Market (2026-2032)
- Mongolia RPG Gaming Market (2026-2032)
- Monaco RPG Gaming Market (2026-2032)
- Micronesia RPG Gaming Market (2026-2032)
Industry Events and Analyst Meet

HIMTEX 2026

India Refining Summit 2026

India EV Show 2026

EV tech India Expo 2026

Auto Tech Asia 2026
Whitepaper
- Middle East & Africa Commercial Security Market Click here to view more.
- Middle East & Africa Fire Safety Systems & Equipment Market Click here to view more.
- GCC Drone Market Click here to view more.
- Middle East Lighting Fixture Market Click here to view more.
- GCC Physical & Perimeter Security Market Click here to view more.