Tunisia Digital Photo Frame Market (2026-2032) | Companies, Analysis, Size, Forecast, Value, Industry, Trends, Outlook, COVID-19 IMPACT, Growth, Revenue & Share
Market Forecast By Product Type (Pan Touch Control Frame, Remote Control Frame), By Size (Standard Frame (4:3), Widescreen Frame (16:9)), By Inch (Up to 7, Between 7 to 15, Above 15), By Power Source (Electricity Power Source, Battery Power Source), By Application (Residential, Commercial) And Competitive Landscape
| Product Code: ETC012374 | Publication Date: Jun 2023 | Product Type: Report | ||
| Publisher: 6Wresearch | Author: Ravi Bhandari | No. of Pages: 70 | No. of Figures: 35 | No. of Tables: 5 |
Tunisia Digital Photo Frame Market Summary
The tunisia digital photo frame market was estimated at USD 754 Million in 2025 and is projected to reach USD 1078 Million by 2032, growing at a CAGR of 6.2% from 2026 to 2032.
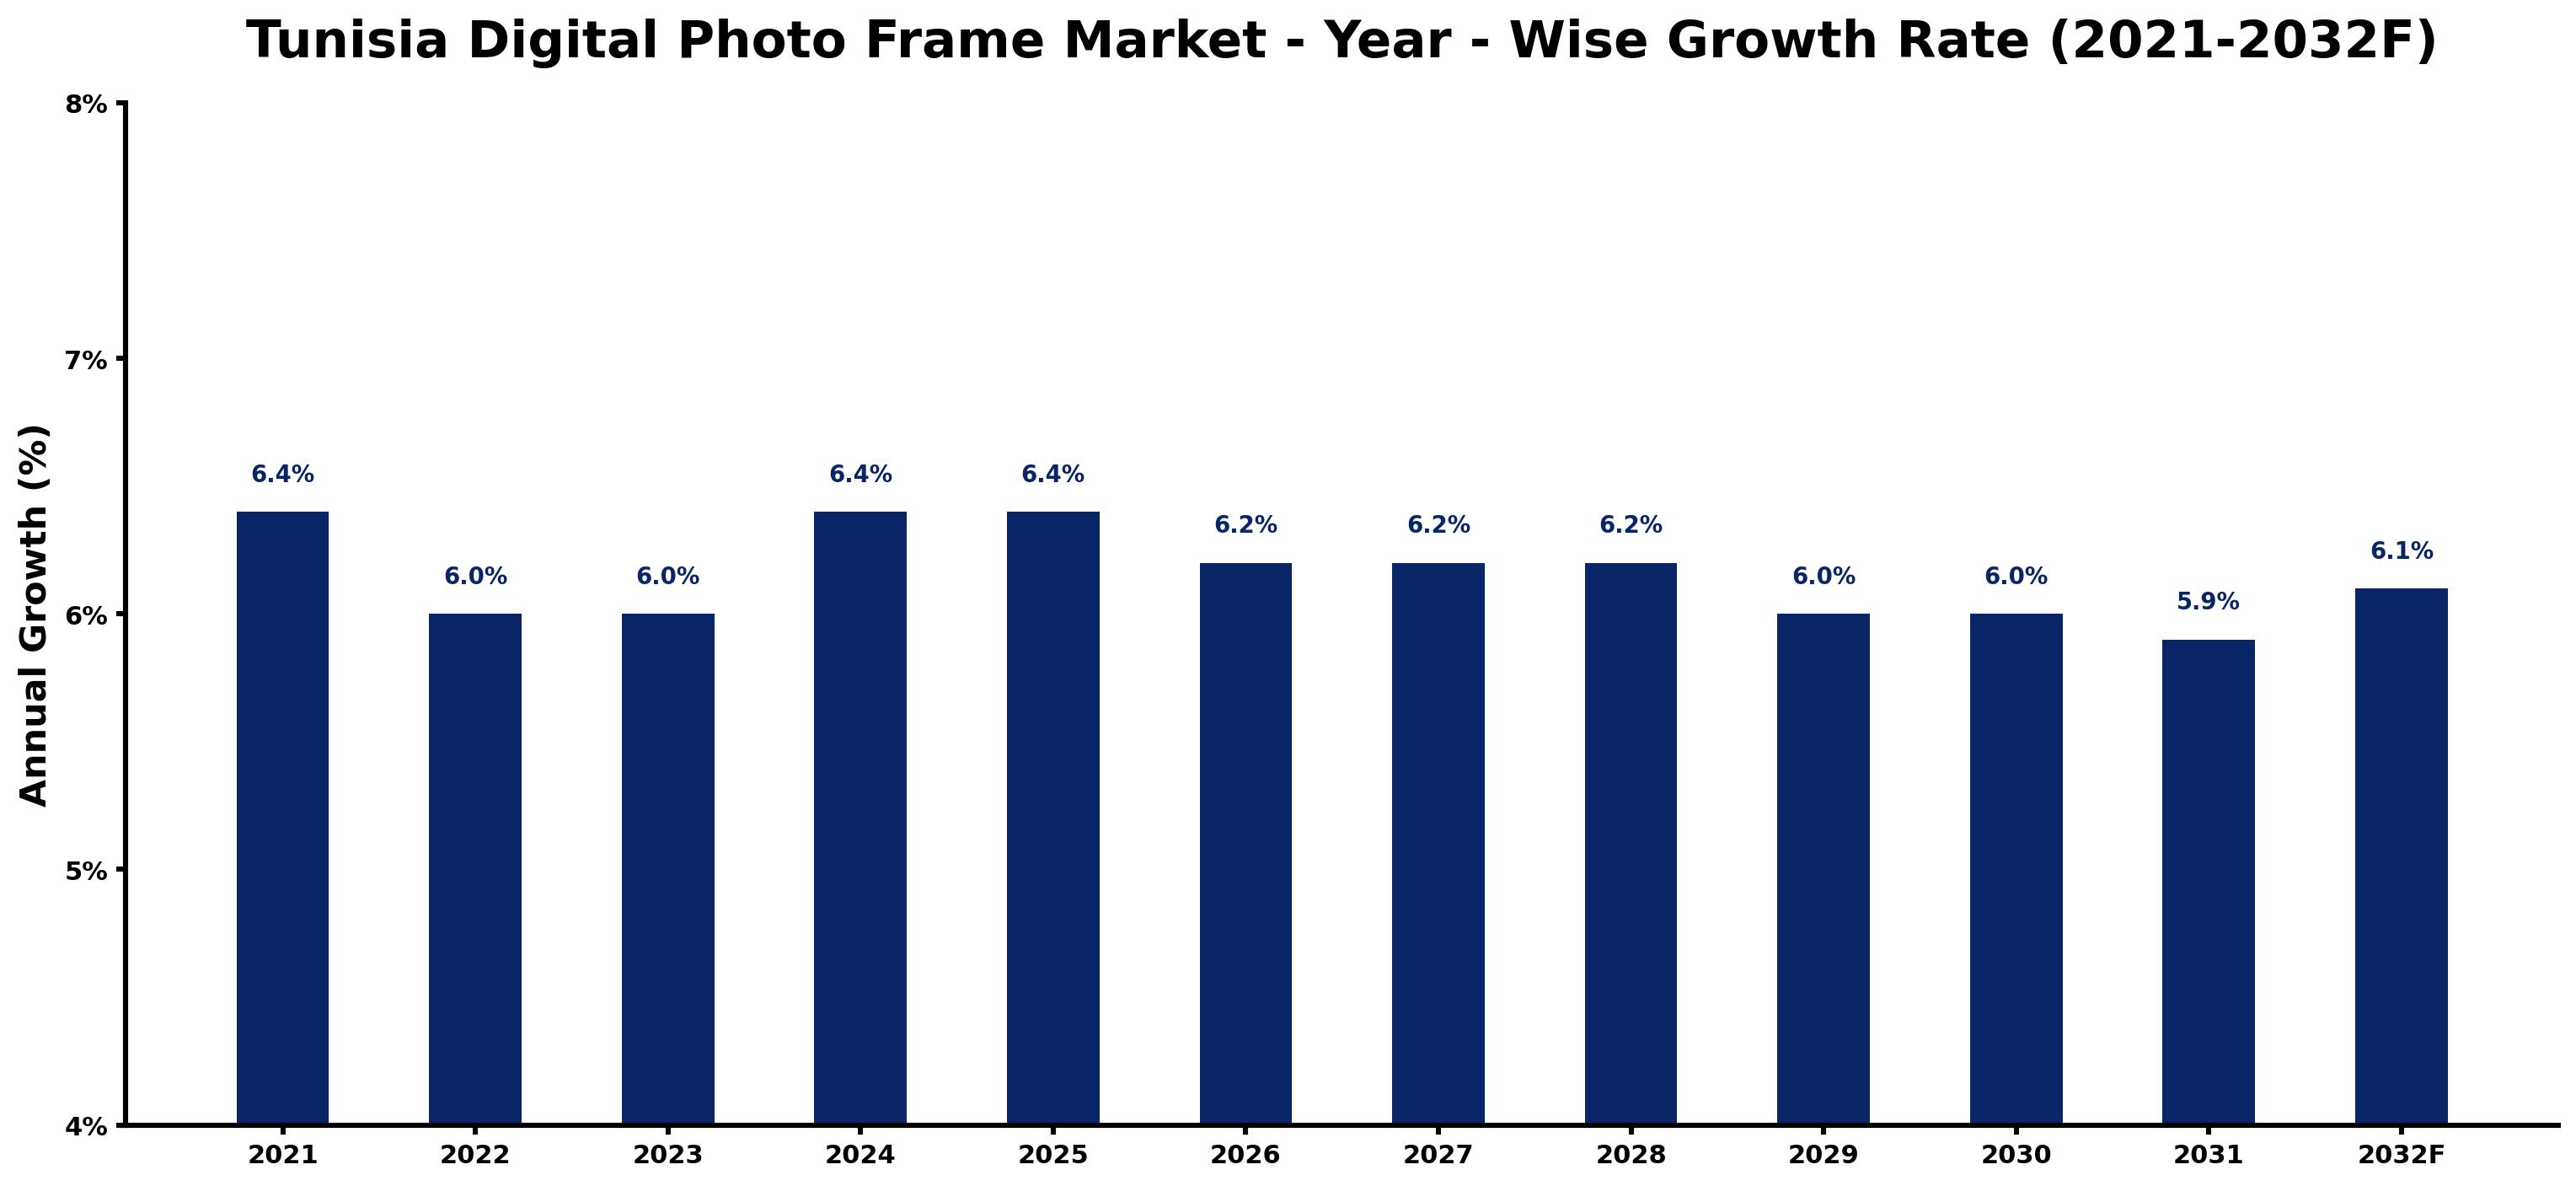
Tunisia Digital Photo Frame Market Growth Rate Analysis (2021-2032)
The Tunisia Digital Photo Frame market has shown steady growth, with a yearly increase of 6.4% in 2021 and maintaining this momentum into 2024. The growth rate stabilizes at 6.0% for 2022 and 2023, reflecting a robust demand driven by rising consumer interest in digitalized home decor and advancements in display technology. Despite slight fluctuations—such as a dip to 5.9% in 2031—growth remains resilient, supported by investments in local manufacturing and infrastructure. The trend towards energy-efficient and feature-rich digital frames aligns with broader digitalization shifts among Tunisian consumers. As the market matures, a projected increase of 6.1% in 2032 indicates sustained investment in innovation and consumer engagement strategies.
Tunisia Digital Photo Frame Market Year-wise Growth Rate and Key Drivers
This graph highlights how the Tunisia Digital Photo Frame Market has steadily grown over the past five years, supported by major growth factors.
The table below presents the year wise growth rates along with the key drivers influencing the market
| Year | Growth Rate | Major Drivers |
| 2021 | 6.4% | Digital photo frames started appealing to households seeking modern home decor solutions. |
| 2022 | 6.0% | Local artists began promoting their works through digital frames in retail spaces. |
| 2023 | 6.0% | Consumer preferences shifted towards personalized gifts, boosting digital photo frame sales. |
| 2024 | 6.4% | Social media trends emphasized visual content, increasing demand for high-resolution displays. |
| 2025 | 6.4% | Emerging e-commerce platforms facilitated easier access to diverse digital photo frame options. |
| 2026 | 6.2% | Family gatherings became more frequent, highlighting the value of displaying cherished memories. |
| 2027 | 6.2% | Technological integration with smart home systems made digital frames more attractive to buyers. |
| 2028 | 6.2% | Advertising campaigns in local markets began showcasing innovative designs and features. |
| 2029 | 6.0% | Urbanization trends contributed to smaller living spaces, driving demand for multifunctional decor. |
| 2030 | 6.0% | Increased disposable incomes allowed consumers to invest in premium digital photo frames. |
| 2031 | 5.9% | Sustainability trends influenced consumers to seek eco-friendly digital frame options. |
| 2032 | 6.1% | Educational institutions adopted digital frames for displaying student achievements and events. |
Note - Market size estimations and growth projections presented in this report are based on 6Wresearch's advanced forecasting approach, validated with industry datasets as of June 2026.
Tunisia Digital Photo Frame Market Synopsis
The Tunisia Digital Photo Frame Market is projected to reach 6.2% and witness significant growth during the forecast period (2026-2032). This growth can be attributed to several factors, including the increasing demand for home entertainment and the convenience of digital gifting options. As technology continues to advance, and with the growing influence of social media, consumers in Tunisia have shifted towards sharing and displaying their photographs in a more dynamic way, moving away from traditional printed formats. Additionally, features such as Wi-Fi connectivity and Bluetooth capabilities are becoming standard in devices, making them particularly appealing to the tech-savvy younger demographic.
Tunisia Digital Photo Frame Market Growth Drivers
Several key factors are propelling the growth of the Tunisia Digital Photo Frame Market. High on the list is the increasing disposable income among consumers, which allows for greater spending on home entertainment products. Furthermore, as lifestyles evolve and the trend of personalizing home decor takes hold, digital photo frames have emerged as a stylish and functional choice for many households.
- The rise of social media platforms enables users to share images effortlessly. This shift in consumer behavior emphasizes the practical necessity of having a digital photo frame that can showcase an evolving collection of memories.
- Technological advancements have led to more user-friendly interfaces and features in digital photo frames, such as touch screens and integration with smart home systems.
- The gifting culture in Tunisia is shifting towards unique and personalized gifts, making digital photo frames an attractive option for special occasions such as weddings, birthdays, and holidays.
- Marketing initiatives and promotional campaigns by vendors are increasing consumer awareness and driving adoption rates, particularly among younger demographics who are more inclined toward digital solutions.
- The rising trend of home entertainment is fueling demand for aesthetically pleasing and technologically sophisticated devices, positioning digital photo frames as ideal additions to modern homes.
Tunisia Digital Photo Frame Market Trends and Opportunities
The evolving preferences of consumers in Tunisia present various trends and opportunities within the digital photo frame market. Recent years have seen a marked shift towards multifunctional devices that cater to the needs of modern users. Digital photo frames that also serve as smart home assistants, displaying not just images but also notifications for weather, news, and social media alerts, are becoming popular.
- There is a growing inclination towards eco-friendly products, with consumers opting for frames made from sustainable materials and energy-efficient technologies.
- As more retail outlets and online platforms begin to sell digital photo frames, increased accessibility is expected to widen the customer base significantly.
- Content-sharing capabilities are improving, allowing users to send images remotely to their frames, thus enhancing the interactivity of the devices.
- The influence of influencers on social media is leading to increased visibility for digital photo frames, fostering a trend where showcasing personal moments digitally is becoming more desirable.
- Collaborations between tech companies and artists to create visually striking frames or curated content are also emerging, providing unique offerings that differentiate products in the market.
Tunisia Digital Photo Frame Market Challenges and Restraints
Despite the promising growth prospects, the Tunisia Digital Photo Frame Market faces several challenges that may impede progress. Consumer skepticism regarding the longevity and durability of digital products can create a barrier to entry for some potential buyers.
- Competition from alternate technologies, such as tablets and smartphones, which can serve similar purposes in displaying photos, could limit market growth.
- Price sensitivity among consumers in Tunisia may lead to a preference for lower-cost alternatives, potentially compromising the adoption of higher-end digital frames.
- Additionally, the need for regular software updates and maintenance of smart features may deter some consumers, who prefer simpler, more straightforward products.
- The availability of counterfeit or low-quality products in the market can undermine consumer trust in digital photo frames as a category.
- Lastly, fluctuations in global supply chains and economic instability could impact the import and availability of high-quality components necessary for manufacturing digital frames.
Tunisia Digital Photo Frame Market Government Investment and Initiatives
Government initiatives play a crucial role in shaping the Tunisia Digital Photo Frame Market. Emerging support for digital technology and innovation is presented through various funding and investment programs aimed at enhancing the local technology sector. Public spending on digital infrastructure and technology education fosters an environment conducive to market growth.
- The government has launched initiatives focusing on technology skills development, which can contribute to a more informed and capable workforce better equipped to contribute to the digital photo frame market.
- Investment in digital literacy campaigns promotes the understanding of digital products, which in turn can drive consumer adoption of digital photo frames.
- Tax incentives for companies that invest in research and development may lead to the introduction of innovative features in digital photo frames.
- Partnerships between the government and private sectors can further encourage the development of local manufacturing capacities for digital products, potentially reducing import costs and improving market competitiveness.
- Furthermore, initiatives to promote tourism may enhance the culture of photography and content-sharing among tourists, indirectly boosting the demand for digital frames as souvenirs or gifts.
Tunisia Digital Photo Frame Market Latest Developments (May 2025 - June 2026)
Recent developments in the Tunisia Digital Photo Frame Market have centered around technological advancements and evolving consumer preferences. The introduction of frames equipped with advanced connectivity options and artificial intelligence capabilities has raised interest among consumers seeking multifunctional devices. Companies are exploring collaborations that allow for seamless integration between digital photo frames and popular social media platforms, making it easier for users to upload and display their images.
- New entries into the market have been observed, with various retailers expanding their product lines to include smart digital photo frames, reflecting trends in consumer electronics.
- Promotional campaigns focused on the unique features of digital photo frames, such as cloud storage and remote access, have been rolled out to educate consumers about their benefits.
- Development in user interface design has led to more intuitive and engaging experiences for users, encouraging higher adoption rates.
- There has been an increase in consumer engagement activities, such as workshops and demonstrations that focus on showcasing the versatility of digital photo frames.
- Finally, collaborations with local artists and photographers have led to the creation of exclusive frame designs and curated content collections, enhancing product appeal.
Tunisia Digital Photo Frame Market - Key Attractiveness of the Report
- 10 Years of Market Numbers
- Historical Data Starting from 2022 to 2025
- Base Year: 2025
- Forecast Data until 2032
- Key Performance Indicators Impacting the Market
- Major Upcoming Developments and Projects
Key Highlights of the Report:
- Tunisia Digital Photo Frame Market Outlook
- Market Size of Tunisia Digital Photo Frame Market, 2025
- Forecast of Tunisia Digital Photo Frame Market, 2032F
- Historical Data and Forecast of Tunisia Digital Photo Frame Revenues & Volume for the Period 2022-2032F
- Tunisia Digital Photo Frame Market Trend Evolution
- Tunisia Digital Photo Frame Market Drivers and Challenges
- Tunisia Digital Photo Frame Price Trends
- Tunisia Digital Photo Frame Porter's Five Forces
- Tunisia Digital Photo Frame Industry Life Cycle
- Historical Data and Forecast of Tunisia Digital Photo Frame Market Revenues & Volume By Product Type for the Period 2022-2032F
- Historical Data and Forecast of Tunisia Digital Photo Frame Market Revenues & Volume By Pan Touch Control Frame for the Period 2022-2032F
- Historical Data and Forecast of Tunisia Digital Photo Frame Market Revenues & Volume By Remote Control Frame for the Period 2022-2032F
- Historical Data and Forecast of Tunisia Digital Photo Frame Market Revenues & Volume By Size for the Period 2022-2032F
- Historical Data and Forecast of Tunisia Digital Photo Frame Market Revenues & Volume By Standard Frame (4:3) for the Period 2022-2032F
- Historical Data and Forecast of Tunisia Digital Photo Frame Market Revenues & Volume By Widescreen Frame (16:9) for the Period 2022-2032F
- Historical Data and Forecast of Tunisia Digital Photo Frame Market Revenues & Volume By Inch for the Period 2022-2032F
- Historical Data and Forecast of Tunisia Digital Photo Frame Market Revenues & Volume By Up to 7 for the Period 2022-2032F
- Historical Data and Forecast of Tunisia Digital Photo Frame Market Revenues & Volume By Between 7 to 15 for the Period 2022-2032F
- Historical Data and Forecast of Tunisia Digital Photo Frame Market Revenues & Volume By Above 15 for the Period 2022-2032F
- Historical Data and Forecast of Tunisia Digital Photo Frame Market Revenues & Volume By Power Source for the Period 2022-2032F
- Historical Data and Forecast of Tunisia Digital Photo Frame Market Revenues & Volume By Electricity Power Source for the Period 2022-2032F
- Historical Data and Forecast of Tunisia Digital Photo Frame Market Revenues & Volume By Battery Power Source for the Period 2022-2032F
- Historical Data and Forecast of Tunisia Digital Photo Frame Market Revenues & Volume By Application for the Period 2022-2032F
- Historical Data and Forecast of Tunisia Digital Photo Frame Market Revenues & Volume By Residential for the Period 2022-2032F
- Historical Data and Forecast of Tunisia Digital Photo Frame Market Revenues & Volume By Commercial for the Period 2022-2032F
- Historical Data and Forecast of Tunisia Digital Photo Frame Market Revenues & Volume By Distribution Channel for the Period 2022-2032F
- Historical Data and Forecast of Tunisia Digital Photo Frame Market Revenues & Volume By Online for the Period 2022-2032F
- Historical Data and Forecast of Tunisia Digital Photo Frame Market Revenues & Volume By Offline for the Period 2022-2032F
- Tunisia Digital Photo Frame Import Export Trade Statistics
- Market Opportunity Assessment By Product Type
- Market Opportunity Assessment By Size
- Market Opportunity Assessment By Inch
- Market Opportunity Assessment By Power Source
- Market Opportunity Assessment By Application
- Market Opportunity Assessment By Distribution Channel
- Tunisia Digital Photo Frame Top Companies Market Share
- Tunisia Digital Photo Frame Competitive Benchmarking By Technical and Operational Parameters
- Tunisia Digital Photo Frame Company Profiles
- Tunisia Digital Photo Frame Key Strategic Recommendations
Frequently Asked Questions About the Market Study (FAQs):
The primary growth drivers include the rising disposable incomes, advancements in technology, and a shift in consumer preferences towards digital solutions for photo sharing and home decoration.
Government investments in digital infrastructure and education initiatives are fostering an environment that promotes innovation and consumer awareness, thereby enhancing market growth.
Challenges include competition from alternative technologies, price sensitivity among consumers, and skepticism regarding the durability and maintenance of digital photo frames.
Stakeholders should watch for trends in multifunctional devices, customization options, and increased appeal through influencer marketing, which are likely to shape the market landscape going forward.
6Wresearch actively monitors the Tunisia Digital Photo Frame Market and publishes its comprehensive annual report, highlighting emerging trends, growth drivers, revenue analysis, and forecast outlook. Our insights help businesses to make data-backed strategic decisions with ongoing market dynamics. Our analysts track relevent industries related to the Tunisia Digital Photo Frame Market, allowing our clients with actionable intelligence and reliable forecasts tailored to emerging regional needs.
Yes, we provide customisation as per your requirements. To learn more, feel free to contact us on sales@6wresearch.com
1 Executive Summary |
2 Introduction |
2.1 Key Highlights of the Report |
2.2 Report Description |
2.3 Market Scope & Segmentation |
2.4 Research Methodology |
2.5 Assumptions |
3 Tunisia Digital Photo Frame Market Overview |
3.1 Tunisia Country Macro Economic Indicators |
3.2 Tunisia Digital Photo Frame Market Revenues & Volume, 2022 & 2032F |
3.3 Tunisia Digital Photo Frame Market - Industry Life Cycle |
3.4 Tunisia Digital Photo Frame Market - Porter's Five Forces |
3.5 Tunisia Digital Photo Frame Market Revenues & Volume Share, By Product Type, 2022 & 2032F |
3.6 Tunisia Digital Photo Frame Market Revenues & Volume Share, By Size, 2022 & 2032F |
3.7 Tunisia Digital Photo Frame Market Revenues & Volume Share, By Inch, 2022 & 2032F |
3.8 Tunisia Digital Photo Frame Market Revenues & Volume Share, By Power Source, 2022 & 2032F |
3.9 Tunisia Digital Photo Frame Market Revenues & Volume Share, By Application, 2022 & 2032F |
3.10 Tunisia Digital Photo Frame Market Revenues & Volume Share, By Distribution Channel, 2022 & 2032F |
4 Tunisia Digital Photo Frame Market Dynamics |
4.1 Impact Analysis |
4.2 Market Drivers |
4.3 Market Restraints |
5 Tunisia Digital Photo Frame Market Trends |
6 Tunisia Digital Photo Frame Market, By Types |
6.1 Tunisia Digital Photo Frame Market, By Product Type |
6.1.1 Overview and Analysis |
6.1.2 Tunisia Digital Photo Frame Market Revenues & Volume, By Product Type, 2022-2032F |
6.1.3 Tunisia Digital Photo Frame Market Revenues & Volume, By Pan Touch Control Frame, 2022-2032F |
6.1.4 Tunisia Digital Photo Frame Market Revenues & Volume, By Remote Control Frame, 2022-2032F |
6.2 Tunisia Digital Photo Frame Market, By Size |
6.2.1 Overview and Analysis |
6.2.2 Tunisia Digital Photo Frame Market Revenues & Volume, By Standard Frame (4:3), 2022-2032F |
6.2.3 Tunisia Digital Photo Frame Market Revenues & Volume, By Widescreen Frame (16:9), 2022-2032F |
6.3 Tunisia Digital Photo Frame Market, By Inch |
6.3.1 Overview and Analysis |
6.3.2 Tunisia Digital Photo Frame Market Revenues & Volume, By Up to 7, 2022-2032F |
6.3.3 Tunisia Digital Photo Frame Market Revenues & Volume, By Between 7 to 15, 2022-2032F |
6.3.4 Tunisia Digital Photo Frame Market Revenues & Volume, By Above 15, 2022-2032F |
6.4 Tunisia Digital Photo Frame Market, By Power Source |
6.4.1 Overview and Analysis |
6.4.2 Tunisia Digital Photo Frame Market Revenues & Volume, By Electricity Power Source, 2022-2032F |
6.4.3 Tunisia Digital Photo Frame Market Revenues & Volume, By Battery Power Source, 2022-2032F |
6.5 Tunisia Digital Photo Frame Market, By Application |
6.5.1 Overview and Analysis |
6.5.2 Tunisia Digital Photo Frame Market Revenues & Volume, By Residential, 2022-2032F |
6.5.3 Tunisia Digital Photo Frame Market Revenues & Volume, By Commercial, 2022-2032F |
6.6 Tunisia Digital Photo Frame Market, By Distribution Channel |
6.6.1 Overview and Analysis |
6.6.2 Tunisia Digital Photo Frame Market Revenues & Volume, By Online, 2022-2032F |
6.6.3 Tunisia Digital Photo Frame Market Revenues & Volume, By Offline, 2022-2032F |
7 Tunisia Digital Photo Frame Market Import-Export Trade Statistics |
7.1 Tunisia Digital Photo Frame Market Export to Major Countries |
7.2 Tunisia Digital Photo Frame Market Imports from Major Countries |
8 Tunisia Digital Photo Frame Market Key Performance Indicators |
9 Tunisia Digital Photo Frame Market - Opportunity Assessment |
9.1 Tunisia Digital Photo Frame Market Opportunity Assessment, By Product Type, 2022 & 2032F |
9.2 Tunisia Digital Photo Frame Market Opportunity Assessment, By Size, 2022 & 2032F |
9.3 Tunisia Digital Photo Frame Market Opportunity Assessment, By Inch, 2022 & 2032F |
9.4 Tunisia Digital Photo Frame Market Opportunity Assessment, By Power Source, 2022 & 2032F |
9.5 Tunisia Digital Photo Frame Market Opportunity Assessment, By Application, 2022 & 2032F |
9.6 Tunisia Digital Photo Frame Market Opportunity Assessment, By Distribution Channel, 2022 & 2032F |
10 Tunisia Digital Photo Frame Market - Competitive Landscape |
10.1 Tunisia Digital Photo Frame Market Revenue Share, By Companies, 2025 |
10.2 Tunisia Digital Photo Frame Market Competitive Benchmarking, By Operating and Technical Parameters |
11 Company Profiles |
12 Recommendations |
13 Disclaimer |
Global Go To Market Strategy - 2030
Export potential enables firms to identify high-growth global markets with greater confidence by combining advanced trade intelligence with a structured quantitative methodology. The framework analyzes emerging demand trends and country-level import patterns while integrating macroeconomic and trade datasets such as GDP and population forecasts, bilateral import–export flows, tariff structures, elasticity differentials between developed and developing economies, geographic distance, and import demand projections. Using weighted trade values from 2020–2024 as the base period to project country-to-country export potential for 2030, these inputs are operationalized through calculated drivers such as gravity model parameters, tariff impact factors, and projected GDP per-capita growth. Through an analysis of hidden potentials, demand hotspots, and market conditions that are most favorable to success, this method enables firms to focus on target countries, maximize returns, and global expansion with data, backed by accuracy.
By factoring in the projected importer demand gap that is currently unmet and could be potential opportunity, it identifies the potential for the Exporter (Country) among 190 countries, against the general trade analysis, which identifies the biggest importer or exporter.
To discover high-growth global markets and optimize your business strategy:
Click Here
Pricing
- Single User License$ 1,995
- Department License$ 2,400
- Site License$ 3,120
- Global License$ 3,795

Leadership Perspectives from Industry Events
Search
Thought Leadership and Analyst Meet


Our Clients
6WResearch In News
- India Air Conditioner Market Set for Strong Rebound in 2026 After Weather-Led Correction and GST-Driven Recovery: 6Wresearch
- ADAS in India: How Automatic Emergency Braking, Blind Spot Detection & Driver Monitoring are Transforming Road Safety
- Doha a strategic location for EV manufacturing hub: IPA Qatar
- Demand for luxury TVs surging in the GCC, says Samsung
- Empowering Growth: The Thriving Journey of Bangladesh’s Cable Industry
- Demand for luxury TVs surging in the GCC, says Samsung
Latest Reports
- Nicaragua RPG Gaming Market (2026-2032)
- New Zealand RPG Gaming Market (2026-2032)
- Netherlands RPG Gaming Market (2026-2032)
- Nauru RPG Gaming Market (2026-2032)
- Namibia RPG Gaming Market (2026-2032)
- Mozambique RPG Gaming Market (2026-2032)
- Montenegro RPG Gaming Market (2026-2032)
- Mongolia RPG Gaming Market (2026-2032)
- Monaco RPG Gaming Market (2026-2032)
- Micronesia RPG Gaming Market (2026-2032)
Industry Events and Analyst Meet

HIMTEX 2026

India Refining Summit 2026

India EV Show 2026

EV tech India Expo 2026

Auto Tech Asia 2026
Whitepaper
- Middle East & Africa Commercial Security Market Click here to view more.
- Middle East & Africa Fire Safety Systems & Equipment Market Click here to view more.
- GCC Drone Market Click here to view more.
- Middle East Lighting Fixture Market Click here to view more.
- GCC Physical & Perimeter Security Market Click here to view more.