Tunisia Potassium permanganate Market (2026-2032) Outlook | Revenue, Share, Value, Growth, Size, Industry, Trends, Companies, Forecast & Analysis
Market Forecast By Grade (Free Flowing Grade, Technical Grade, Pharmaceutical Grade), By Application (Water Treatment, Waste Water Treatment, Chemicals Manufacturing, Aquaculture, Metal Processing, Air and Gas Purification, Others) And Competitive Landscape
| Product Code: ETC091213 | Publication Date: Jun 2021 | Updated Date: Jun 2026 | Product Type: Report | |
| Publisher: 6Wresearch | Author: Ravi Bhandari | No. of Pages: 70 | No. of Figures: 35 | No. of Tables: 5 |
Tunisia Potassium permanganate Market Size, Share & Growth Rate
The Tunisia Potassium permanganate Market was estimated at USD 433 Million in 2025 and is projected to reach USD 598 Million by 2032, growing at a CAGR of 4.7% from 2026 to 2032. This growth trajectory is largely fueled by heightened awareness regarding water purification and sanitation standards, particularly in the industrial and healthcare sectors. As Tunisia continues to modernize its water treatment facilities and enhance healthcare quality, the demand for potassium permanganate is anticipated to rise significantly.
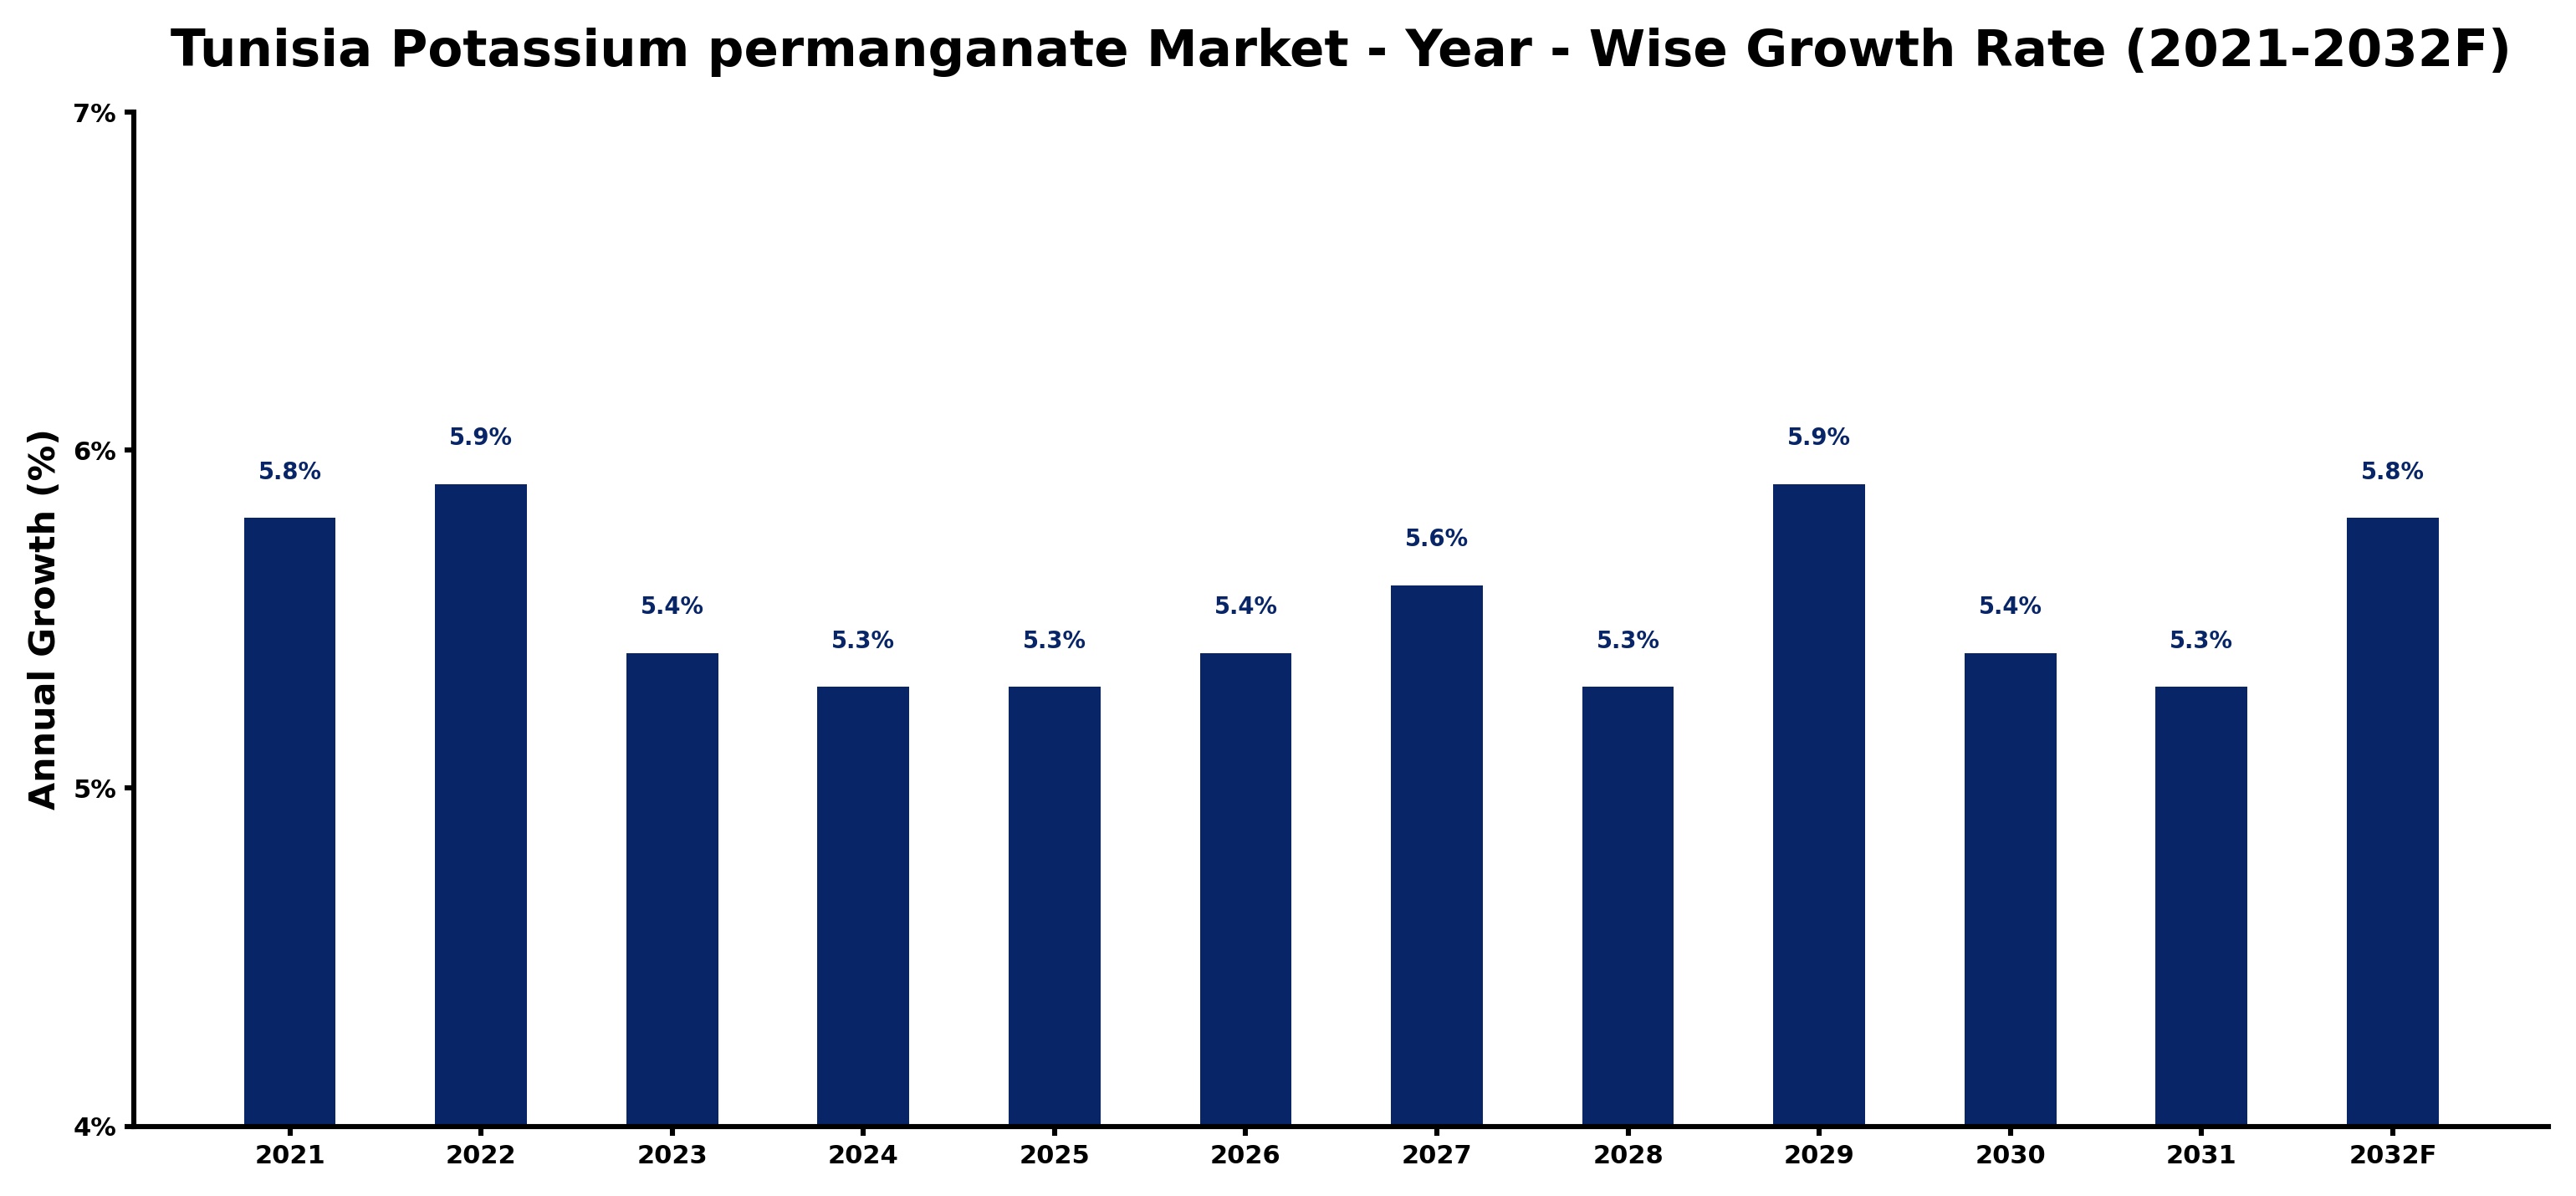
Tunisia Potassium permanganate Market Growth Rate Analysis (2021-2032)
The Tunisian potassium permanganate market has exhibited stable growth rates across recent years, characterized by a 5.8% increase in 2021, followed by 5.9% in 2022. As consumer demand for this versatile chemical grows, particularly in the sectors of water treatment and agriculture, the market witnessed a slight dip to 5.4% in 2023, attributed to fluctuating raw material prices. However, a resurgence is expected as investments in infrastructure and digitalization streamline production processes. This recovery is projected to stabilize at around 5.3% to 5.4% through 2025, with potential spikes of 5.9% anticipated in subsequent years through 2032, driven by ongoing industrial advancements and greater environmental regulations enhancing its applications.
Tunisia Potassium permanganate Market Year-wise Growth Rate and Key Drivers
This graph highlights how the Tunisia Potassium permanganate Market has steadily grown over the past five years, supported by major growth factors.
The table below presents the year‑wise growth rates along with the key drivers influencing the market
| Year | Growth Rate | Major Drivers |
| 2021 | 5.8% | New manufacturing facility boosts local potassium permanganate production capacity |
| 2022 | 5.9% | Domestic chemical manufacturing investments boosted potassium permanganate production capacity |
| 2023 | 5.4% | New manufacturing plants boost domestic potassium permanganate production capacity |
| 2024 | 5.3% | Regional chemical production expansions boost potassium permanganate supply chain efficiency |
| 2025 | 5.3% | Technology upgrades in chemical plants boosted potassium permanganate output |
| 2026 | 5.4% | Local chemical production upgrades boosted potassium permanganate supply capacity |
| 2027 | 5.6% | Innovative processing techniques enhanced potassium permanganate production efficiency |
| 2028 | 5.3% | Improved local mining operations boosted potassium permanganate production capacity |
| 2029 | 5.9% | Export contracts boosted local production of potassium permanganate |
| 2030 | 5.4% | Production efficiency upgrades bolstered potassium permanganate output levels |
| 2031 | 5.3% | Local wastewater treatment upgrades drove potassium permanganate demand increase |
| 2032 | 5.8% | Potassium permanganate demand drives investment in local chemical production |
Note - Market size estimations and growth projections presented in this report are based on 6Wresearch’s advanced forecasting approach, validated with industry datasets as of June 2026.
Tunisia Potassium permanganate Market Synopsis
In Tunisia, potassium permanganate serves as a crucial agent for water treatment processes, reflecting the country’s commitment to improving water quality. The chemical’s applications extend into medical disinfection, highlighting its multifaceted role in ensuring public health.
The market is also witnessing a strong demand from various industries engaged in chemical synthesis, where potassium permanganate acts as an oxidizing agent. This diverse applicability underscores the chemical’s importance in the Tunisian economy and contributes to its projected market growth.
Tunisia Potassium permanganate Market Key Takeaways
- The market is projected to reach USD 598 Million by 2032, reflecting a growing focus on sanitation and water treatment.
- Rising industrial and healthcare sector demands are driving the consumption of potassium permanganate.
- Technological advancements in production processes are key to meeting increasing regulatory compliance.
- Volatility in raw material pricing poses challenges but also opportunities for local production initiatives.
- Government policies are steering the market towards more sustainable practices in production and usage.
Evaluation of Restraints in Tunisia Potassium permanganate Market
Despite the promising growth outlook, the Tunisia potassium permanganate market faces several restraints. The availability of raw materials necessary for production can be inconsistent, leading to pricing volatility that impacts manufacturers and end-users alike. Furthermore, navigating the complex regulatory landscape associated with water treatment and chemical applications necessitates ongoing investments in technology and processes. Compliance with both local and international standards is crucial, as any failure to adapt can result in legal ramifications and decreased market competitiveness.
Tunisia Potassium permanganate Market Trends
Current trends in the Tunisian market indicate a growing emphasis on sustainable production techniques. Companies are increasingly investing in innovative technologies to reduce waste and enhance efficiency. Additionally, there is a heightened focus on the integration of potassium permanganate in advanced water treatment systems, which offer better purification capabilities and align with global environmental initiatives.
Moreover, the medical sector is adapting new disinfection protocols that rely on potassium permanganate, creating fresh avenues for market growth. The interplay of industrial demand and healthcare needs shapes an evolving landscape that is ripe for investment and innovation.
Tunisia Potassium permanganate Market Opportunities
As Tunisia focuses on improving its water and sanitation infrastructure, significant opportunities arise for businesses involved in the potassium permanganate market. The push towards modernized water treatment facilities presents a chance to expand production capacities and introduce cutting-edge purification technologies. Additionally, as the healthcare sector prioritizes sanitation, there is potential for specialized formulations of potassium permanganate tailored to meet specific disinfection needs, thereby enhancing market versatility.
Government Initiatives in the Tunisia Potassium permanganate Market
Government initiatives in Tunisia are aimed at strengthening industrial regulations and implementing safety standards that are conducive to market growth. Policies focusing on environmental compliance have led to technological advancements that support sustainable production practices. These efforts not only aim to improve the overall quality of potassium permanganate but also encourage innovation that aligns with global sustainability goals.
Future Insights of the Tunisia Potassium permanganate Market
Looking forward to the period from 2026 to 2032, the Tunisia potassium permanganate market is anticipated to witness robust growth driven by regulatory changes and increasing environmental awareness. The adoption of innovative purification technologies, coupled with the expanding healthcare sector, will likely create a favorable environment for both existing and new market participants. As businesses align their strategies with the evolving landscape of regulatory compliance and sustainability, the market will emerge stronger and more resilient.
Tunisia Potassium permanganate Market Latest Developments (May 2025 - June 2026)
Recent developments in the Tunisia potassium permanganate market indicate a shift toward enhanced production practices. Industry participants are increasingly adopting green technologies that minimize environmental impact while maximizing efficiency. Furthermore, collaborations among stakeholders are gaining traction to streamline supply chains and ensure product availability amid fluctuating global economic conditions. The focus on sustainable practices is paving the way for new partnerships aimed at fostering innovation and market resilience.
Tunisia Potassium permanganate Market - Key Attractiveness of the Report
- 10 Years of Market Numbers
- Historical Data Starting from 2022 to 2025
- Base Year: 2025
- Forecast Data until 2032
- Key Performance Indicators Impacting the Market
- Major Upcoming Developments and Projects
Key Highlights of the Report:
- Tunisia Potassium permanganate Market Outlook
- Market Size of Tunisia Potassium permanganate Market, 2025
- Forecast of Tunisia Potassium permanganate Market, 2032
- Historical Data and Forecast of Tunisia Potassium permanganate Revenues & Volume for the Period 2022-2032F
- Tunisia Potassium permanganate Market Trend Evolution
- Tunisia Potassium permanganate Market Drivers and Challenges
- Tunisia Potassium permanganate Price Trends
- Tunisia Potassium permanganate Porter's Five Forces
- Tunisia Potassium permanganate Industry Life Cycle
- Historical Data and Forecast of Tunisia Potassium permanganate Market Revenues & Volume By Grade for the Period 2022-2032F
- Historical Data and Forecast of Tunisia Potassium permanganate Market Revenues & Volume By Free Flowing Grade for the Period 2022-2032F
- Historical Data and Forecast of Tunisia Potassium permanganate Market Revenues & Volume By Technical Grade for the Period 2022-2032F
- Historical Data and Forecast of Tunisia Potassium permanganate Market Revenues & Volume By Pharmaceutical Grade for the Period 2022-2032F
- Historical Data and Forecast of Tunisia Potassium permanganate Market Revenues & Volume By Application for the Period 2022-2032F
- Historical Data and Forecast of Tunisia Potassium permanganate Market Revenues & Volume By Water Treatment for the Period 2022-2032F
- Historical Data and Forecast of Tunisia Potassium permanganate Market Revenues & Volume By Waste Water Treatment for the Period 2022-2032F
- Historical Data and Forecast of Tunisia Potassium permanganate Market Revenues & Volume By Chemicals Manufacturing for the Period 2022-2032F
- Historical Data and Forecast of Tunisia Potassium permanganate Market Revenues & Volume By Aquaculture for the Period 2022-2032F
- Historical Data and Forecast of Tunisia Potassium permanganate Market Revenues & Volume By Metal Processing for the Period 2022-2032F
- Historical Data and Forecast of Tunisia Potassium permanganate Market Revenues & Volume By Air and Gas Purification for the Period 2022-2032F
- Historical Data and Forecast of Tunisia Potassium permanganate Market Revenues & Volume By Others for the Period 2022-2032F
- Tunisia Potassium permanganate Import Export Trade Statistics
- Market Opportunity Assessment By Grade
- Market Opportunity Assessment By Application
- Tunisia Potassium permanganate Top Companies Market Share
- Tunisia Potassium permanganate Competitive Benchmarking By Technical and Operational Parameters
- Tunisia Potassium permanganate Company Profiles
- Tunisia Potassium permanganate Key Strategic Recommendations
Tunisia Potassium permanganate Market - Frequently Asked Questions
The market is expected to grow from an estimated USD 433 Million in 2025 to USD 598 Million by 2032, demonstrating a CAGR of 4.7% from 2026 to 2032.
Key applications include water treatment, chemical synthesis, and medical disinfection, all of which contribute significantly to market demand.
Yes, government policies focus on industrial safety standards and environmental compliance, which are vital for the sustainable production of potassium permanganate.
Manufacturers contend with issues such as the availability of raw materials, pricing volatility, and the need for ongoing technological investments to meet regulatory standards.
The healthcare sector’s growing emphasis on sanitation and disinfection is increasing the demand for potassium permanganate, as it is effective for medical disinfection practices.
6Wresearch actively monitors the Tunisia Potassium permanganate Market and publishes its comprehensive annual report, highlighting emerging trends, growth drivers, revenue analysis, and forecast outlook. Our insights help businesses to make data-backed strategic decisions with ongoing market dynamics. Our analysts track relevent industries related to the Tunisia Potassium permanganate Market, allowing our clients with actionable intelligence and reliable forecasts tailored to emerging regional needs.
Yes, we provide customisation as per your requirements. To learn more, feel free to contact us on sales@6wresearch.com
1 Executive Summary |
2 Introduction |
2.1 Key Highlights of the Report |
2.2 Report Description |
2.3 Market Scope & Segmentation |
2.4 Research Methodology |
2.5 Assumptions |
3 Tunisia Potassium permanganate Market Overview |
3.1 Tunisia Country Macro Economic Indicators |
3.2 Tunisia Potassium permanganate Market Revenues & Volume, 2022 & 2032F |
3.3 Tunisia Potassium permanganate Market - Industry Life Cycle |
3.4 Tunisia Potassium permanganate Market - Porter's Five Forces |
3.5 Tunisia Potassium permanganate Market Revenues & Volume Share, By Grade, 2022 & 2032F |
3.6 Tunisia Potassium permanganate Market Revenues & Volume Share, By Form, 2022 & 2032F |
4 Tunisia Potassium permanganate Market Dynamics |
4.1 Impact Analysis |
4.2 Market Drivers |
4.3 Market Restraints |
5 Tunisia Potassium permanganate Market Trends |
6 Tunisia Potassium permanganate Market, By Types |
6.1 Tunisia Potassium permanganate Market, By Grade |
6.1.1 Overview and Analysis |
6.1.2 Tunisia Potassium permanganate Market Revenues & Volume, By Grade, 2022-2032F |
6.1.3 Tunisia Potassium permanganate Market Revenues & Volume, By Free Flowing Grade, 2022-2032F |
6.1.4 Tunisia Potassium permanganate Market Revenues & Volume, By Technical Grade, 2022-2032F |
6.1.5 Tunisia Potassium permanganate Market Revenues & Volume, By Pharmaceutical Grade, 2022-2032F |
6.2 Tunisia Potassium permanganate Market, By Application |
6.2.1 Overview and Analysis |
6.2.2 Tunisia Potassium permanganate Market Revenues & Volume, By Water Treatment, 2022-2032F |
6.2.3 Tunisia Potassium permanganate Market Revenues & Volume, By Waste Water Treatment, 2022-2032F |
6.2.4 Tunisia Potassium permanganate Market Revenues & Volume, By Chemicals Manufacturing, 2022-2032F |
6.2.5 Tunisia Potassium permanganate Market Revenues & Volume, By Aquaculture, 2022-2032F |
6.2.6 Tunisia Potassium permanganate Market Revenues & Volume, By Metal Processing, 2022-2032F |
6.2.7 Tunisia Potassium permanganate Market Revenues & Volume, By Air and Gas Purification, 2022-2032F |
7 Tunisia Potassium permanganate Market Import-Export Trade Statistics |
7.1 Tunisia Potassium permanganate Market Export to Major Countries |
7.2 Tunisia Potassium permanganate Market Imports from Major Countries |
8 Tunisia Potassium permanganate Market Key Performance Indicators |
9 Tunisia Potassium permanganate Market - Opportunity Assessment |
9.1 Tunisia Potassium permanganate Market Opportunity Assessment, By Grade, 2022 & 2032F |
9.2 Tunisia Potassium permanganate Market Opportunity Assessment, By Application, 2022 & 2032F |
10 Tunisia Potassium permanganate Market - Competitive Landscape |
10.1 Tunisia Potassium permanganate Market Revenue Share, By Companies, 2025 |
10.2 Tunisia Potassium permanganate Market Competitive Benchmarking, By Operating and Technical Parameters |
11 Company Profiles |
12 Recommendations |
13 Disclaimer |
Global Go To Market Strategy - 2030
Export potential enables firms to identify high-growth global markets with greater confidence by combining advanced trade intelligence with a structured quantitative methodology. The framework analyzes emerging demand trends and country-level import patterns while integrating macroeconomic and trade datasets such as GDP and population forecasts, bilateral import–export flows, tariff structures, elasticity differentials between developed and developing economies, geographic distance, and import demand projections. Using weighted trade values from 2020–2024 as the base period to project country-to-country export potential for 2030, these inputs are operationalized through calculated drivers such as gravity model parameters, tariff impact factors, and projected GDP per-capita growth. Through an analysis of hidden potentials, demand hotspots, and market conditions that are most favorable to success, this method enables firms to focus on target countries, maximize returns, and global expansion with data, backed by accuracy.
By factoring in the projected importer demand gap that is currently unmet and could be potential opportunity, it identifies the potential for the Exporter (Country) among 190 countries, against the general trade analysis, which identifies the biggest importer or exporter.
To discover high-growth global markets and optimize your business strategy:
Click Here
Pricing
- Single User License$ 1,995
- Department License$ 2,400
- Site License$ 3,120
- Global License$ 3,795

Leadership Perspectives from Industry Events
Search
Thought Leadership and Analyst Meet


Our Clients
6WResearch In News
- India Air Conditioner Market Set for Strong Rebound in 2026 After Weather-Led Correction and GST-Driven Recovery: 6Wresearch
- ADAS in India: How Automatic Emergency Braking, Blind Spot Detection & Driver Monitoring are Transforming Road Safety
- Doha a strategic location for EV manufacturing hub: IPA Qatar
- Demand for luxury TVs surging in the GCC, says Samsung
- Empowering Growth: The Thriving Journey of Bangladesh’s Cable Industry
- Demand for luxury TVs surging in the GCC, says Samsung
Latest Reports
- Nicaragua RPG Gaming Market (2026-2032)
- New Zealand RPG Gaming Market (2026-2032)
- Netherlands RPG Gaming Market (2026-2032)
- Nauru RPG Gaming Market (2026-2032)
- Namibia RPG Gaming Market (2026-2032)
- Mozambique RPG Gaming Market (2026-2032)
- Montenegro RPG Gaming Market (2026-2032)
- Mongolia RPG Gaming Market (2026-2032)
- Monaco RPG Gaming Market (2026-2032)
- Micronesia RPG Gaming Market (2026-2032)
Industry Events and Analyst Meet

HIMTEX 2026

India Refining Summit 2026

India EV Show 2026

EV tech India Expo 2026

Auto Tech Asia 2026
Whitepaper
- Middle East & Africa Commercial Security Market Click here to view more.
- Middle East & Africa Fire Safety Systems & Equipment Market Click here to view more.
- GCC Drone Market Click here to view more.
- Middle East Lighting Fixture Market Click here to view more.
- GCC Physical & Perimeter Security Market Click here to view more.