Tunisia Vegetable Fats Market Outlook | COVID-19 IMPACT, Value, Analysis, Share, Revenue, Growth, Companies, Size, Trends, Industry & Forecast
Market Forecast By Type (Saturated, Unsaturated, Trans), By Product (Sunflower, Coconut, Soybean, Palm Oil, Canola, Groundnut, Palm Kernel, Others), By Application (Food, Industrial, Others) And Competitive Landscape
| Product Code: ETC225534 | Publication Date: Aug 2022 | Updated Date: Jul 2026 | Product Type: Market Research Report | |
| Publisher: 6Wresearch | Author: Ravi Bhandari | No. of Pages: 75 | No. of Figures: 35 | No. of Tables: 20 |
Tunisia Vegetable Fats Market Size, Share & Growth Rate
The Tunisia Vegetable Fats Market was estimated at USD 408 Million in 2025 and is projected to reach USD 549 Million by 2032, growing at a CAGR of 4.3% from 2026 to 2032. This growth trajectory is primarily driven by the expansion of the food processing industry and a noticeable shift in consumer preferences towards healthier, plant-based dietary options. Moreover, technological advancements in food processing and favorable government initiatives further support the increasing demand for vegetable fats in Tunisia.
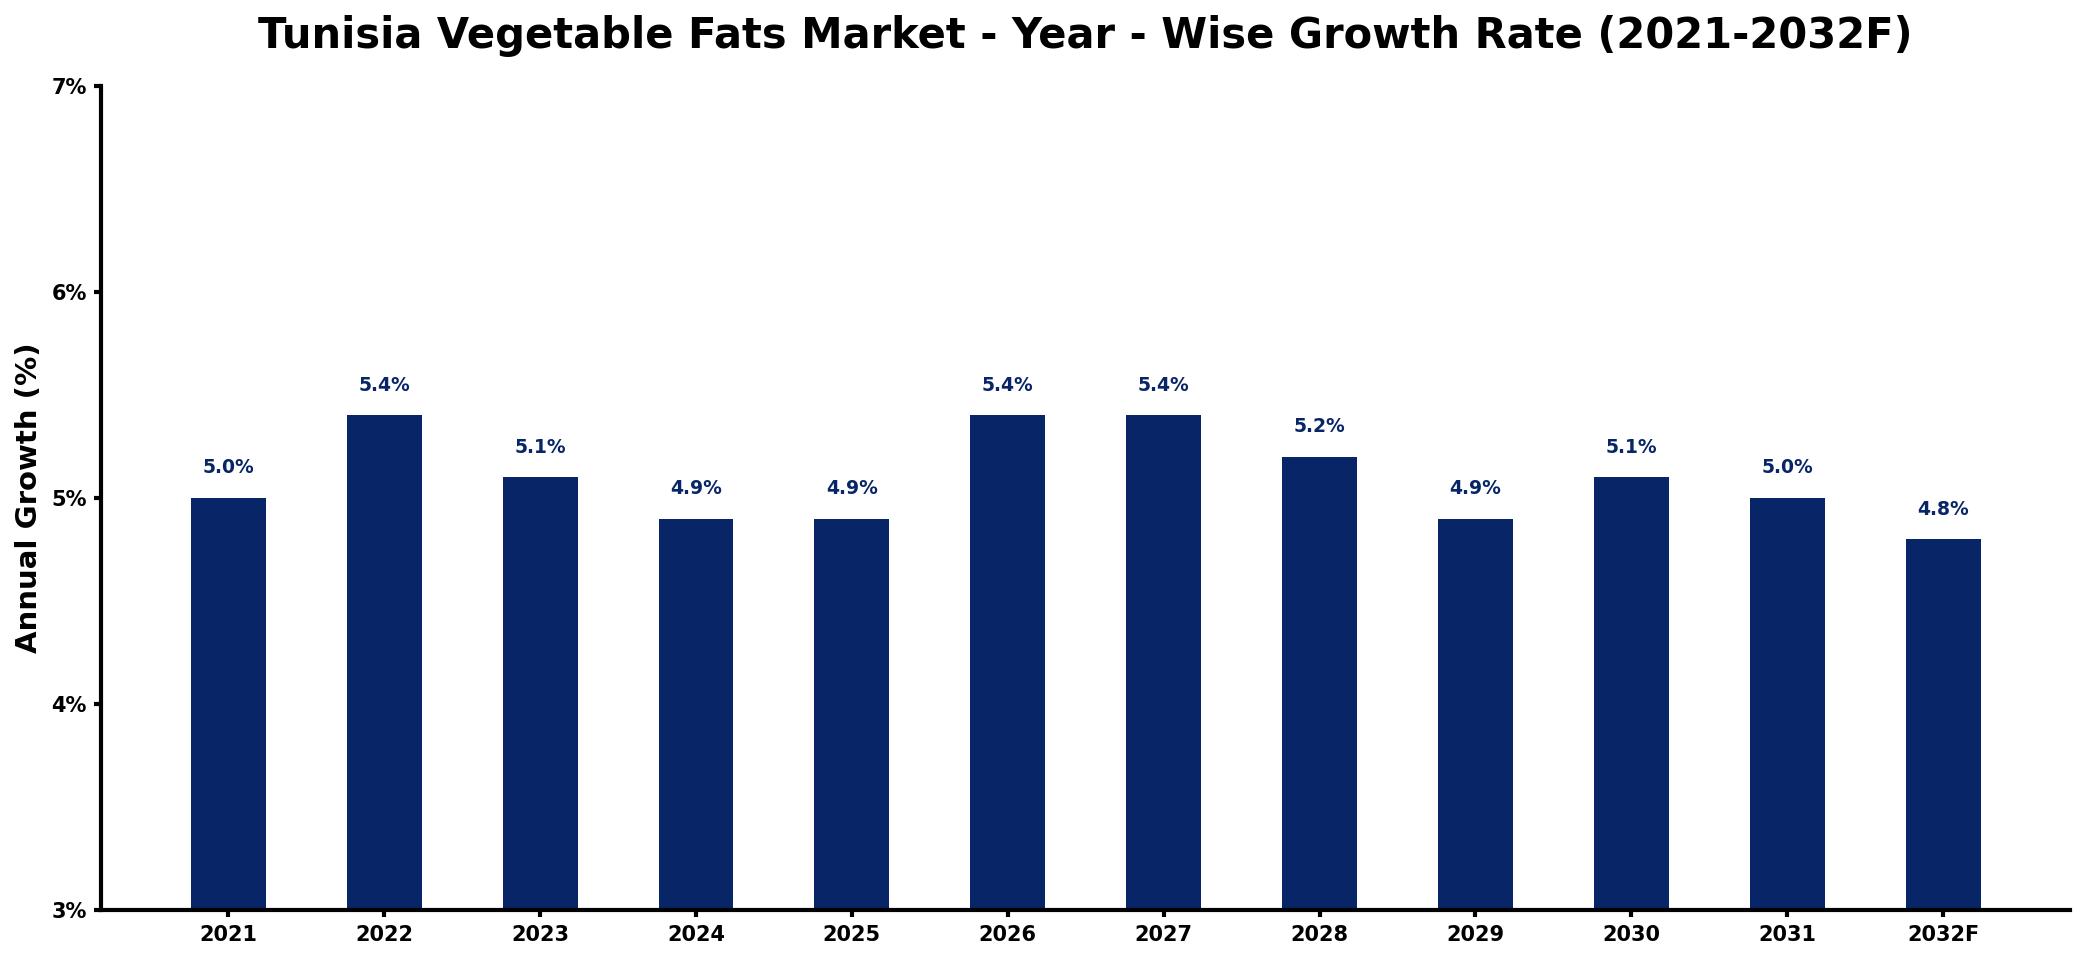
Tunisia Vegetable Fats Market Growth Rate Analysis (2021-2032)
The Tunisia Vegetable Fats market has exhibited a stable growth trajectory, with the yearly growth rates fluctuating between 4.8% and 5.4% from 2021 to 2032. In 2021, the market grew by 5.0%, which was driven by increasing consumer demand for healthier alternatives and a rising awareness of plant-based diets. This trend continued into 2022 with a 5.4% increase, bolstered by greater investments in production technologies and sustainable sourcing practices. However, growth slightly moderated to 5.1% in 2023 due to supply chain challenges. Looking ahead, the market is projected to stabilize around 5.0% in 2031, as improvements in infrastructure and policy support for green energy further enable the sector's development.
Tunisia Vegetable Fats Market Year-wise Growth Rate and Key Drivers
This graph highlights how the Tunisia Vegetable Fats Market has steadily grown over the past five years, supported by major growth factors.
The table below presents the year‑wise growth rates along with the key drivers influencing the market
| Year | Growth Rate | Major Drivers |
| 2021 | 5.0% | Rising health consciousness among consumers |
| 2022 | 5.4% | Increased demand for plant-based alternatives |
| 2023 | 5.1% | Expansion of food processing sector |
| 2024 | 4.9% | Growing popularity of vegan diets |
| 2025 | 4.9% | Surge in export opportunities globally |
| 2026 | 5.4% | Investment in sustainable agriculture practices |
| 2027 | 5.4% | Technological advancements in production |
| 2028 | 5.2% | Diversification of culinary applications |
| 2029 | 4.9% | Strengthening of local supply chains |
| 2030 | 5.1% | Emergence of innovative product offerings |
| 2031 | 5.0% | Increased focus on health benefits |
| 2032 | 4.8% | growing emerging market penetration |
Note: Market size estimations and growth projections presented in this report are based on 6Wresearch's proprietary forecasting methodology, utilizing the latest available industry data, government publications, and primary research inputs.
Tunisia Vegetable Fats Market Synopsis
The most significant force shaping the Tunisia Vegetable Fats Market today is the burgeoning health consciousness among consumers. With a growing emphasis on nutrition and wellness, individuals are actively seeking alternatives to traditional fats, creating a favorable environment for the adoption of vegetable fats derived from sources like palm, coconut, and soybean.
Additionally, the food processing industry is a critical player in this market, propelling demand for vegetable fats across various applications. As manufacturers strive to meet the evolving preferences of health-oriented consumers, the incorporation of vegetable fats into food products continues to gain momentum, solidifying their market position.
Tunisia Vegetable Fats Market Key Takeaways
- The market is experiencing robust growth due to increasing demand for vegetable-based ingredients in food processing.
- Technological advancements are improving the efficiency of vegetable fat production and processing.
- Consumer preferences are shifting towards plant-based diets, elevating the status of vegetable fats.
- Government policies are supporting local production, enhancing food security in the region.
- Investment in modern processing facilities is pivotal for market expansion and sustainability.
Evaluation of Restraints in Tunisia Vegetable Fats Market
Despite the promising growth, the Tunisia Vegetable Fats Market faces some significant restraints that could hinder its expansion. Fluctuating raw material prices pose a direct challenge to production costs and, consequently, profit margins for manufacturers. Furthermore, the market encounters formidable competition from animal fats and synthetic alternatives, which may divert consumer attention away from traditional vegetable fats. As preferences evolve towards healthier and more sustainable options, maintaining market relevance will be crucial for existing players.
Tunisia Vegetable Fats Market Trends
Current trends indicate a marked increase in demand for organic and sustainably sourced vegetable fats. Consumers are gravitating towards products that reflect their health and environmental values, compelling manufacturers to innovate and adapt. Additionally, the rise of plant-based food products—ranging from snacks to dairy alternatives—further fuels the market for vegetable fats, providing diverse applications across various culinary domains.
Emerging technologies in food processing are also transforming the vegetable fats landscape, enhancing flavor and texture while maintaining health benefits. This innovation not only meets consumer expectations but also positions manufacturers competitively in a crowded marketplace.
Tunisia Vegetable Fats Market Opportunities
The future holds substantial opportunities for growth in the Tunisia Vegetable Fats Market. With increasing urbanization and changing lifestyles, there is a growing demand for convenient, health-conscious food options. Companies that leverage these trends by offering innovative products that align with consumer preferences are likely to capture significant market share. Additionally, as government policies continue to encourage local production and sustainability, investment in local sourcing and processing facilities can yield considerable competitive advantages.
Government Initiatives in the Tunisia Vegetable Fats Market
The Tunisian government plays a pivotal role in shaping the vegetable fats market through supportive agricultural policies. Initiatives include subsidies for oilseed crops and investments in modern processing infrastructure. Furthermore, the government actively promotes food security measures aimed at reducing dependency on imported oils, which bolsters local production capacity. These policies not only enhance the market environment for vegetable fats but also align with broader health and agricultural objectives.
Future Insights of the Tunisia Vegetable Fats Market
Looking ahead to 2026-2032, the Tunisia Vegetable Fats Market is poised for dynamic growth. With an increasing population and rising disposable incomes, the demand for healthy food options is expected to escalate. As consumer awareness regarding nutrition deepens, the preference for vegetable fats over traditional sources is likely to strengthen. Moreover, continued government support and investment in technological advancements will facilitate the evolution of this market, driving innovation and further expanding its scope.
Tunisia Vegetable Fats Market Latest Developments (2025 - 2026)
Recent developments in the Tunisia Vegetable Fats Market reflect a progressive shift towards healthier product offerings. Industry stakeholders are increasingly focusing on developing innovative products that cater to the rising health-conscious consumer base. Furthermore, investments in modern processing technologies are being prioritized to enhance production efficiency and product quality, which are crucial in meeting consumer demands. This proactive approach indicates a robust alignment with market trends and opportunities.
Tunisia Vegetable Fats Market - Key Attractiveness of the Report
- 10 Years of Market Numbers
- Historical Data Starting from 2022 to 2025
- Base Year: 2025
- Forecast Data until 2032
- Key Performance Indicators Impacting the Market
- Major Upcoming Developments and Projects
Key Highlights of the Report:
- Tunisia Vegetable Fats Market Outlook
- Market Size of Tunisia Vegetable Fats Market, 2025
- Forecast of Tunisia Vegetable Fats Market, 2032
- Historical Data and Forecast of Tunisia Vegetable Fats Revenues & Volume for the Period 2022-2032F
- Tunisia Vegetable Fats Market Trend Evolution
- Tunisia Vegetable Fats Market Drivers and Challenges
- Tunisia Vegetable Fats Price Trends
- Tunisia Vegetable Fats Porter's Five Forces
- Tunisia Vegetable Fats Industry Life Cycle
- Historical Data and Forecast of Tunisia Vegetable Fats Market Revenues & Volume By Type for the Period 2022-2032F
- Historical Data and Forecast of Tunisia Vegetable Fats Market Revenues & Volume By Saturated for the Period 2022-2032F
- Historical Data and Forecast of Tunisia Vegetable Fats Market Revenues & Volume By Unsaturated for the Period 2022-2032F
- Historical Data and Forecast of Tunisia Vegetable Fats Market Revenues & Volume By Trans for the Period 2022-2032F
- Historical Data and Forecast of Tunisia Vegetable Fats Market Revenues & Volume By Product for the Period 2022-2032F
- Historical Data and Forecast of Tunisia Vegetable Fats Market Revenues & Volume By Sunflower for the Period 2022-2032F
- Historical Data and Forecast of Tunisia Vegetable Fats Market Revenues & Volume By Coconut, for the Period 2022-2032F
- Historical Data and Forecast of Tunisia Vegetable Fats Market Revenues & Volume By Soybean for the Period 2022-2032F
- Historical Data and Forecast of Tunisia Vegetable Fats Market Revenues & Volume By Palm Oil for the Period 2022-2032F
- Historical Data and Forecast of Tunisia Vegetable Fats Market Revenues & Volume By Canola for the Period 2022-2032F
- Historical Data and Forecast of Tunisia Vegetable Fats Market Revenues & Volume By Groundnut for the Period 2022-2032F
- Historical Data and Forecast of Tunisia Vegetable Fats Market Revenues & Volume By Palm Kernel for the Period 2022-2032F
- Historical Data and Forecast of Tunisia Vegetable Fats Market Revenues & Volume By Others for the Period 2022-2032F
- Historical Data and Forecast of Tunisia Vegetable Fats Market Revenues & Volume By Application for the Period 2022-2032F
- Historical Data and Forecast of Tunisia Vegetable Fats Market Revenues & Volume By Food for the Period 2022-2032F
- Historical Data and Forecast of Tunisia Vegetable Fats Market Revenues & Volume By Industrial for the Period 2022-2032F
- Historical Data and Forecast of Tunisia Vegetable Fats Market Revenues & Volume By Others for the Period 2022-2032F
- Tunisia Vegetable Fats Import Export Trade Statistics
- Market Opportunity Assessment By Type
- Market Opportunity Assessment By Product
- Market Opportunity Assessment By Application
- Tunisia Vegetable Fats Top Companies Market Share
- Tunisia Vegetable Fats Competitive Benchmarking By Technical and Operational Parameters
- Tunisia Vegetable Fats Company Profiles
- Tunisia Vegetable Fats Key Strategic Recommendations
Frequently Asked Questions About the Market Study (FAQs):
The increasing health consciousness among consumers, combined with the expansion of the food processing industry, are key factors propelling the demand for vegetable fats in Tunisia.
The market is estimated at USD 408 Million in 2025, projected to reach USD 549 Million by 2032, growing at a CAGR of 4.3% from 2026 to 2032.
The Tunisian government supports the vegetable fats market through subsidies and policies that enhance local production and reduce dependence on imported oils, promoting food security.
Yes, a notable trend is the shift towards organic and sustainably sourced vegetable fats, driven by consumer preference for healthier and environmentally friendly options.
Manufacturers grapple with fluctuating raw material prices and face competition from animal fats and synthetic alternatives, which can impact profit margins and market positioning.
Opportunities lie in catering to the increasing demand for convenient, health-oriented food products and investing in local sourcing and modern processing technologies to enhance competitiveness.
6Wresearch actively monitors the Tunisia Vegetable Fats Market and publishes its comprehensive annual report, highlighting emerging trends, growth drivers, revenue analysis, and forecast outlook. Our insights help businesses to make data-backed strategic decisions with ongoing market dynamics. Our analysts track relevent industries related to the Tunisia Vegetable Fats Market, allowing our clients with actionable intelligence and reliable forecasts tailored to emerging regional needs.
Yes, we provide customisation as per your requirements. To learn more, feel free to contact us on sales@6wresearch.com
1 Executive Summary |
2 Introduction |
2.1 Key Highlights of the Report |
2.2 Report Description |
2.3 Market Scope & Segmentation |
2.4 Research Methodology |
2.5 Assumptions |
3 Tunisia Vegetable Fats Market Overview |
3.1 Tunisia Country Macro Economic Indicators |
3.2 Tunisia Vegetable Fats Market Revenues & Volume, 2022 & 2032F |
3.3 Tunisia Vegetable Fats Market - Industry Life Cycle |
3.4 Tunisia Vegetable Fats Market - Porter's Five Forces |
3.5 Tunisia Vegetable Fats Market Revenues & Volume Share, By Type, 2022 & 2032F |
3.6 Tunisia Vegetable Fats Market Revenues & Volume Share, By Product, 2022 & 2032F |
3.7 Tunisia Vegetable Fats Market Revenues & Volume Share, By Application, 2022 & 2032F |
4 Tunisia Vegetable Fats Market Dynamics |
4.1 Impact Analysis |
4.2 Market Drivers |
4.2.1 Increasing consumer awareness about the health benefits of vegetable fats |
4.2.2 Growth in the food processing industry in Tunisia |
4.2.3 Government initiatives promoting the use of vegetable fats in food products |
4.3 Market Restraints |
4.3.1 Fluctuating prices of raw materials |
4.3.2 Competition from other types of fats such as animal fats |
4.3.3 Regulatory challenges related to quality control and standards |
5 Tunisia Vegetable Fats Market Trends |
6 Tunisia Vegetable Fats Market, By Types |
6.1 Tunisia Vegetable Fats Market, By Type |
6.1.1 Overview and Analysis |
6.1.2 Tunisia Vegetable Fats Market Revenues & Volume, By Type, 2022-2032F |
6.1.3 Tunisia Vegetable Fats Market Revenues & Volume, By Saturated, 2022-2032F |
6.1.4 Tunisia Vegetable Fats Market Revenues & Volume, By Unsaturated, 2022-2032F |
6.1.5 Tunisia Vegetable Fats Market Revenues & Volume, By Trans, 2022-2032F |
6.2 Tunisia Vegetable Fats Market, By Product |
6.2.1 Overview and Analysis |
6.2.2 Tunisia Vegetable Fats Market Revenues & Volume, By Sunflower, 2022-2032F |
6.2.3 Tunisia Vegetable Fats Market Revenues & Volume, By Coconut,, 2022-2032F |
6.2.4 Tunisia Vegetable Fats Market Revenues & Volume, By Soybean, 2022-2032F |
6.2.5 Tunisia Vegetable Fats Market Revenues & Volume, By Palm Oil, 2022-2032F |
6.2.6 Tunisia Vegetable Fats Market Revenues & Volume, By Canola, 2022-2032F |
6.2.7 Tunisia Vegetable Fats Market Revenues & Volume, By Groundnut, 2022-2032F |
6.2.8 Tunisia Vegetable Fats Market Revenues & Volume, By Others, 2022-2032F |
6.2.9 Tunisia Vegetable Fats Market Revenues & Volume, By Others, 2022-2032F |
6.3 Tunisia Vegetable Fats Market, By Application |
6.3.1 Overview and Analysis |
6.3.2 Tunisia Vegetable Fats Market Revenues & Volume, By Food, 2022-2032F |
6.3.3 Tunisia Vegetable Fats Market Revenues & Volume, By Industrial, 2022-2032F |
6.3.4 Tunisia Vegetable Fats Market Revenues & Volume, By Others, 2022-2032F |
7 Tunisia Vegetable Fats Market Import-Export Trade Statistics |
7.1 Tunisia Vegetable Fats Market Export to Major Countries |
7.2 Tunisia Vegetable Fats Market Imports from Major Countries |
8 Tunisia Vegetable Fats Market Key Performance Indicators |
8.1 Percentage increase in the adoption of vegetable fats by food manufacturers |
8.2 Number of new product launches containing vegetable fats |
8.3 Amount of investment in RD for new vegetable fat products |
8.4 Consumer awareness levels about the benefits of vegetable fats |
8.5 Growth in the per capita consumption of vegetable fats in Tunisia |
9 Tunisia Vegetable Fats Market - Opportunity Assessment |
9.1 Tunisia Vegetable Fats Market Opportunity Assessment, By Type, 2022 & 2032F |
9.2 Tunisia Vegetable Fats Market Opportunity Assessment, By Product, 2022 & 2032F |
9.3 Tunisia Vegetable Fats Market Opportunity Assessment, By Application, 2022 & 2032F |
10 Tunisia Vegetable Fats Market - Competitive Landscape |
10.1 Tunisia Vegetable Fats Market Revenue Share, By Companies, 2025 |
10.2 Tunisia Vegetable Fats Market Competitive Benchmarking, By Operating and Technical Parameters |
11 Company Profiles |
12 Recommendations |
13 Disclaimer |
Global Go To Market Strategy - 2030
Export potential enables firms to identify high-growth global markets with greater confidence by combining advanced trade intelligence with a structured quantitative methodology. The framework analyzes emerging demand trends and country-level import patterns while integrating macroeconomic and trade datasets such as GDP and population forecasts, bilateral import–export flows, tariff structures, elasticity differentials between developed and developing economies, geographic distance, and import demand projections. Using weighted trade values from 2020–2024 as the base period to project country-to-country export potential for 2030, these inputs are operationalized through calculated drivers such as gravity model parameters, tariff impact factors, and projected GDP per-capita growth. Through an analysis of hidden potentials, demand hotspots, and market conditions that are most favorable to success, this method enables firms to focus on target countries, maximize returns, and global expansion with data, backed by accuracy.
By factoring in the projected importer demand gap that is currently unmet and could be potential opportunity, it identifies the potential for the Exporter (Country) among 190 countries, against the general trade analysis, which identifies the biggest importer or exporter.
To discover high-growth global markets and optimize your business strategy:
Click Here
Pricing
- Single User License$ 1,995
- Department License$ 2,400
- Site License$ 3,120
- Global License$ 3,795

Leadership Perspectives from Industry Events
Search
Thought Leadership and Analyst Meet


Our Clients
6WResearch In News
- India Air Conditioner Market Set for Strong Rebound in 2026 After Weather-Led Correction and GST-Driven Recovery: 6Wresearch
- ADAS in India: How Automatic Emergency Braking, Blind Spot Detection & Driver Monitoring are Transforming Road Safety
- Doha a strategic location for EV manufacturing hub: IPA Qatar
- Demand for luxury TVs surging in the GCC, says Samsung
- Empowering Growth: The Thriving Journey of Bangladesh’s Cable Industry
- Demand for luxury TVs surging in the GCC, says Samsung
Latest Reports
- Nicaragua RPG Gaming Market (2026-2032)
- New Zealand RPG Gaming Market (2026-2032)
- Netherlands RPG Gaming Market (2026-2032)
- Nauru RPG Gaming Market (2026-2032)
- Namibia RPG Gaming Market (2026-2032)
- Mozambique RPG Gaming Market (2026-2032)
- Montenegro RPG Gaming Market (2026-2032)
- Mongolia RPG Gaming Market (2026-2032)
- Monaco RPG Gaming Market (2026-2032)
- Micronesia RPG Gaming Market (2026-2032)
Industry Events and Analyst Meet

HIMTEX 2026

India Refining Summit 2026

India EV Show 2026

EV tech India Expo 2026

Auto Tech Asia 2026
Whitepaper
- Middle East & Africa Commercial Security Market Click here to view more.
- Middle East & Africa Fire Safety Systems & Equipment Market Click here to view more.
- GCC Drone Market Click here to view more.
- Middle East Lighting Fixture Market Click here to view more.
- GCC Physical & Perimeter Security Market Click here to view more.