Tunisia Wine Market (2026-2032) | Forecast, Companies, Revenue, Trends, Value, Industry, Outlook, Share, Size, Growth & Analysis
Market Forecast By Product Types (Still Wine, Sparkling Wine, Dessert Wine, Fortified Wine), By Colors (Red Wine, Rose Wine, White Wine, Other Colors), By Distribution Channel (Offline , Online ) And Competitive Landscape
| Product Code: ETC018854 | Publication Date: Oct 2020 | Updated Date: Jun 2026 | Product Type: Report | |
| Publisher: 6Wresearch | Author: Ravi Bhandari | No. of Pages: 70 | No. of Figures: 35 | No. of Tables: 5 |
Tunisia Wine Market Summary
The tunisia wine market was estimated at USD 747 Million in 2025 and is projected to reach USD 1068 Million by 2032, growing at a CAGR of 5.9% from 2026 to 2032.
Tunisia Wine Market Growth Rate Analysis (2021-2032)
The Tunisia wine market has been experiencing a stable growth pattern, with an annual growth rate of 6.2% in 2021, slightly dipping to 6.0% in 2022, but rebounding to 6.3% in 2023. This consistent expansion is primarily driven by increasing consumer demand domestically and a rising interest in Tunisian wines in international markets. A focus on enhancing production techniques and investment in modern infrastructure has supported this growth. However, a slight decrease to 5.9% in 2025 and 2026 indicates the need for adaptation amidst fluctuating global consumption trends. Looking ahead, the market is projected to stabilize around 6.2% to 6.4% through 2032, reflecting sustained efforts in digital marketing and export strategies.
Tunisia Wine Market Year-wise Growth Rate and Key Drivers
This graph highlights how the Tunisia Wine Market has steadily grown over the past five years, supported by major growth factors.
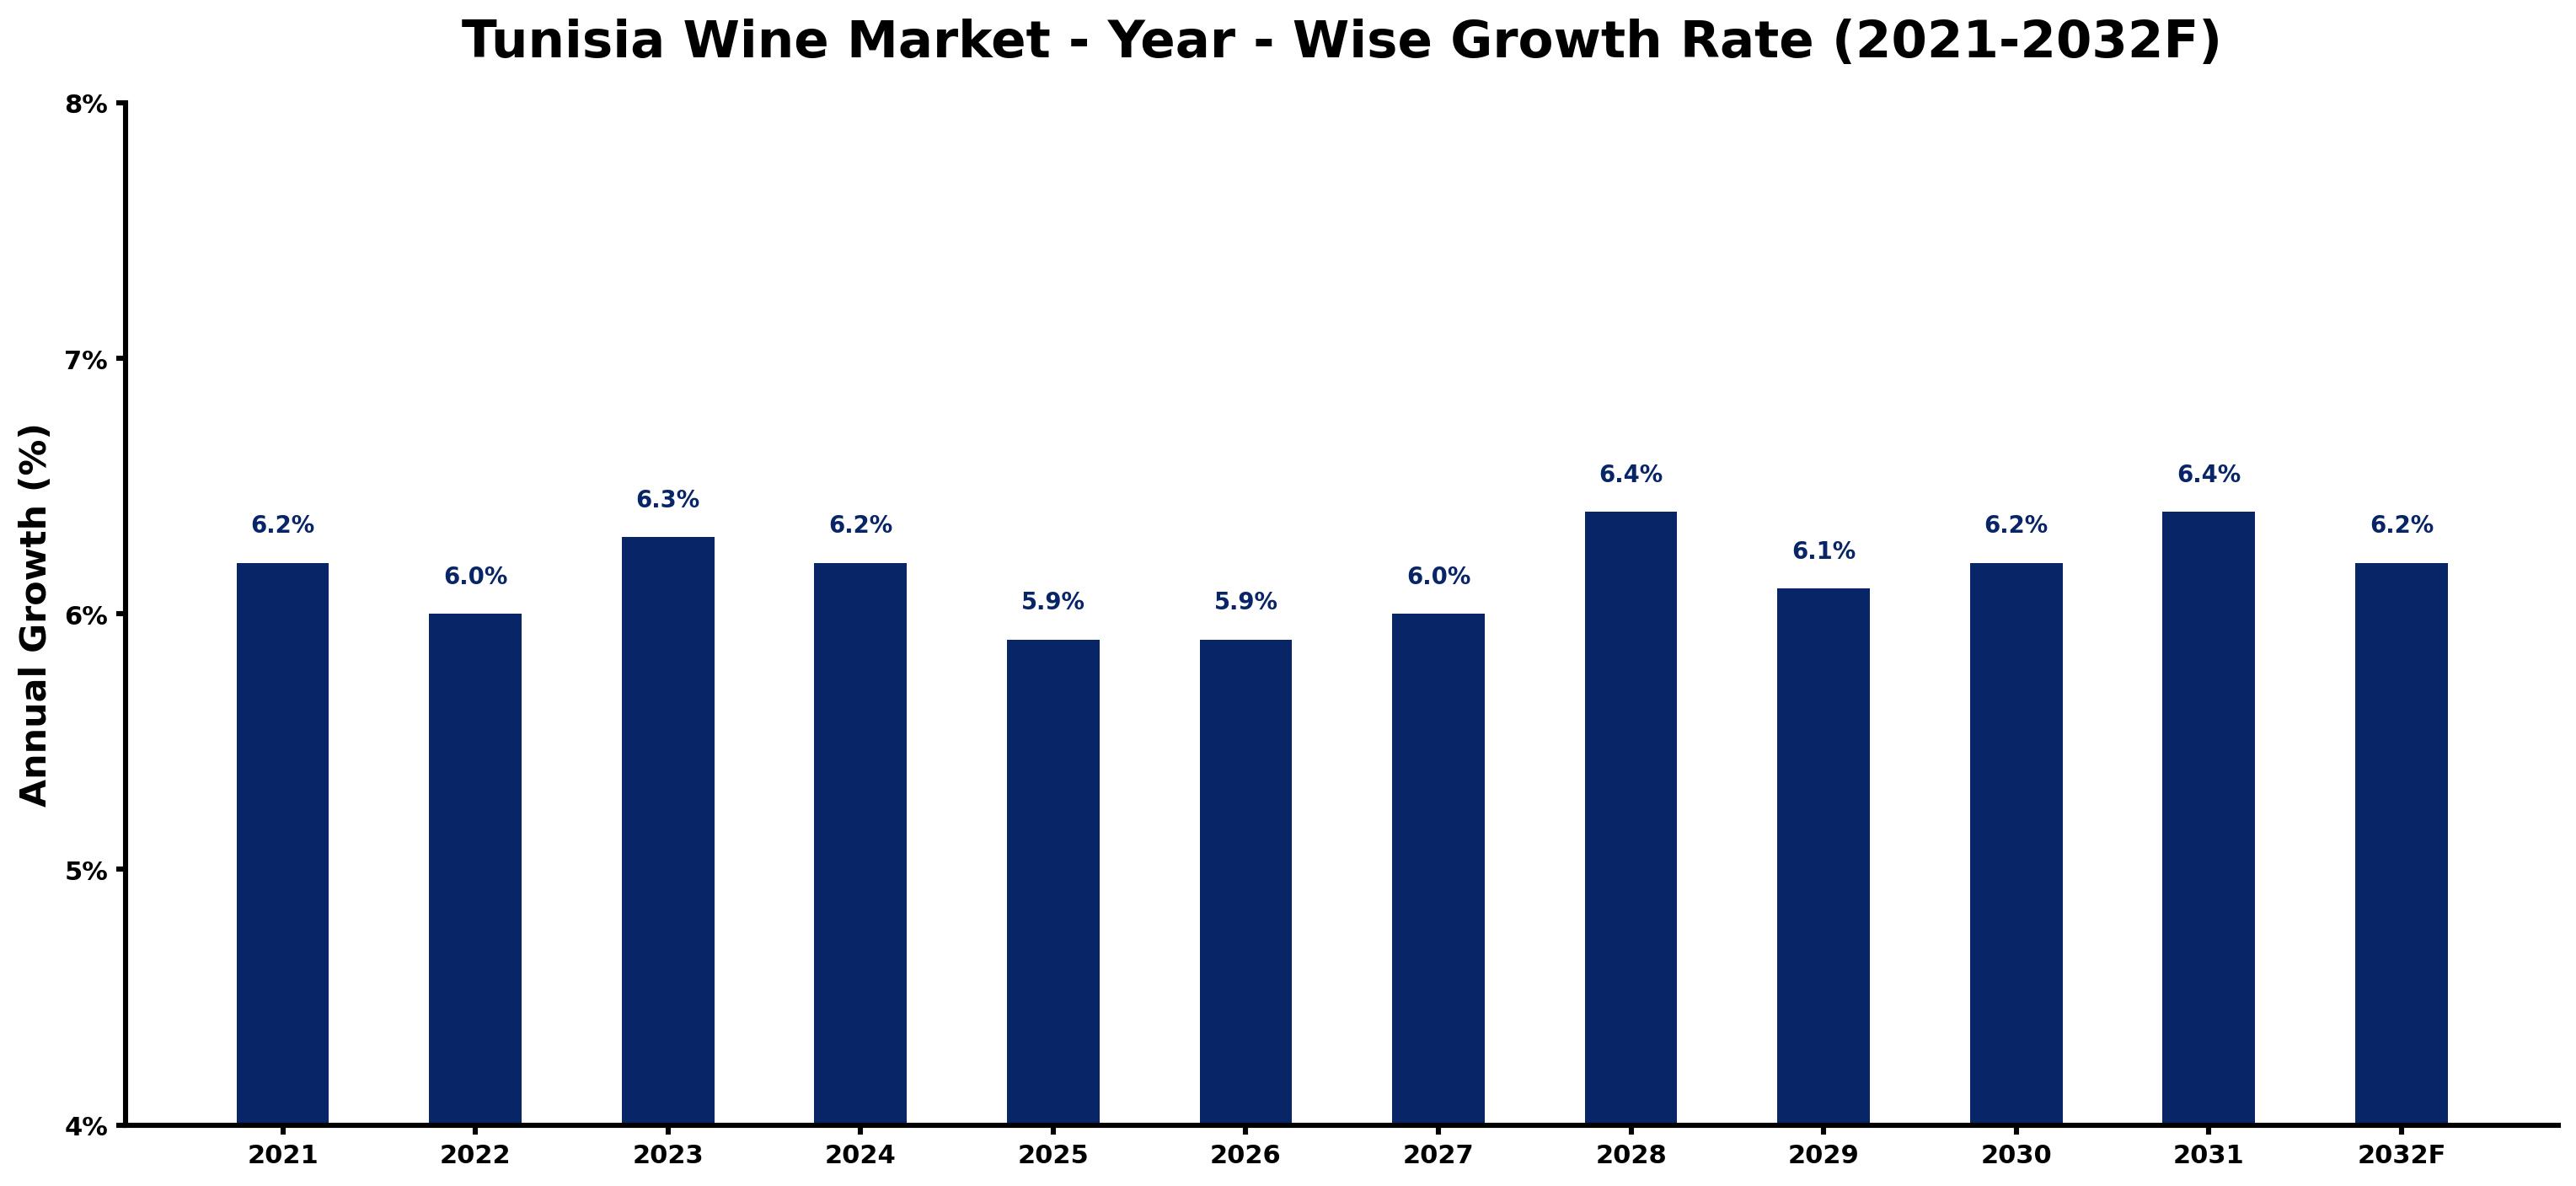
The table below presents the year wise growth rates along with the key drivers influencing the market
| Year | Growth Rate | Major Drivers |
| 2021 | 6.2% | Local wineries began embracing online sales, broadening their customer base significantly. |
| 2022 | 6.0% | A renewed interest in Mediterranean diets sparked increased wine consumption among health-conscious consumers. |
| 2023 | 6.3% | Innovative marketing campaigns highlighted Tunisia's unique terroir, attracting both local and international tourists. |
| 2024 | 6.2% | New varietals introduced by emerging winemakers captured attention and diversified offerings significantly. |
| 2025 | 5.9% | Collaborations between vineyards and gastronomic events boosted wine visibility in high-end dining establishments. |
| 2026 | 5.9% | Increased focus on sustainable practices attracted environmentally-conscious consumers and investors alike. |
| 2027 | 6.0% | Educational initiatives about wine tasting and pairing gained popularity, enhancing consumer knowledge and engagement. |
| 2028 | 6.4% | Expansion of distribution channels, including online platforms and retail partnerships, facilitated greater accessibility. |
| 2029 | 6.1% | Participation in international wine competitions resulted in awards, elevating Tunisia's wine reputation globally. |
| 2030 | 6.2% | Young professionals increasingly sought premium wine experiences, prompting growth in upscale wine bars. |
| 2031 | 6.4% | Cultural events celebrating local wine heritage fostered community connections and consumer loyalty. |
| 2032 | 6.2% | Continuing investments in vineyard technology improved quality, setting standards for regional wine production. |
Note - Market size estimations and growth projections presented in this report are based on 6Wresearch's advanced forecasting approach, validated with industry datasets as of June 2026.
Key Highlights of the Report:
- Tunisia Wine Market Outlook
- Market Size of Tunisia Wine Market, 2025
- Forecast of Tunisia Wine Market, 2032F
- Historical Data and Forecast of Tunisia Wine Revenues & Volume for the Period 2022-2032F
- Tunisia Wine Market Trend Evolution
- Tunisia Wine Market Drivers and Challenges
- Tunisia Wine Price Trends
- Tunisia Wine Porter's Five Forces
- Tunisia Wine Industry Life Cycle
- Historical Data and Forecast of Tunisia Wine Market Revenues & Volume By Product Types for the Period 2022-2032F
- Historical Data and Forecast of Tunisia Wine Market Revenues & Volume By Still Wine for the Period 2022-2032F
- Historical Data and Forecast of Tunisia Wine Market Revenues & Volume By Sparkling Wine for the Period 2022-2032F
- Historical Data and Forecast of Tunisia Wine Market Revenues & Volume By Dessert Wine for the Period 2022-2032F
- Historical Data and Forecast of Tunisia Wine Market Revenues & Volume By Fortified Wine for the Period 2022-2032F
- Historical Data and Forecast of Tunisia Wine Market Revenues & Volume By Colors for the Period 2022-2032F
- Historical Data and Forecast of Tunisia Wine Market Revenues & Volume By Red Wine for the Period 2022-2032F
- Historical Data and Forecast of Tunisia Wine Market Revenues & Volume By Rose Wine for the Period 2022-2032F
- Historical Data and Forecast of Tunisia Wine Market Revenues & Volume By White Wine for the Period 2022-2032F
- Historical Data and Forecast of Tunisia Wine Market Revenues & Volume By Other Colors for the Period 2022-2032F
- Historical Data and Forecast of Tunisia Wine Market Revenues & Volume By Distribution Channel for the Period 2022-2032F
- Historical Data and Forecast of Tunisia Wine Market Revenues & Volume By Offline for the Period 2022-2032F
- Historical Data and Forecast of Tunisia Wine Market Revenues & Volume By Online for the Period 2022-2032F
- Tunisia Wine Import Export Trade Statistics
- Market Opportunity Assessment By Product Types
- Market Opportunity Assessment By Colors
- Market Opportunity Assessment By Distribution Channel
- Tunisia Wine Top Companies Market Share
- Tunisia Wine Competitive Benchmarking By Technical and Operational Parameters
- Tunisia Wine Company Profiles
- Tunisia Wine Key Strategic Recommendations
Frequently Asked Questions About the Market Study (FAQs):
6Wresearch actively monitors the Tunisia Wine Market and publishes its comprehensive annual report, highlighting emerging trends, growth drivers, revenue analysis, and forecast outlook. Our insights help businesses to make data-backed strategic decisions with ongoing market dynamics. Our analysts track relevent industries related to the Tunisia Wine Market, allowing our clients with actionable intelligence and reliable forecasts tailored to emerging regional needs.
Yes, we provide customisation as per your requirements. To learn more, feel free to contact us on sales@6wresearch.com
1 Executive Summary |
2 Introduction |
2.1 Key Highlights of the Report |
2.2 Report Description |
2.3 Market Scope & Segmentation |
2.4 Research Methodology |
2.5 Assumptions |
3 Tunisia Wine Market Overview |
3.1 Tunisia Country Macro Economic Indicators |
3.2 Tunisia Wine Market Revenues & Volume, 2022 & 2032F |
3.3 Tunisia Wine Market - Industry Life Cycle |
3.4 Tunisia Wine Market - Porter's Five Forces |
3.5 Tunisia Wine Market Revenues & Volume Share, By Product Types, 2022 & 2032F |
3.6 Tunisia Wine Market Revenues & Volume Share, By Colors, 2022 & 2032F |
3.7 Tunisia Wine Market Revenues & Volume Share, By Distribution Channel, 2022 & 2032F |
4 Tunisia Wine Market Dynamics |
4.1 Impact Analysis |
4.2 Market Drivers |
4.3 Market Restraints |
5 Tunisia Wine Market Trends |
6 Tunisia Wine Market, By Types |
6.1 Tunisia Wine Market, By Product Types |
6.1.1 Overview and Analysis |
6.1.2 Tunisia Wine Market Revenues & Volume, By Product Types, 2022 - 2032F |
6.1.3 Tunisia Wine Market Revenues & Volume, By Still Wine, 2022 - 2032F |
6.1.4 Tunisia Wine Market Revenues & Volume, By Sparkling Wine, 2022 - 2032F |
6.1.5 Tunisia Wine Market Revenues & Volume, By Dessert Wine, 2022 - 2032F |
6.1.6 Tunisia Wine Market Revenues & Volume, By Fortified Wine, 2022 - 2032F |
6.2 Tunisia Wine Market, By Colors |
6.2.1 Overview and Analysis |
6.2.2 Tunisia Wine Market Revenues & Volume, By Red Wine, 2022 - 2032F |
6.2.3 Tunisia Wine Market Revenues & Volume, By Rose Wine, 2022 - 2032F |
6.2.4 Tunisia Wine Market Revenues & Volume, By White Wine, 2022 - 2032F |
6.2.5 Tunisia Wine Market Revenues & Volume, By Other Colors, 2022 - 2032F |
6.3 Tunisia Wine Market, By Distribution Channel |
6.3.1 Overview and Analysis |
6.3.2 Tunisia Wine Market Revenues & Volume, By Offline , 2022 - 2032F |
6.3.3 Tunisia Wine Market Revenues & Volume, By Online , 2022 - 2032F |
7 Tunisia Wine Market Import-Export Trade Statistics |
7.1 Tunisia Wine Market Export to Major Countries |
7.2 Tunisia Wine Market Imports from Major Countries |
8 Tunisia Wine Market Key Performance Indicators |
9 Tunisia Wine Market - Opportunity Assessment |
9.1 Tunisia Wine Market Opportunity Assessment, By Product Types, 2022 & 2032F |
9.2 Tunisia Wine Market Opportunity Assessment, By Colors, 2022 & 2032F |
9.3 Tunisia Wine Market Opportunity Assessment, By Distribution Channel, 2022 & 2032F |
10 Tunisia Wine Market - Competitive Landscape |
10.1 Tunisia Wine Market Revenue Share, By Companies, 2025 |
10.2 Tunisia Wine Market Competitive Benchmarking, By Operating and Technical Parameters |
11 Company Profiles |
12 Recommendations |
13 Disclaimer |
Global Go To Market Strategy - 2030
Export potential enables firms to identify high-growth global markets with greater confidence by combining advanced trade intelligence with a structured quantitative methodology. The framework analyzes emerging demand trends and country-level import patterns while integrating macroeconomic and trade datasets such as GDP and population forecasts, bilateral import–export flows, tariff structures, elasticity differentials between developed and developing economies, geographic distance, and import demand projections. Using weighted trade values from 2020–2024 as the base period to project country-to-country export potential for 2030, these inputs are operationalized through calculated drivers such as gravity model parameters, tariff impact factors, and projected GDP per-capita growth. Through an analysis of hidden potentials, demand hotspots, and market conditions that are most favorable to success, this method enables firms to focus on target countries, maximize returns, and global expansion with data, backed by accuracy.
By factoring in the projected importer demand gap that is currently unmet and could be potential opportunity, it identifies the potential for the Exporter (Country) among 190 countries, against the general trade analysis, which identifies the biggest importer or exporter.
To discover high-growth global markets and optimize your business strategy:
Click Here
Pricing
- Single User License$ 1,995
- Department License$ 2,400
- Site License$ 3,120
- Global License$ 3,795

Leadership Perspectives from Industry Events
Search
Thought Leadership and Analyst Meet


Our Clients
6WResearch In News
- India Air Conditioner Market Set for Strong Rebound in 2026 After Weather-Led Correction and GST-Driven Recovery: 6Wresearch
- ADAS in India: How Automatic Emergency Braking, Blind Spot Detection & Driver Monitoring are Transforming Road Safety
- Doha a strategic location for EV manufacturing hub: IPA Qatar
- Demand for luxury TVs surging in the GCC, says Samsung
- Empowering Growth: The Thriving Journey of Bangladesh’s Cable Industry
- Demand for luxury TVs surging in the GCC, says Samsung
Latest Reports
- Nicaragua RPG Gaming Market (2026-2032)
- New Zealand RPG Gaming Market (2026-2032)
- Netherlands RPG Gaming Market (2026-2032)
- Nauru RPG Gaming Market (2026-2032)
- Namibia RPG Gaming Market (2026-2032)
- Mozambique RPG Gaming Market (2026-2032)
- Montenegro RPG Gaming Market (2026-2032)
- Mongolia RPG Gaming Market (2026-2032)
- Monaco RPG Gaming Market (2026-2032)
- Micronesia RPG Gaming Market (2026-2032)
Industry Events and Analyst Meet

HIMTEX 2026

India Refining Summit 2026

India EV Show 2026

EV tech India Expo 2026

Auto Tech Asia 2026
Whitepaper
- Middle East & Africa Commercial Security Market Click here to view more.
- Middle East & Africa Fire Safety Systems & Equipment Market Click here to view more.
- GCC Drone Market Click here to view more.
- Middle East Lighting Fixture Market Click here to view more.
- GCC Physical & Perimeter Security Market Click here to view more.