Turkey industrial vehicles Market (2026-2032) | Analysis, Size, Trends, Value, Revenue, Outlook, Industry, Forecast, Share, Growth & Companies
Market Forecast By Product Type (Forklift, Aisle Truck, Tow Tractor, Container Handler), By Drive Type (Internal Combustion Engine, Battery-Operated, Gas-Powered), By Application (Industrial , Cargo) And Competitive Landscape
| Product Code: ETC029758 | Publication Date: Oct 2020 | Updated Date: Jun 2026 | Product Type: Report | |
| Publisher: 6Wresearch | Author: Ravi Bhandari | No. of Pages: 70 | No. of Figures: 35 | No. of Tables: 5 |
Turkey industrial vehicles Market Summary
The turkey industrial vehicles market was estimated at USD 347 Million in 2025 and is projected to reach USD 486 Million by 2032, growing at a CAGR of 6.0% from 2026 to 2032.
Turkey industrial vehicles Market Growth Rate Analysis (2021-2032)
The Turkish industrial vehicles market exhibits a stable growth pattern, with annual increases averaging around 6.0% from 2021 to 2023. Factors driving this momentum include robust investments in infrastructure projects and a growing demand for energy-efficient vehicles amid ongoing energy transitions. While growth slightly dips to 5.6% in 2022, it rebounds to 6.0% in 2023, supported by advancements in technology and digitalization, enhancing operational efficiencies. Predictions show a gradual decline to 5.4% by 2028, primarily influenced by potential market saturation and fluctuating consumer demand. Nevertheless, a renewed emphasis on sustainable industrial solutions should foster resilience, keeping growth rates around 5.6% to 6.1% in the following years.
Turkey industrial vehicles Market Year-wise Growth Rate and Key Drivers
This graph highlights how the Turkey industrial vehicles Market has steadily grown over the past five years, supported by major growth factors.
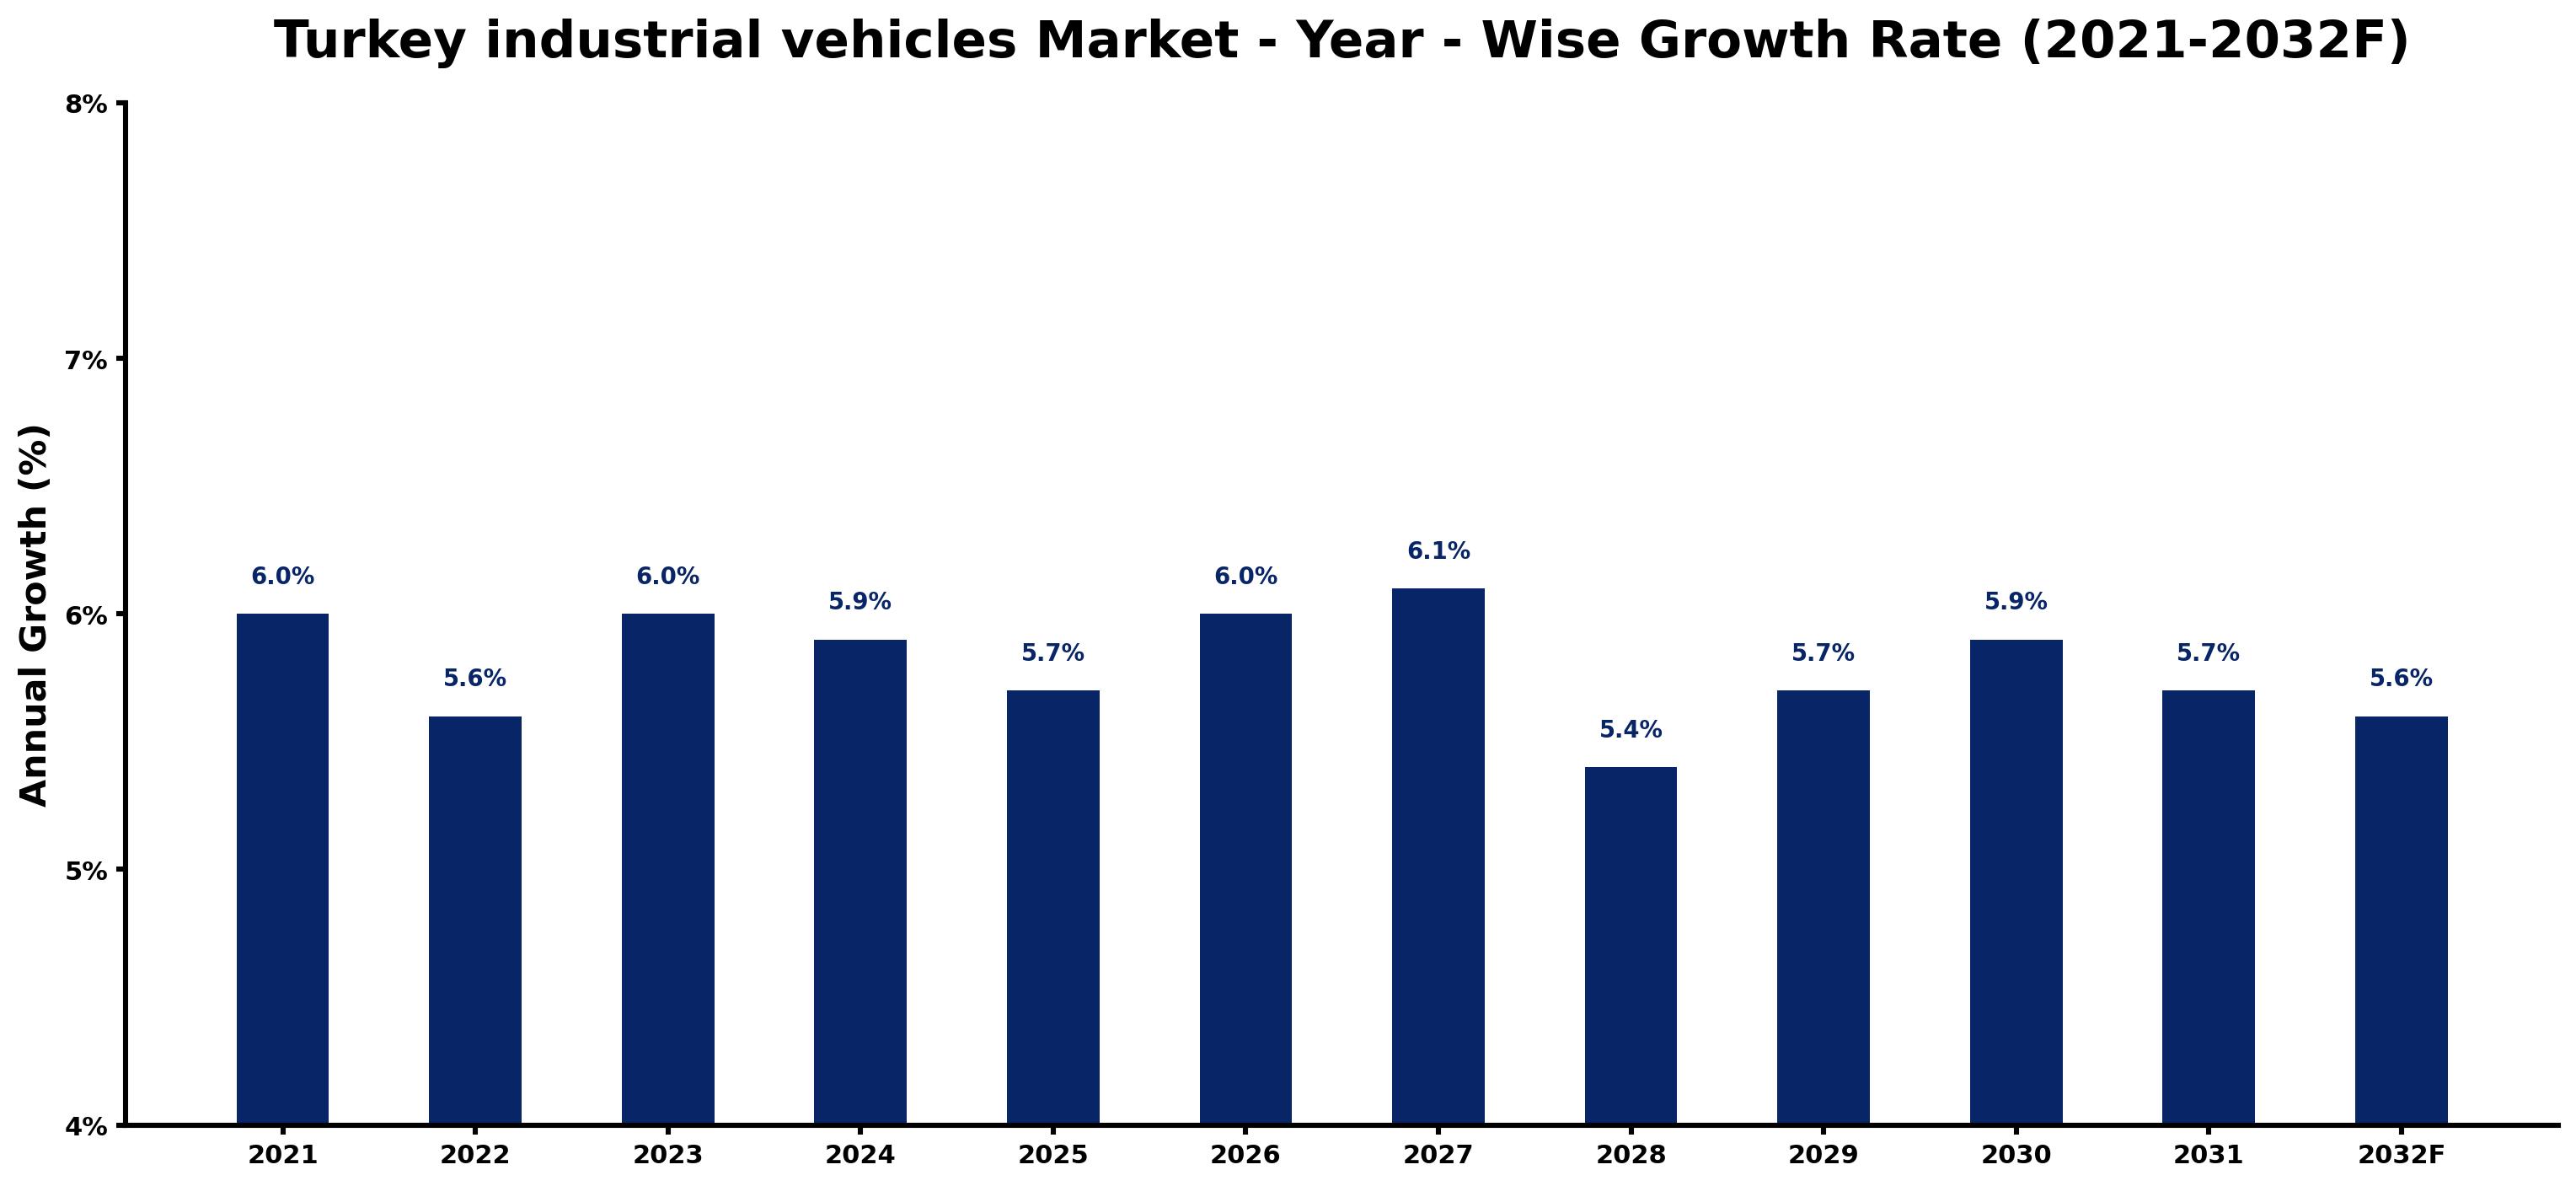
The table below presents the year wise growth rates along with the key drivers influencing the market
| Year | Growth Rate | Major Drivers |
| 2021 | 6.0% | Supply chain disruptions highlighted the need for robust industrial vehicles in logistics. |
| 2022 | 5.6% | Construction sector recovery in Turkey led to increased demand for heavy machinery. |
| 2023 | 6.0% | Local manufacturers focused on enhancing technology integration for operational efficiency. |
| 2024 | 5.9% | Urbanization trends necessitated upgrades in fleet capabilities for urban transport solutions. |
| 2025 | 5.7% | Emerging electric vehicle technologies began reshaping industrial vehicle market expectations. |
| 2026 | 6.0% | Infrastructure investments in Turkey showcased potential for higher vehicle utilization rates. |
| 2027 | 6.1% | Collaboration between tech firms and manufacturers resulted in innovative vehicle solutions. |
| 2028 | 5.4% | Sustainability concerns pushed companies to prioritize eco-friendly industrial vehicle options. |
| 2029 | 5.7% | Increased export opportunities for Turkish industrial vehicles strengthened regional market position. |
| 2030 | 5.9% | Integration of smart technologies led to improved vehicle monitoring and management. |
| 2031 | 5.7% | Industrial diversification strategies required versatile vehicles for multiple sector applications. |
| 2032 | 5.6% | Competitiveness in the market encouraged companies to enhance service quality and offerings. |
Note - Market size estimations and growth projections presented in this report are based on 6Wresearch's advanced forecasting approach, validated with industry datasets as of June 2026.
Turkey industrial vehicles Market Synopsis
The Turkey industrial vehicles Market is projected to reach 6.0% and witness significant growth during the forecast period (2026-2032).
Turkey industrial vehicles Market Growth Drivers
The Turkey industrial vehicles market is fundamentally driven by the need for efficiency and productivity across various industrial sectors, including manufacturing, construction, and logistics. As industries increasingly focus on optimizing operations, the demand for advanced industrial vehicles is burgeoning. Key factors propelling this growth include:
- Rising demand for material handling solutions: As the logistics sector expands, the need for effective material handling equipment, such as forklifts and utility vehicles, has surged, enhancing operational efficiency.
- Technological advancements: The integration of innovative technologies, such as automation and electric vehicle components, is significantly becoming a priority, as businesses aim to reduce labor costs and improve safety standards.
- Infrastructure development: Growing investments in infrastructure and construction projects within Turkey directly correlate with the demand for industrial vehicles to facilitate construction and logistics operations.
- Focus on sustainability: Companies are increasingly adopting electric and hybrid industrial vehicles, driven by regulatory pressures and corporate sustainability goals, supporting market evolution.
- Increased manufacturing activity: The expansion of domestic manufacturing capabilities not only increases the requirement for industrial vehicles but also enhances the overall economic landscape.
Turkey industrial vehicles Market Challenges and Restraints
While the Turkey industrial vehicles market is poised for growth, several challenges hinder the pace of development. Key challenges include:
- High production costs: The necessity for quality raw materials and sophisticated manufacturing processes can inflate production costs, posing challenges for both manufacturers and end-users.
- Regulatory compliance: Stringent safety and environmental regulations increase operational complexities and costs for manufacturers, impacting market competitiveness.
- Competition from global manufacturers: The presence of international manufacturers offering competitive pricing and technologies poses a significant challenge to local players.
- Economic fluctuations: Varying economic conditions can lead to instability in key end-use sectors, such as construction and logistics, thereby affecting demand.
- Availability of alternative solutions: The rise of autonomous and alternative vehicle solutions provides buyers with options, which can dilute the industrial vehicles market share.
Turkey industrial vehicles Market Government Investment and Initiatives
The Turkish government plays a pivotal role in bolstering the industrial vehicles market through various policies and initiatives. These efforts are designed to stimulate innovation, enhance manufacturing quality, and ensure regulatory compliance. Notable initiatives include:
- Financial incentives for R&D: The government provides support for research and development activities focused on advanced industrial vehicle technologies, fostering innovation within the sector.
- Tax incentives: Tax breaks are available for manufacturers, helping to alleviate the financial burden associated with production and encouraging growth in the sector.
- Quality and safety regulations: The enforcement of stringent quality and safety standards ensures that industrial vehicles meet necessary performance and reliability benchmarks, thus fostering consumer confidence.
- Investment in infrastructure: Government investments in infrastructure projects create a conducive environment for the demand for industrial vehicles, aligning government goals with market needs.
- Support for sustainable practices: Efforts to promote environmentally friendly technologies, including electric vehicles, align with global sustainability trends and encourage adoption within the local market.
Turkey industrial vehicles Market Latest Developments (May 2025 - June 2026)
The latest developments in the Turkey industrial vehicles market from May 2025 to June 2026 reflect a significant shift towards modernization and sustainability. Key trends identified during this period include:
- Increased adoption of electric vehicles: The market has seen a palpable shift towards the adoption of electric industrial vehicles, spurred by government initiatives and increasing environmental awareness.
- Growth of automation technologies: Companies are investing in automation and robotics within their industrial operations, which boosts the demand for technologically advanced vehicles designed to integrate seamlessly with these systems.
- Partnerships and collaborations: Industry players are forming strategic partnerships to enhance innovation and leverage complementary strengths in manufacturing and technology development.
- Focus on workforce training: Companies are investing in training initiatives to equip workers with skills necessary to operate advanced industrial vehicles and comply with evolving safety regulations.
- Regulatory updates: Recent regulatory changes have necessitated adjustments in operational practices, influencing manufacturers to adapt to new compliance requirements swiftly.
Turkey industrial vehicles Market - Key Attractiveness of the Report
- 10 Years of Market Numbers
- Historical Data Starting from 2022 to 2025
- Base Year: 2025
- Forecast Data until 2032
- Key Performance Indicators Impacting the Market
- Major Upcoming Developments and Projects
Key Highlights of the Report:
- Turkey industrial vehicles Market Outlook
- Market Size of Turkey industrial vehicles Market, 2025
- Forecast of Turkey industrial vehicles Market, 2032
- Historical Data and Forecast of Turkey industrial vehicles Revenues & Volume for the Period 2022-2032F
- Turkey industrial vehicles Market Trend Evolution
- Turkey industrial vehicles Market Drivers and Challenges
- Turkey industrial vehicles Price Trends
- Turkey industrial vehicles Porter's Five Forces
- Turkey industrial vehicles Industry Life Cycle
- Historical Data and Forecast of Turkey industrial vehicles Market Revenues & Volume By Product Type for the Period 2022-2032F
- Historical Data and Forecast of Turkey industrial vehicles Market Revenues & Volume By Forklift for the Period 2022-2032F
- Historical Data and Forecast of Turkey industrial vehicles Market Revenues & Volume By Aisle Truck for the Period 2022-2032F
- Historical Data and Forecast of Turkey industrial vehicles Market Revenues & Volume By Tow Tractor for the Period 2022-2032F
- Historical Data and Forecast of Turkey industrial vehicles Market Revenues & Volume By Container Handler for the Period 2022-2032F
- Historical Data and Forecast of Turkey industrial vehicles Market Revenues & Volume By Drive Type for the Period 2022-2032F
- Historical Data and Forecast of Turkey industrial vehicles Market Revenues & Volume By Internal Combustion Engine for the Period 2022-2032F
- Historical Data and Forecast of Turkey industrial vehicles Market Revenues & Volume By Battery-Operated for the Period 2022-2032F
- Historical Data and Forecast of Turkey industrial vehicles Market Revenues & Volume By Gas-Powered for the Period 2022-2032F
- Historical Data and Forecast of Turkey industrial vehicles Market Revenues & Volume By Application for the Period 2022-2032F
- Historical Data and Forecast of Turkey industrial vehicles Market Revenues & Volume By Industrial for the Period 2022-2032F
- Historical Data and Forecast of Turkey industrial vehicles Market Revenues & Volume By Cargo for the Period 2022-2032F
- Turkey industrial vehicles Import Export Trade Statistics
- Market Opportunity Assessment By Product Type
- Market Opportunity Assessment By Drive Type
- Market Opportunity Assessment By Application
- Turkey industrial vehicles Top Companies Market Share
- Turkey industrial vehicles Competitive Benchmarking By Technical and Operational Parameters
- Turkey industrial vehicles Company Profiles
- Turkey industrial vehicles Key Strategic Recommendations
Frequently Asked Questions About the Market Study (FAQs):
The market is driven by the increasing demand for efficient material handling solutions, technological advancements, and the expansion of key industries such as manufacturing and construction.
Government policy supports the market through financial incentives for R&D, tax breaks for manufacturers, regulatory frameworks, and investments in infrastructure, enhancing the overall market environment.
Key challenges include high production costs, regulatory compliance complexities, competition from international manufacturers, and economic fluctuations that affect demand in key sectors.
Recent trends include the rising adoption of electric vehicles, increased automation, partnerships for innovation, and a strong focus on training to support evolving operational demands.
6Wresearch actively monitors the Turkey industrial vehicles Market and publishes its comprehensive annual report, highlighting emerging trends, growth drivers, revenue analysis, and forecast outlook. Our insights help businesses to make data-backed strategic decisions with ongoing market dynamics. Our analysts track relevent industries related to the Turkey industrial vehicles Market, allowing our clients with actionable intelligence and reliable forecasts tailored to emerging regional needs.
Yes, we provide customisation as per your requirements. To learn more, feel free to contact us on sales@6wresearch.com
1 Executive Summary |
2 Introduction |
2.1 Key Highlights of the Report |
2.2 Report Description |
2.3 Market Scope & Segmentation |
2.4 Research Methodology |
2.5 Assumptions |
3 Turkey industrial vehicles Market Overview |
3.1 Turkey Country Macro Economic Indicators |
3.2 Turkey industrial vehicles Market Revenues & Volume, 2022 & 2032F |
3.3 Turkey industrial vehicles Market - Industry Life Cycle |
3.4 Turkey industrial vehicles Market - Porter's Five Forces |
3.5 Turkey industrial vehicles Market Revenues & Volume Share, By Product Type, 2022 & 2032F |
3.6 Turkey industrial vehicles Market Revenues & Volume Share, By Drive Type, 2022 & 2032F |
3.7 Turkey industrial vehicles Market Revenues & Volume Share, By Application, 2022 & 2032F |
4 Turkey industrial vehicles Market Dynamics |
4.1 Impact Analysis |
4.2 Market Drivers |
4.2.1 Increasing demand for efficient material handling solutions in industries |
4.2.2 Growth in the manufacturing sector leading to higher adoption of industrial vehicles |
4.2.3 Government initiatives promoting industrial automation and modernization |
4.3 Market Restraints |
4.3.1 High initial investment required for purchasing industrial vehicles |
4.3.2 Fluctuating raw material prices affecting manufacturing costs |
4.3.3 Technological challenges in integrating new features and functionalities in industrial vehicles |
5 Turkey industrial vehicles Market Trends |
6 Turkey industrial vehicles Market, By Types |
6.1 Turkey industrial vehicles Market, By Product Type |
6.1.1 Overview and Analysis |
6.1.2 Turkey industrial vehicles Market Revenues & Volume, By Product Type, 2022-2032F |
6.1.3 Turkey industrial vehicles Market Revenues & Volume, By Forklift, 2022-2032F |
6.1.4 Turkey industrial vehicles Market Revenues & Volume, By Aisle Truck, 2022-2032F |
6.1.5 Turkey industrial vehicles Market Revenues & Volume, By Tow Tractor, 2022-2032F |
6.1.6 Turkey industrial vehicles Market Revenues & Volume, By Container Handler, 2022-2032F |
6.2 Turkey industrial vehicles Market, By Drive Type |
6.2.1 Overview and Analysis |
6.2.2 Turkey industrial vehicles Market Revenues & Volume, By Internal Combustion Engine, 2022-2032F |
6.2.3 Turkey industrial vehicles Market Revenues & Volume, By Battery-Operated, 2022-2032F |
6.2.4 Turkey industrial vehicles Market Revenues & Volume, By Gas-Powered, 2022-2032F |
6.3 Turkey industrial vehicles Market, By Application |
6.3.1 Overview and Analysis |
6.3.2 Turkey industrial vehicles Market Revenues & Volume, By Industrial , 2022-2032F |
6.3.3 Turkey industrial vehicles Market Revenues & Volume, By Cargo, 2022-2032F |
7 Turkey industrial vehicles Market Import-Export Trade Statistics |
7.1 Turkey industrial vehicles Market Export to Major Countries |
7.2 Turkey industrial vehicles Market Imports from Major Countries |
8 Turkey industrial vehicles Market Key Performance Indicators |
8.1 Average utilization rate of industrial vehicles |
8.2 Maintenance and downtime costs of industrial vehicles |
8.3 Adoption rate of automated and smart industrial vehicles |
8.4 Average age of industrial vehicle fleet |
8.5 Energy efficiency and emission levels of industrial vehicles |
9 Turkey industrial vehicles Market - Opportunity Assessment |
9.1 Turkey industrial vehicles Market Opportunity Assessment, By Product Type, 2022 & 2032F |
9.2 Turkey industrial vehicles Market Opportunity Assessment, By Drive Type, 2022 & 2032F |
9.3 Turkey industrial vehicles Market Opportunity Assessment, By Application, 2022 & 2032F |
10 Turkey industrial vehicles Market - Competitive Landscape |
10.1 Turkey industrial vehicles Market Revenue Share, By Companies, 2025 |
10.2 Turkey industrial vehicles Market Competitive Benchmarking, By Operating and Technical Parameters |
11 Company Profiles |
12 Recommendations |
13 Disclaimer |
Global Go To Market Strategy - 2030
Export potential enables firms to identify high-growth global markets with greater confidence by combining advanced trade intelligence with a structured quantitative methodology. The framework analyzes emerging demand trends and country-level import patterns while integrating macroeconomic and trade datasets such as GDP and population forecasts, bilateral import–export flows, tariff structures, elasticity differentials between developed and developing economies, geographic distance, and import demand projections. Using weighted trade values from 2020–2024 as the base period to project country-to-country export potential for 2030, these inputs are operationalized through calculated drivers such as gravity model parameters, tariff impact factors, and projected GDP per-capita growth. Through an analysis of hidden potentials, demand hotspots, and market conditions that are most favorable to success, this method enables firms to focus on target countries, maximize returns, and global expansion with data, backed by accuracy.
By factoring in the projected importer demand gap that is currently unmet and could be potential opportunity, it identifies the potential for the Exporter (Country) among 190 countries, against the general trade analysis, which identifies the biggest importer or exporter.
To discover high-growth global markets and optimize your business strategy:
Click Here
Pricing
- Single User License$ 1,995
- Department License$ 2,400
- Site License$ 3,120
- Global License$ 3,795

Leadership Perspectives from Industry Events
Search
Thought Leadership and Analyst Meet


Our Clients
6WResearch In News
- India Air Conditioner Market Set for Strong Rebound in 2026 After Weather-Led Correction and GST-Driven Recovery: 6Wresearch
- ADAS in India: How Automatic Emergency Braking, Blind Spot Detection & Driver Monitoring are Transforming Road Safety
- Doha a strategic location for EV manufacturing hub: IPA Qatar
- Demand for luxury TVs surging in the GCC, says Samsung
- Empowering Growth: The Thriving Journey of Bangladesh’s Cable Industry
- Demand for luxury TVs surging in the GCC, says Samsung
Latest Reports
- Nicaragua RPG Gaming Market (2026-2032)
- New Zealand RPG Gaming Market (2026-2032)
- Netherlands RPG Gaming Market (2026-2032)
- Nauru RPG Gaming Market (2026-2032)
- Namibia RPG Gaming Market (2026-2032)
- Mozambique RPG Gaming Market (2026-2032)
- Montenegro RPG Gaming Market (2026-2032)
- Mongolia RPG Gaming Market (2026-2032)
- Monaco RPG Gaming Market (2026-2032)
- Micronesia RPG Gaming Market (2026-2032)
Industry Events and Analyst Meet

HIMTEX 2026

India Refining Summit 2026

India EV Show 2026

EV tech India Expo 2026

Auto Tech Asia 2026
Whitepaper
- Middle East & Africa Commercial Security Market Click here to view more.
- Middle East & Africa Fire Safety Systems & Equipment Market Click here to view more.
- GCC Drone Market Click here to view more.
- Middle East Lighting Fixture Market Click here to view more.
- GCC Physical & Perimeter Security Market Click here to view more.